Chemical evolution and nature of Damped Lyman- systems
Abstract
We study the nature of Damped Lyman - systems (DLAs) by means of a comparison between observed abundances and models of chemical evolution of galaxies of different morphological type. In particular, we compare for the first time the abundance ratios as functions of metallicity and redshift with dust-corrected data. We have developed detailed models following the evolution of several chemical elements (H, D, He, C, N, O, Ne, Mg, Si, S, Fe, Ni and Zn) for elliptical, spiral and irregular galaxies. Each of the models is calibrated to reproduce the main features of a massive elliptical, the Milky Way and the LMC, respectively. In addition, we run some models also for dwarf irregular starburst galaxies. All the models share the same uptodate nucleosynthesis prescriptions but differ in their star formation histories. The role of SNe of different type (II, Ia) is studied in each galaxy model together with detailed and up to date nucleosynthesis prescriptions. Our main conclusions are: 1) when dust depletion is taken into account most of the claimed overabundances disappear and DLAs show solar or subsolar abundance ratios. 2) The majority of DLAs can be explained either by disks of spirals observed at large galactocentric distances or by irregular galaxies like the LMC or by starburst dwarf irregulars observed at different times after the last burst of star formation. 3) Elliptical galaxies cannot be DLA systems since they reach a too high metallicity at early times and their abundance ratios show overabundances of -elements relative to Fe over a large range of [Fe/H]. 4) The observed neutral gas cosmic evolution is compared with our predictions but no firm conclusions can be drawn in the light of the available data.
keywords:
Galaxies: abundances; Galaxies: evolution; Galaxies: high redshift; Cosmology: observations.1 Introduction
The observations of QSO spectra has led to the discovery of a class of
objects, found almost along any line of sight, whose
study has induced a huge progress in the field of galactic
evolution research. Among these objects, DLA
systems allow us to have the most direct insight into the universe as it
was soon after the growth of galactic structures. These objects possess
a high neutral
gas content (they are characterized by the highest column density of
neutral hydrogen, ) and
metal abundances, which can span from up to of
the solar value.
The
high accuracy achievable in the hydrogen column density
determinations, owing to their occupation of the damped part of the
curve of growth (Bechtold 2001), allows us to assess precise chemical
abundances for many low ionization species, such as SiII, FeII, ZnII.
Notwithstanding this, the real nature of
DLAs is far from being clear. Initially, on the basis of kinematical
considerations, DLAs were associated with rotating proto-disks observed
at epochs before substantial gas consumption has taken place
(see Prochaska &
Wolfe 1997). At the same time, the intermediate redshift imaging has
evidenced a variety of morphological types belonging to the DLA
population, such as low surface brightness (LSB) galaxies, dwarf
galaxies and spirals (Le Brun et al. 1997).
In chemical evolution
models absolute abundances usually depend on all the model
assumptions, whereas the abundance ratios depend only on
nucleosynthesis, stellar lifetimes and IMF. Abundance ratios can therefore
be
used as cosmic clocks if they involve two elements formed on quite
different timescales, typical examples being [/Fe] and [N/]
ratios. These ratios, when examined together with [Fe/H], or any other
metallicity tracer such as [Zn/H], allow us to clarify the
particular history of star formation involved, as shown by
Matteucci (1991, 2001). In fact, in a regime of high star formation rate we
expect to observe overabundances of -elements for a large
interval of [Fe/H], whereas the contrary is expected for a regime
of low star formation. This is due to the different roles played by the
supernovae (SNe) of type II relative to the SNe of type Ia. These latter
in fact, are believed to be responsible for the bulk of Fe and Fe-peak
element production and occur on much longer timescales than SNe II,
which are responsible for the production of the -elements
(i.e. O, Ne, Mg, Si, Ca). For this reason, the analysis of the
relative abundances can enable us to have important hints on
the nature and age of the (proto-)galaxies which give rise to DLA
systems.
In the present work we compare model predictions for
chemical abundances in galaxies of different morphological type with
DLA observed abundances. Therefore, our concern is to distinguish
between abundance patterns dominated by type Ia and type II SNe,
which are usually recognizable through the lack or the presence,
respectively, of enhancement of elements relative to
iron-peak elements. Another chemical element of interest is 14N, whose
nucleosynthetic origin is particularly complex and uncertain.
This element is
mainly produced by low and intermediate mass stars () with a small fraction arising from massive
stars. Nitrogen is mainly a secondary element, in the sense that
is produced in proportion to the carbon and oxygen originally present
in the star. This characteristic enhances the delay of production of
nitrogen owing to the delay resulting from its stellar
progenitors. However, part of N can have a primary origin, in the
sense that it can be produced starting from C and O manufactured by the
star “in situ”.
This can happen during the Asymptotic Giant Branch (AGB) phase
when hot bottom burning acts in conjunction with the third dredge-up
(Renzini & Voli, 1981). This possibility has been recently
confirmed also by other authors (Marigo et al. 1996;1998 and Van den
Hoeck and Groenwegen 1997). Very recently, Maeder and Meynet (2001)
have suggested that rotation in massive stars can be responsible for
the production of some primary N. Thus the [N/O]
and in general the [N/] ratio represents another important
diagnostic tool in chemical evolution, with N restored to the
interstellar medium (ISM) with a large delay relative
to -elements.
Previous
studies of the nature of DLA systems by means of chemical evolution
models (Matteucci et al. 1997; Jimenez et al. 1999; Mo et al. 1998;
Prantzos & Boissier 2000) have suggested that some of these objects
can be disks of spirals in formation, whereas others can be low surface
brightness objects and even starbursting dwarfs similar to the local
very metal poor star-bursting galaxy IZw18.
However, the abundance patterns observable in DLA systems can be interpreted
by means of chemical evolution models only if they are driven
by pure nucleosynthesis.
The presence of dust in DLAs (which is indicated by several clues such
as the reddening of QSOs in presence of DLAs along the line of sight, see Fall
and Pei 1995) can represent a serious complication in pursuing
this task, since its effect is to
deplete some chemical elements (e. g. Fe, Si) more than others (O, Zn)
thus altering the observed abundances.
For this reason, in this paper we have applied dust-corrections to
a set of measured data according to the dust model
discussed in Vladilo (2002a,b),
and we have re-interpreted the observations, reaching
conclusions very different from the ones drawn without considering dust
contamination.
The paper is organized as follows: in section 2 we will describe the current observational and theoretical status of the study of DLA systems; in section 3 we will present a description of the adopted chemical evolution models; in section 4 we will discuss our results and draw the conclusions in section 5. Throughout the paper we express chemical abundances normalized to the solar abundance values measured by Anders and Grevesse (1989) ().
2 Observational and theoretical background
2.1 DLA observations
The strong absorption lines originating in DLA systems can usually be detected with moderate resolution, and the damping profile of the lines permits confortable and accurate measurements of the neutral gas column density, which is crucial in chemical abundance studies (Bechtold 2001). For this reason DLA systems are particularly suitable to chemical evolution studies of the high-redshift universe, where they can be found in large number and allow us to observe galaxies as they were in the very early phases of their history. So far, chemical abundances have been measured in a large (, Molaro 2001) sample of known DLAs (see e. g. Pettini et al. 1994, Pettini et al. 1995, Pettini et al. 1997, Lu et al. 1996, Lu et al. 1998, Prochaska & Wolfe 1999, Centurión et al. 2000, Prochaska & Wolfe 2002 and references therein). The major concerns in abundance determinations are represented by dust-depletion and ionization correction effects. Usually ionization correction effects are neglected because the abundances are derived from dominant ionization states of the elements of interest. In fact, detailed photoionization computations indicate that ionization corrections are usually negligible for the most common elements investigated so far (Howk et al. 1999, Izotov et al. 2001, Vladilo et al. 2001). In the present work particular attention is paid to dust-depletions effects, in particular to the variation of dust-corrections depending on changes in the chemical composition of the DLA systems.
2.1.1 Dust depletions
There are several indications about the presence of dust within DLAs, such as reddening of background quasars in presence of DLA absorbers (Fall & Pei 1995), or gas-phase abundances of trace elements such as Cr, Zn (Pettini et al. 1994). Observations provide hints for selective depletions acting in dense clouds within our Galaxy (Jenkins 1987). The dust content in the highest-redshift systems seems to be reduced relative to the interstellar clouds in our Galaxy (Pettini et al. 1997), possibly owing to the efficient grain-disruption in interstellar shocks following bursts of star formation (Pettini & Bowen 1997). Several authors have developed a formalism aimed at quantifying the effect of dust depletion on DLA abundances by assuming that the dust in these objects is similar to the Galactic interstellar dust and scaling the amount of depletion by including variations of the dust-to-metal ratios (Kulkarni et al. 1997, Vladilo 1998). These methods did not take into account variations of the chemical composition of dust among different systems. Recently, Vladilo (2002a,b) derived an analytical expression which takes into account the interstellar depletions according to the variations of the physical conditions and chemical abundances of the medium. From this scaling law, a new method for estimating dust depletion corrections in DLAs as a function of a set interstellar parameters has been presented, together with a preliminary sample of dust corrected abundances. In the present work we compare, for the first time, dust corrected abundances obtained using this new method with detailed predictions of chemical evolution models.
2.1.2 Are DLAs really enhanced?
The [Si/Fe] ratio can be easily measured in DLA systems.
Its interpretation
is however difficult owing to the differential effect that dust has on
the abundances of Si and Fe.
Several authors have pointed out that the
[/Fe] ratios in DLAs are consistent with the abundances measured
in metal-poor stars of the Milky Way (Lu
et al. 1996, Prochaska et al. 2001a; Pettini et al. 2000),
i. e. with a chemical evolution pattern dominated by type II SN. The
mean observed value gives in fact (Molaro
2001), which is similar to the value observed in Galactic halo stars
with metallicities comparable to the values measured in DLAs.
The observed enhancement, if real and not affected by dust depletion,
could be associated with the halo phase of
a forming disk or
to the formation of a spheroid.
However, in other cases the [Si/Fe] measurements show
little sign of - enhancement (Ellison et al. 2001, Pettini et
al. 1999).
Pettini et al. (1999) consider a set of absorbers at low (z )
redshift and find no evidence
for an enhancement of -elements over iron
and
argue that in LSB galaxies or in
the outskirts of a disk,
where star formation proceeds more
slowly, we could observe nearly solar [/Fe] values also
at low metallicities.
So, in this case, the lack of a clear enhancement would
not necessarily exclude a
connection between DLA sites and galactic disks,
provided that we are
observing the external regions.
As is suggested in Vladilo (1999), the fact that the differential
cross-section for DLA absorption is
(for a disk seen face-on) implies that galactic
regions with larger
have
higher probabilities of detection.
The [S/Zn] ratio represents a valid
alternative and nevertheless a more reliable diagnostic, since both
elements are unaffected by dust depletion.
However, the major concern in estimating S abundances is represented by
the Ly forest,
whose contamination can have serious effects on the measurements.
The available [S/Zn] data do not show the typical enhancement
observed in Galactic metal-poor
stars at metallicity levels comparable to the ones of DLAs
(Centurión et al. 2000).
The emerging picture seems to point
towards different chemical evolution patterns, characterized either by
halo-like or solar abundance ratios. This could be consistent either
with a heterogeneous population of progenitors or with a single type
of objects observed at various phases of their evolution.
2.1.3 Metallicity evolution of DLAs
The metallicity in DLA systems is usually traced by Zn or Fe, whose abundances are easily measurable in DLAs. Metallicities in solar units span the interval - solar, with only a modest increase of the metallicity with decreasing redshift (Pettini et al. 1997, Vladilo et al. 2000, Prochaska & Wolfe 2001). Once the column density weighted metallicity is considered and the diagram is interpreted as an evolutionary one, then there is no statistically significant sign of evolution of the [Zn/H] abundance with redshift in the sense that the systems at lower redshift are the most evolved ones. (Pettini et al. 1999, Vladilo et al. 2000, Prochaska et al. 2001). However, it is dangerous to interpret the [Zn/H] vs z diagram in terms of an age-metallicity relation, since it could rather reflect the specific evolutionary state of different objects formed at different cosmic times, and not necessarily different timesteps in the evolution of objects formed at the same time. Moreover, in interpreting the behaviour of the DLA metallicity, one should keep in mind that the sample of DLAs may be biased against detection of systems of high metal column density. A hint in this direction comes from the results by Boissé et al. (1998), who traced a [Zn/H] vs log N(HI) diagram and noticed an apparent anti-correlation between the metallicity and the column density which is physically difficult to interpret. This could be the result of an observational bias against high metallicity, high density systems which would obscure the QSOs behind them. This fact would imply that these objects can be underepresented in magnitude-limited samples (Pettini et al. 1999, Molaro 2001), and could even cause a high incidence of non-spiral morphologies in the samples (Boissé et al. 1998). The absence of high metallicity, high N(HI) systems could alternatively be explained by higher metallicity regions having significantly consumed their gas reservoirs and therefore having lower HI column densities, as suggested by Prochaska & Wolfe (2001).
2.2 DLA models
Several models of DLAs have been developed so far with various techniques in order to reproduce their observed properties, usually encountering most difficulties in explaining the mild evolution in the metallicity (Prochaska et al. 2001a).
Pei and Fall (1995) treated chemical evolution with a new approach:
they considered
large comoving volumes, representative
of the universe as a whole and containing many DLA systems, and studied
the
metallicity evolution inside these spaces assuming
instantaneous recycling approximation
in the cases of closed-box, inflow and outflow models.
They incorporated in their models a self-consistent correction
for the absorbers
that are missing from the existing samples, which drop out
as a result of dust-obscuration of background quasars, assuming a
dust-to-gas ratio
proportional to the mean metallicity.
Their result reproduced the average properties of the universe
in the past and at the present epoch, but cannot make any prediction on which
morphological types sould be included or excluded from the DLA current
samples.
Matteucci et al. (1997) studied the relative abundances observed in
several DLA systems;
in particular they studied the /Fe
and N/O ratios by means of chemical evolution models for starburst galaxies
and the solar neighbourhood.
They suggested that the high (N/O) ratios observed in a couple of DLAs
(the ones towards QSO0000-26 and QSO1331+1700)
indicate a different chemical evolution than in the Milky Way and spirals in
general, and demonstrated that the most promising models to explain
the observed abundances are those applied to dwarf
irregular galaxies. However, they concluded that the differences in the
abundances observed among different DLAs could be due to
a morphologically heterogeneous population.
Cen and Ostriker (1999) used numerical simulations to study the
metallicity evolution of regions of the universe characterized by
different overdensities , identifying DLAs with zones
with .
They found that the median metallicity in these portions of the universe
increases only slightly from to , with a large
metallicity spread expected at any redshift, in agreement with observations.
They concluded that DLAs do not represent the highest
metallicity sites at any time.
An attempt to identify the morphology of DLAs and their
compatibility with galactic
disks was made by Mo, Mao and White (1998), who studied
the population of galactic disks in hierarchical clustering models
for galaxy formation.
They concluded that galaxies selected as DLAs should be biased
towards low surface densities, pointing to LSB galaxies as
the main candidates
for the high-redshift DLA population.
Jimenez et al. (1999) coupled a disk formation model to a chemical evolution
model to explore the metallicities, dust content
and gas mass density of LSB and high surface brightness (HSB) galaxies;
both high-z
LSB and low-z HSB can reproduce the
observed metallicities, but HSB fail in reproducing the gas density
evolution,
so they suggested that LSB disks could dominate
the DLA high-z population.
Prantzos & Boissier (2000) used chemical evolution models for disk
evolution and found that the mild evolution in the column-density
weighted metallicity is consistent with galactic disks and showed how
observational biases (such as reddening of the background QSOs by the
most dense and metal rich systems) can be consistent with the no-evolution
picture emerging from the current observations.
The global picture emerging from these studies converges to the result that in general a heterogeneous DLA population can explain the observations better than a homogeneous one.
3 Model description
In the present work the chemical properties of DLA systems are investigated by means of detailed chemical evolution models of galaxies of three different morphological types: ellipticals, spirals and irregulars. These models allow one to follow in detail the evolution of the abundances of several chemical species, starting from the matter reprocessed by the stars and restored into the ISM through stellar winds and supernova explosions. Detailed descriptions of the chemical evolution models can be found in Matteucci and Tornambé (1987) and Matteucci (1994) for elliptical galaxies, Chiappini et al. (1997, 2001) for the spirals, Bradamante et al. (1998) and Recchi (2002) for irregular galaxies. All of these models have been updated to include the same nucleosynthesis prescriptions (see later). According to our scheme, elliptical galaxies form as the result of the rapid collapse of a homogeneous sphere of primordial gas (Matteucci 1994) where star formation is taking place at the same time as the collapse proceeds, and evolve as ”closed-boxes”, i.e. without any interaction with the external environment. Star formation is assumed to stop when the energy of the ISM, heated by stellar winds and SNe explosions, is equal to the binding energy of the gas. At this time a galactic wind occurs, sweeping away all the residual gas in the galaxy.
Spiral galaxies are assumed to form as a result of two main infall episodes
(Chiappini et al. 1997). During the first episode the halo forms and
the gas shed by the
halo rapidly
gathers in the center leading to the formation of the bulge.
During the second episode,
a slower infall
of external gas gives rise to the disk with the gas
accumulating faster in the inner than
in the outer
region (”inside-out” scenario, Matteucci & François, 1989). The process of disk formation is
much longer than the halo
and bulge formation, with time scales varying from in the
inner disk,
in the solar region, and up to in the outer disk.
Irregular galaxies are assumed to form owing to a continuous infall
of pristine gas, until a mass of
is accumulated.
The star formation rate proceeds either in bursts
separated by
long quiescent periods or at a low regime but continuously.
We have computed also a new model to describe the
Magellanic irregulars; this
model is tuned to reproduce the Large Magellanic Cloud (LMC), and assumes
two main bursts of star formation with low but continuous star formation
in between.
The main features of the models used here are the following:
1) one-zone for irregulars and ellipticals, multi-zone for spirals
with instantaneous
and complete mixing of gas in each zone;
2) no instantaneous recycling approximation (the stellar lifetimes are properly taken
into account);
3) the evolution of several chemical elements (H, D, He, C, N, O, Ne, Mg, Si, S, Fe, Ni and Zn)
is followed in detail.
4) The nucleosynthesis prescriptions are common to all the models and
include: the yields
of Thielemann, Nomoto & Hashimoto (1996) for massive stars
(M ),
the yields of van den Hoeck & Groenewegen (1997) for
low and intermediate mass stars () and the yields of
Nomoto et al. (1997) for type I a SNe. For the evolution of Zn and Ni we adoped
the nucleosynthesis prescriptions of Matteucci et al. (1993).
3.1 The theory
Let be the fractional mass of the element in the gas within a galaxy, its time-evolution is described by the basic equation:
| (1) |
where is the gas mass in the form of an element normalized to a total initial mass . and are substituted by and in the case of galaxy disks. The quantity represents the fractional abundance by mass of an element , with the summation over all elements in the gas mixture being equal to unity. is the star formation rate (SFR), the fractional amount of gas turning into stars per unit time. represents the returned fraction of matter in the form of an element that the stars eject into the ISM through stellar winds and supernova explosions; this term contains all the prescriptions regarding the stellar yields and the SN progenitor models. The two terms and account for the infall of external gas and for galactic winds, respectively. The quantity is the total fractional mass of gas present in the galaxy at the time t. The main feature characterizing a particular morphological galactic type is represented by the prescription adopted for the star formation history.
In the cases of ellipticals and irregular galaxies the SFR (in ) has a simple form and is given by:
| (2) |
The quantity is the efficiency of star formation, namely the inverse of the typical time scale for star formation.
In the case of ellipticals, (for a baryonic mass of ) is assumed, and it drops to zero at the onset of a galactic wind, which develops as the thermal energy of the gas heated by supernova explosions exceeds the binding energy of the gas (Matteucci and Tornambé 1987), and rids the galaxy of all the residual gas. This quantity is strongly influenced by assumptions concerning the presence and distribution of dark matter (Matteucci 1992); for the model adopted here a diffuse (=0.1, where is the effective radius of the galaxy and is the radius of the dark matter core) but massive () dark halo has been assumed (see Bertin et al. 1992).
In the case of Magellanic irregular galaxies, we have considered a burst-like star formation history (see Bradamante et al. 1998) which is successful in reproducing the [O/Fe] vs [Fe/H] data observed in the Large Magellanic Cloud (LMC) (Hill et al. 2000) and the final LMC gas fraction. Figure 1 shows the evolution in time of the adopted star formation rate (upper panel) and the comparison between the predictions and the observations for the [O/Fe] vs [Fe/H] (lower panel). The star formation is characterized by two bursts, the first occurring at and the second at , both of them with a duration of . During the period in-between the two bursts, a low and constant star formation is taking place. The efficiency of star formation in this case is . As can be seen from the figure, such a star formation history reproduces satisfactorily the observed [O/Fe] vs [Fe/H] pattern. The final gas fraction is, according to our model, (), in agreement with the value measured by Lequeux et al (1979, ). The possibility of a galactic wind is taken into account also for these systems always under the same conditions as for ellipticals. In this case, the wind normally develops during the starburst and ceases immediately afterwards. The wind rate is assumed to be proportional to the star formation rate. The prescriptions for the dark matter halo are similar to those adopted for the ellipticals, namely a massive but diffuse dark halo (see Bradamante et al. 1998 for details).

In the case of spiral galaxies, the SFR expression (Chiappini et al. 1997) is:
| (3) |
where is the star formation efficiency, is the total mass (gas + stars) surface density at a radius r and time t, is the total mass surface density in the solar region and is the gas surface mass density. For the gas density exponent a value of 1.5 has been assumed by Chiappini et al. (1997) in order to ensure a good fit to the observational constraints in the solar vicinity. The efficiency of star formation is set to , and becomes zero when the gas surface density drops below a certain critical threshold; we adopt a threshold density in the disk as suggested by Chiappini et al. (1997). Such value corresponds to a column density of , i. e. well above the DLA detection limit of .
The spiral disk is approximated by several independent rings, 2 kpc wide, without exchange of matter between them.
The rate of accretion of matter, which is assumed to have primordial composition, in each shell is:
| (4) |
where is the surface mass density of the infalling pristine gas; is the time of maximum gas accretion onto the disk, coincident with the halo/thick-disk phase and set equal to 1 Gyr; and are the timescales for mass accretion onto the halo/thick-disk and thin-disk components respectively. In particular, the timescale for the formation of the inner halo, , is assumed to be constant whereas the timescale for the formation of the disk is a function of the galactocentric distance, , according to the ”inside-out” scenario (Chiappini et al. 1997). The quantities and are derived from the condition for reproducing the current total mass surface density distribution in the halo and along the disk, respectively, at the present time.
The initial mass function (IMF) is usually assumed to be constant in space and time in all the models and is expressed by the formula:
| (5) |
where is a normalization constant. In the case of irregulars and ellipticals a Salpeter-like IMF (1955) () has been assumed, whereas for spirals the Scalo (1986) prescription has been adopted ( for , for ). These choices of the IMF have been demonstrated to be the best in reproducing the observational constraints in the solar neighbourood and in the nearby galaxies. In all cases the assumed mass range is .
Tables 1, 2, 3 summarize the adopted model parameters for ellipticals, spirals and irregulars, respectively.
| Elliptical | ||||
|---|---|---|---|---|
| 3 | 11.2 | Salpeter |
| Spiral | ||||
|---|---|---|---|---|
| 0.8 | 1.0 | Scalo |
| Irregular | ||||
|---|---|---|---|---|
| 0.25 | 1 | Salpeter |
4 Results
4.1 The metallicity evolution
Some elements, such as Zn, appear essentially
undepleted in the Milky Way ISM,
therefore they can be
considered as reliable metallicity tracers.
The nucleosynthesis of Zn is a debated issue, since according to
theoretical models
its production can ensue via s-processes in low/high mass stars during
He-core burning as well as during explosive nucleosynthesis events
occurring in type Ia and II supernovae (see Matteucci et al. 1993 and
references therein).
In particular, in our models we assume a Fe-like scaling Zn production
on the basis
of the results of Matteucci et al. (1993), in which a good fit to the
solar abundance of Zn is found if the bulk of its production is
ascribed to type Ia supernovae.
On the other hand, since a non negligible fraction of iron
comes from type II SNe (Thielemann et al. 1996) and the abundance of
Fe seems to vary in lockstep with that of Zn in the solar vicinity, the
SNe II should
also produce some Zn.
In our models the amount of Zn produced through explosive nucleosynthesis
in massive stars
scales with the Fe yield according to:
| (6) |
where represents a multiplicative factor. We have run a chemical
evolution model for the solar vicinity
varying in order to reproduce the
[Zn/Fe] vs [Fe/H] observed in Galactic stars of different metallicities
by various authors
(see Umeda & Nomoto 2002 and references therein).
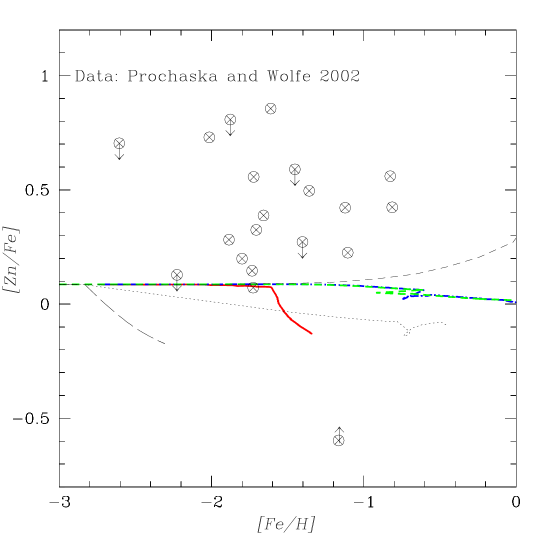
Figure 2 shows the observational [Zn/Fe] vs [Fe/H] distribution compared
with the predictions
for the solar neighbourhood model when two values of are adopted
(dashed line: ; solid line: ).
As can be seen from the figure, the role of type II SNe is important in
determining the shape of the theoretical curve.
Although the data show a remarkable dispersion,
we have assumed the value since with such a prescription the
observed pattern seems best reproduced.
For Zn produced in type Ia SN, we assume a constant value
.

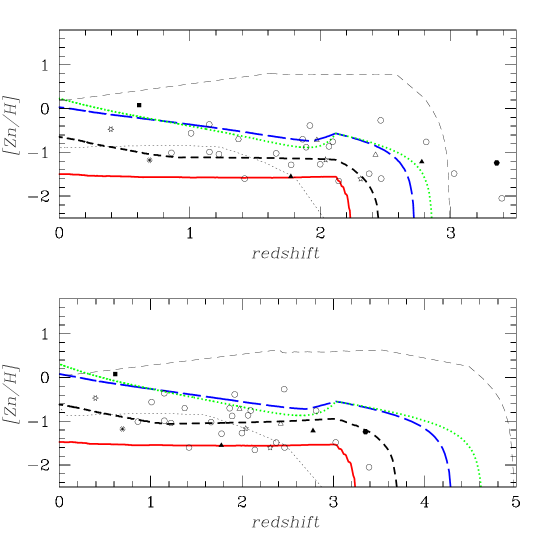
Figure 3 shows the evolution of the [Zn/H] ratio versus redshift for galaxies
of different morphological types, compared to the
values observed in DLAs by various authors.
The scatter in the observed data is large and in principle
can be due to several effects, such as different object ages,
different lines of sight as well as different galactic
morphologies (Vladilo et al. 2000).
We consider the chemical evolution models for galaxies of
different morphological types, i.e. spirals, ellipticals
and irregulars, as described before, and study the [Zn/H] ratio as a
function of redshift
assuming a given cosmology
(the standard CDM cosmology characterized by
and )
and for the sake of simplicity the same formation
redshift for all galaxies ( and ).
In reality, different galaxies are likely to have started to form stars at different
cosmic times. In this case, our model predictions would not change but just shift along the redshift axis, according to the adopted z-t relation.
In particular, for spiral disks we study the chemical evolution at several
galactic radii (4kpc, 8kpc, 14kpc, 18kpc). The chemical enrichment at
different radii is different owing to the variation of the SFR
and infall rate
with galactocentric distance. This is a consequence of the assumed
“inside-out”
picture for the formation of a galactic disk.
In Figure 3 we show the metallicity
evolution for all the
studied galaxies for galaxy formation redshifts (upper panel)
and (lower panel).
In the first case we have difficulties in reproducing the
highest-redshift data because of a too late galaxy formation,
which leads to very low metallicity systems at high z (i. e. ),
especially
in the case of spirals at various radii and irregulars.
On the other hand, elliptical galaxies produce too high metallicities.
In spite of the spread in the data and the fact that some
high-redshift data are lower limits, all these issues could set
a solid constraint on the DLA formation epoch if we assume
that the most metal poor systems represent the most
unevolved ones.
Assuming a global event of galaxy formation
at , all the data are out of the
range spanned by the spirals at all radii.
On the other hand, ellipticals are unlikely to be the dominating
galaxies in the DLA population
because of the high metal content and high [/Fe] ratios
predicted for these objects
at high redshift.
If we assume instead the formation epoch at , practically all data fall
in the range of existence of the spirals at
various radii (only the 3 highest metallicity systems are excluded)
and of the irregular galaxies.
This leads us to suggest that the formation
epoch for the bulk of the DLA population could have occurred at
redshifts between and .
4.2 The vs Fe-peak ratio
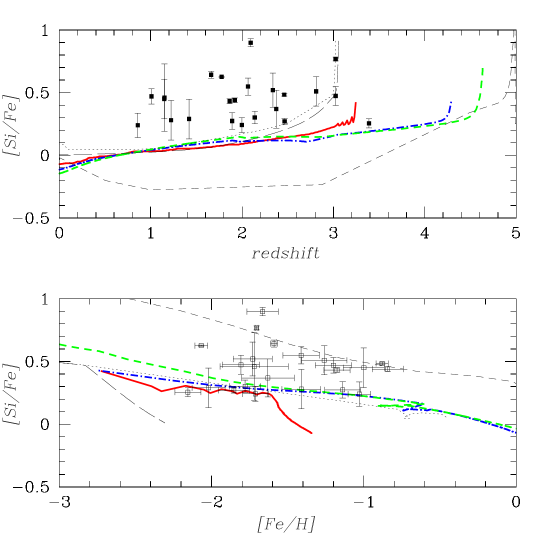
Figure 4 shows the [Si/Fe] distribution versus redshift (above) and [Fe/H] (below),
as predicted by models of galaxies of
different morphological types and compared with uncorrected
DLA data from various authors (Vladilo 2002b and references therein).
In particular, we plot predictions relative to a
typical spiral like the MW at various galactocentric distances,
to a typical elliptical, to a galaxy like the LMC and to a star-bursting dwarf which
has suffered only one burst of star formation.
We consider,
at the same time, the [/Fe] ratios versus metallicity
(usually Fe or Zn) distribution,
which is completely independent of cosmological parameters.
As can be seen from the evolution as a function of redshift,
in all cases the predictions from the models show a short
initial phase which is characterized by
an overabundant [/Fe] ratio, during which type-II SNe are the
main contributors to the chemical
enrichment of the ISM. This phase ends when type Ia SNe begin
to appear.
In fact, after a given time,
which is a strong function of the SN Ia
progenitor lifetimes and of the star formation
history characterizing a given galactic morphological type
(see Matteucci & Recchi, 2001),
type Ia SNe start to explode restoring the bulk of the
iron-peak elements, thus causing the decrease in the
[/Fe] ratios.
The disk-models at different radii experience the initial enhancements
at various epochs: generally the
smaller the radius at which the chemical evolution is computed,
the earlier and the more pronounced
is the peak in the [/Fe] ratio.
This is due to the different star formation histories occurring at different
radii: a stronger star formation,
owing to a higher gas density, is typical of the innermost regions,
which mimic an elliptical-like star formation. On the other hand,
at larger radii the star formation is less intense, and this implies a
later and weaker peak in the [/Fe], similar to what happens in irregular galaxies.
It is also worth noticing that
the [/Fe] vs [Fe/H] plots
show a quite different behaviour relative to the [/Fe] versus redshift plots.
In particular, while in the former plots the ellipticals show a higher
[/Fe] ratio than the other galaxies over the complete [Fe/H] range, in the redshift plot the situation is reverted. This is due to the fact that the two kinds of plots give us different physical information;
the [/Fe] versus [Fe/H] relation shows
that the gas in a galaxy with an intense star formation should have an
overabundance of -elements for a larger range of [Fe/H] values, owing to the fact that the large number of type II SNe
produces high [Fe/H] values in a time shorter than the typical timescale
of type Ia SNe.
In other words, a short redshift interval can contain a large interval of [Fe/H] values. Therefore, the plots as functions
of redshift (cosmic time) and [Fe/H] behave in the opposite way.
In the case of the [Si/Fe] ratio we can rely on a large data sample.
Usually both Si and Fe abundances can easily be assessed in DLA systems,
none of the two being affected by
Lyman- contamination or severe saturation.
The only concern is dust depletion, which
usually affects both elements, although in different amounts.
In figure 4 we show two plots: [Si/Fe] vs z (upper panel) and [Si/Fe] vs [Fe/H] (lower panel).
The data shown in the figures are not yet dust corrected.
In both plots the majority of observed systems
shows strong signs of Si enhancement.
In the [Si/Fe]-redshift evolution no morphological type can
satisfactorily reproduce the data.
If we consider the [Si/Fe] vs [Fe/H] diagram, all but one of the
most metal-poor systems
(the ones with [Fe/H]-1.8) are fairly consistent with spiral/irregular
patterns.
For [Fe/H]-1.8, we have several values reproduced by the elliptical
model, a small fraction of points
in-between the elliptical and the spiral/irregular curves and another
fraction of data reproduced by
spirals and irregulars.
However this observed trend would reflect a real overabundance of Si with respect
to the
iron-peak elements only in the complete absence of dust.
If we consider that the dust content scales with the metallicity,
the only systems where the influence of dust depletion can be small
are the most metal-poor,
as noticed by Pettini et al. (1995).
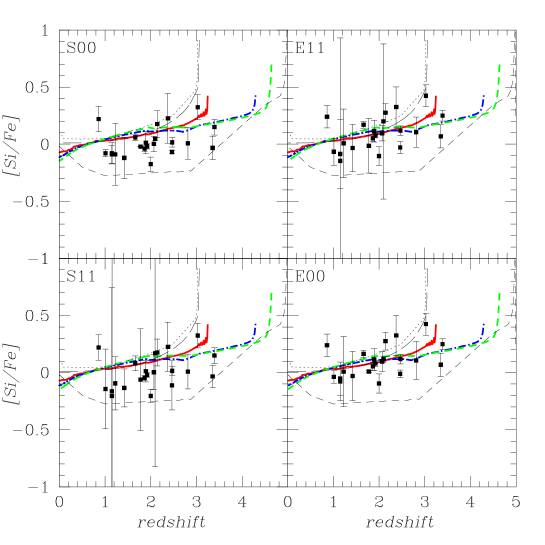
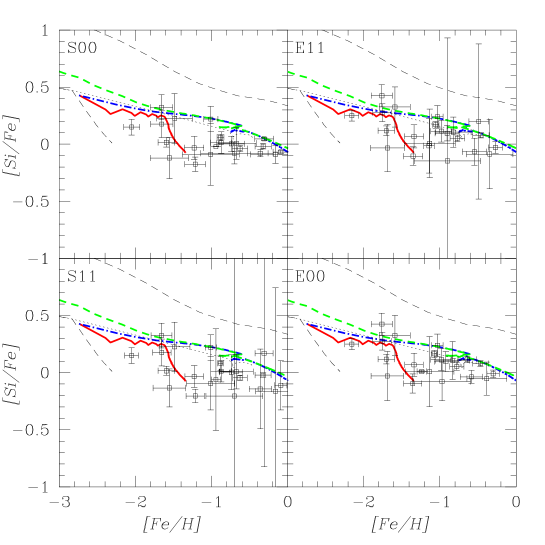
Figures 5 and 6 show the results of the comparison between the model
predictions and observations for the
[Si/Fe] vs z and [Fe/H], respectively,
in the case of dust-corrected data. The corrections have
been calculated
according to the dust model discussed in Vladilo (2002a,b), where
a scaling law for interstellar depletion has been derived allowing
the chemical composition of dust to vary according to changes both
in the dust-to-metals ratio and/or in the abundances in the medium.
Here we present four different assumptions about two parameters
connected to the dust;
one parameter is the [Zn/Fe] ratio and the other is ,
as defined by Vladilo, which indicates the percent variation of
the abundance of a given element in the dust which occurs in correspondance
of a percent variation of the abundance of the same element in the medium
(see eq. 14 of Vladilo 2002a for the definition of this parameter).
We refer to the four cases as model S00, S11, E00
and E11. Letters S and E refer to the adopted assumptions
for [Zn/Fe] (S,
E) The first number refers to the adopted
value for the element Zn and the second number is the
value for the element Si.
In all these cases the -enhancement is considerably less
pronounced than previously
or even absent.
Generally, the dust corrections reduce the
[/Fe] ratios by
dex,
which is enough to lower them to the solar value.
The predicted [Si/Fe] versus redshift and [Fe/H] relations in Figures 5 and 6
show a much better agreement with the data than in Figure 4.
In particular, most of the data now seem to be well reproduced by
models of spirals and
irregulars, whereas elliptical galaxies can never fit the points.
This is because in the very early
phases the ellipticals reach too high values of the [Si/Fe]
ratio. Later on, the release of the
Fe-peak elements by type Ia SN
is strong enough to lower [Si/Fe] to values strongly undersolar,
too small if compared with the other
galaxies.
The subsequent increase of [Si/Fe] at very late times is due to the fact
that low mass stars () are dying and restoring unprocessed material
which contains the [Si/Fe] present in the ISM when they formed, and
therefore enriched in Si relative to Fe.
Spiral galaxies evolve
with smoother and less intense star formation histories than ellipticals
and never reach such
high enhancements of the [/Fe] ratios,
but they can have high final metallicities,
especially in the most internal regions,
thus they can reproduce the observed trend with noticeable accuracy at
all metallicities.
In principle it is very difficult to distinguish between typical low,
smooth star formation patterns in
irregular galaxies and in spiral disks considering only the pure redshift
evolution of the abundance ratios such as
[Si/Fe] since, as can be seen from the two figures, an irregular galaxy
with a huge gas content and a very low
star formation can show an evolution of [Si/Fe] which is essentially
identical to that of the external region of a spiral galaxy.
Furthermore, the chemical evolution histories of a spiral galaxy
computed at different radii can be very similar
to each others, with the only difference represented by the height
and the epoch of the initial peak of
-enhancement, which is usually very short (as can be seen in figure 4, since for all the curves of
the spiral and of the irregular are overlapping).
On the other hand, differences in the evolution patterns are more evident in the plots as functions of [Fe/H].
This is a clear example of the power of the
the [/Fe]-[Fe/H] diagrams
in distinguishing between the different chemical evolution
histories and in particular to understand which
morphological types best represent the DLA population.
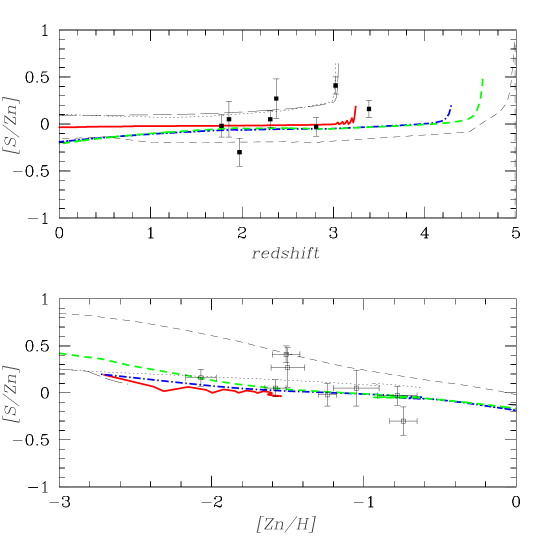
Fig. 7 shows the [S/Zn] distribution versus redshift (above) and versus [Zn/H]
(below) for different morphological types compared with measurements in DLAs.
Notwithstanding the large dispersion in the redshift distribution, a general trend is clearly
observable, in which most of the points are fitted by spiral/irregular curves.
Once again, the evolution of the [S/Zn]
ratio for elliptical galaxies is too sharp to reproduce the bulk of the data,
since it is too high in the initial
phase and falls to too low values already at .
Again, the [S/Zn] vs [Zn/H] plot is a more reliable
chemical evolution diagnostic than the [S/Zn] vs. redshift evolution.
We note that both irregulars and spirals (at inner radii and in
a region equivalent to the solar neighbourhood)
can reproduce satisfactorily most of the observed values.
Only one point, corresponding to the most enhanced value, is consistent
solely with the elliptical evolution, whereas another DLA system has a
[S/Zn] value lower than the predictions of all the models considered here.
We stress the fact that in general the results concerning
the [S/Zn] vs z, [Zn/H]
distributions tend to confirm what has been concluded in the case of dust-corrected [Si/Fe] vs z, [Fe/H], as expected, since both Zn and S should not be
affected by dust depletion.
4.3 The Fe-peak elements
In this case we study the evolution with redshift and metallicity of
[Ni/Fe] and [Zn/Fe] ratios.
Figures 8-11 show the results.
In spite of the scatter of the points around the solar value,
the majority of them appears moderately enhanced in both cases,
at variance with what can be observed in the Galactic ISM.
It is worth noting that,
when the most recent values of Ni oscillator strengths are taken into
account,
the parameters for dust correction of Ni and Fe happen to be
almost identical (Vladilo 2002b; Table 1) and the Ni/Fe ratios
are essentially free of dust effects.
Therefore,
the application of the dust correction method does not change the values of
the ratios.
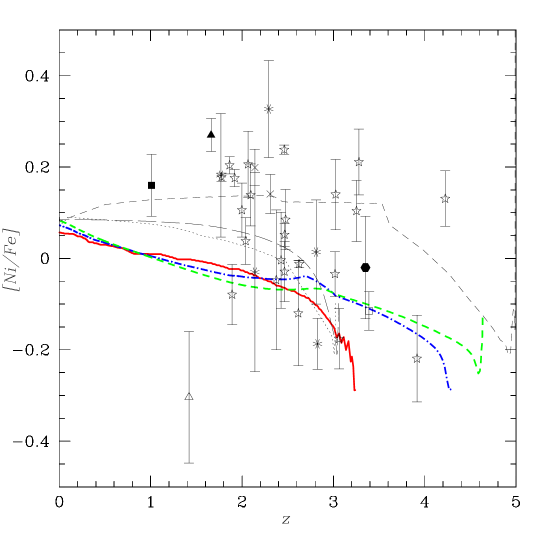
In Figure 8 we plot the available [Ni/Fe] measurements without dust corrections.
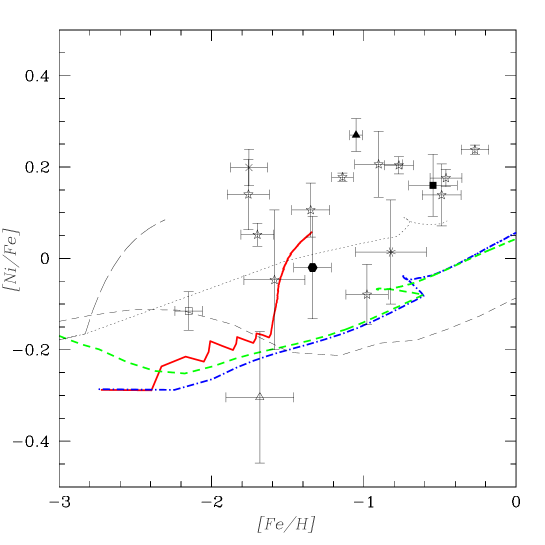
In Fig. 9 we plot the measurements of
[Ni/Fe] versus [Fe/H], where only the [Fe/H] values have been
corrected for dust depletion
using the set of parameters E11.
Very similar results are obtained using the sets of parameters
S00, S11 and E00.
The sample of Fig. 9 is smaller than that of Fig. 8
because it includes only the DLAs for which
the dust correction procedure can be applied.
In the redshift evolution plot of the [Ni/Fe] (Fig. 8),
the lowest values are well reproduced by the
irregular-spiral curves, but there are some points
which are
consistent with an elliptical-like evolution; the highest values instead
are off-scale
for any galactic model. However, this
behaviour might be due to the uncertainties present in
the theoretical yields of
Fe-peak elements
(Matteucci et al. 1993; Timmes et al. 1995; Umeda & Nomoto, 2002).
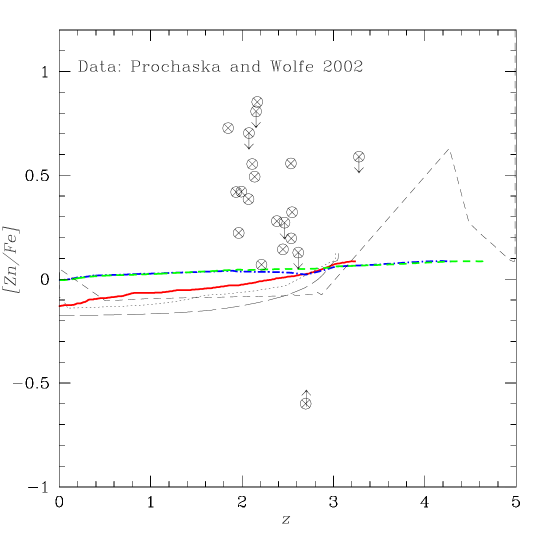
In the [Zn/Fe] case the observed enhancement is even stronger, and
most of the
data would be consistent with the elliptical peak, if it occurred between
redshifts 2 and 3, but these data are not dust corrected and therefore
no firm conclusions can be drawn.
The nearly flat behaviour of the [Zn/Fe] ratio predicted for the irregular,
inner disk, solar neighbourhood and elliptical models is essentially
due to the fact that, according to the nucleosynthesis
prescriptions assumed here,
Zn and Fe follow each-other since
both are mainly produced in SNe Ia.
The outer regions of the disk have a different behaviour because
of the assumed
threshold density for the star formation rate.
This effect is more pronounced in the external regions
than in the inner regions,
because of the gas density profile,
which is strongly decreasing
with galactocentric radius and hence closer to the threshold value in the outermost regions of the disk.
As a consequence of this, the star formation regime is a starburst-like.
The existence of uncertainties in the Ni nucleosynthesis prescriptions
prevents us from drawing firm conclusions about the behaviour of the [Ni/Fe]
vs. [Fe/H] and redshift. On the other hand, the predictions of our models
indicate that, at least to first order, the productions of Zn and Fe
can be considered strictly linked together and independent from metallicity.
Based on this result, the observed spread in the [Zn/Fe]
values may be ascribed more to effects of dust
(such as differential dust depletion of Fe and Zn, differential dust
pollution along different lines-of-sight, different amounts of dust
within DLA systems) than to pure nucleosynthesis.
4.4 The [N/ ratio
N is expected to be
restored into the ISM after oxygen, with a time delay depending
on the lifetimes of its stellar progenitors.
In particular, N is mainly produced in low and intermediate mass stars
which start dying after since the beginning of
star formation. The bulk of N production occurs after Myr
(Henry et al. 2000; Chiappini et al. 2002).
For this reason the [N/O] ratio, provided that its evolution is computed correctly,
is a useful “cosmic clock”, in the sense
that it can be important in dating
galaxies (Matteucci et al. 1997).
Therefore, the N/O ratio in DLAs is important in order to
understand the nature and the age of DLAs.
(Pettini et al. 1995, Lu et al. 1998, Centurión et al. 1998,
Ellison et al. 2001).
Matteucci et al. (1997) attempted to explain the N/O ratios observed in
several DLAs by comparing them with the evolutionary tracks of [N/O]
computed for galaxies with different histories of star formation.
They concluded that some of the examined
systems, those with the highest N/O, could be dwarf irregulars
experiencing their first
or one of their first bursts of star formation, whereas others could
be spirals in the earliest phases of their evolution. They also studied
the nature of the
production of N as primary or secondary element, showing the possibility
of explaining large N/O ratios even at low O abundances if
primary N were produced by massive stars.
In the present study we assume a set of yields for intermediate mass stars
in which N is produced both as primary and secondary element
(Van den Hoeck and Groenwegen 1997).
However, the calculations of the yields for N
for low and intermediate mass stars
present some uncertainties, since they depend on several free parameters,
as is discussed in Chiappini et al. (2002).
Owing to these uncertainties, all our models tend to overestimate the N abundances,
which should be regarded as upper limits.
The number of nitrogen measurements in DLAs is not very
large owing to the difficulty of measuring the NI lines inside
the Ly- forest. In order to have a sample
of [N/] data sufficiently large,
we have chosen to study the [N/Si] ratio, since it
is much easier to measure Si than O in DLAs.
Nitrogen is believed to be unaffected by dust, but
silicon experiences some
depletion, which may affect the [N/Si] and [Si/H] measurements.
However, given the small amount of Si depletion observed in many systems,
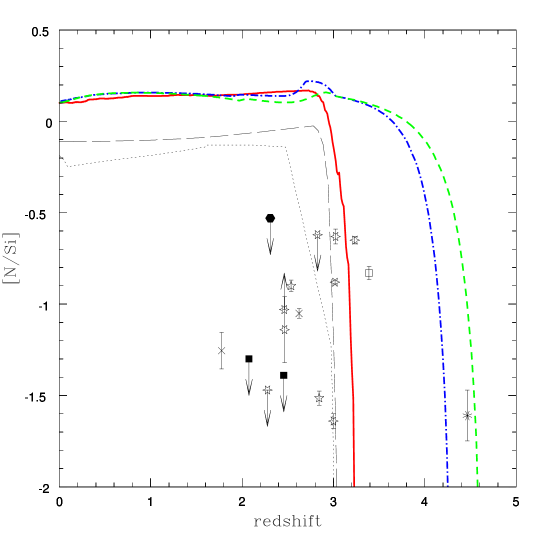
we have chosen to plot
in Figs. 12 and 13 the full sample of DLAs with
[N/Si] data not corrected for dust, which includes 17 systems.
For a few of them, the [N/Si] may be overestimated and the
[Si/H] underestimated owing to dust effects.
From Figure 12,
one can see that most of the systems lie at redshifts indicating
the possibility that they have formed at rather than at as
assumed in the figure. This fact reinforces the conclusion that it is problematic
to assume that the abundances versus redshift can be interpreted as an
evolutionary diagram in analogy with the stellar abundances in the Galaxy.
Moreover, Figure 12 suggests that the majority of DLAs correspond either to outer regions
of spirals or irregular galaxies.
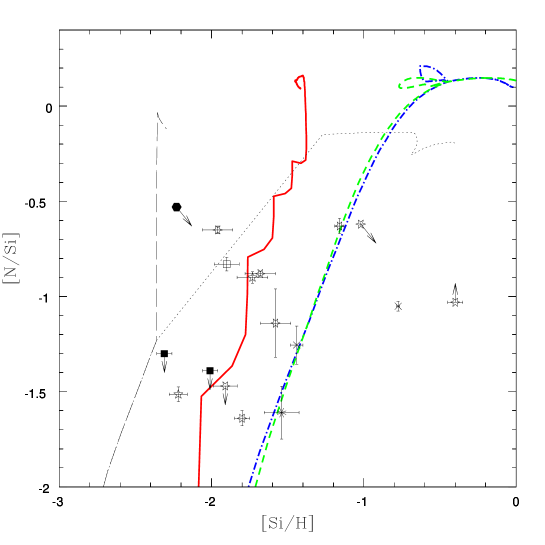
In Figure 13 we report the [N/Si] versus [Si/H] where
it is evident that
the inner regions of spirals and the solar neighbourhood region
have very similar and smooth curves, so the study of the N/Si ratio
is not suited to distinguish
between these regions.
On the other hand,
the model corresponding to the most external radius of the spiral galaxy shows a
very different behaviour.
This is again the effect due to
the star formation threshold.
Again, from Figure 13 we can conclude that most of the observed
DLA systems can be
reproduced either by different regions of spiral disks or by dwarf irregular
starbursting galaxies (see also Chiappini et al. 2002).
In fact, in a regime of starburst the [N/Si] ratio is decreasing and increasing
during the starburst and interburst phases,
respectively. We are not showing here all the possible cases to avoid complications,
but we suggest that
objects with relatively
high [Si/H] and undersolar [N/Si] could also be dwarfs observed during a starburst
which follows
previous star formation events.
The predictions for ellipticals are not shown in Figure 13 because they
would lie at too high metallicities. This reinforces the conclusion that
ellipticals are not likely to be DLA objects.

4.5 The evolution of the HI density
The high redshift neutral gas density is traced mainly by DLAs, since
these systems represent the largest gas reservoirs
and are likely to dominate the mass density of neutral gas in the universe
(Storrie-Lombardi et al. 1996).
Recent DLA studies at low redshift (, Rao & Turnshek 2000) seem to indicate,
when compared with data at high redshift,
a weak
(or totally absent) evolution of
(i. e. the comoving HI density divided by the critical density of the universe),
with a nearly constant value.
On the other hand, the values inferred from the 21 cm emission studies (Zwaan et al.
1997) and optical surveys (Rao & Briggs 1993) are noticeably lower than
the high redshift estimates, thus indicating some evolution.
According to these studies, large spiral galaxies
have been confirmed to be the major contributors to the total HI mass in the local universe
(see also Zwaan et al. 2001).
However, the very recent Arecibo Dual-Beam survey (Rosenberg & Schneider 2002) yields a total HI mass
density substantially higher than the previous estimates, with a non-negligible contribution
from low-mass sources.
In summary, the situation is still unclear and it is difficult to assess from the available
data whether there is evolution or not.
In Figure 14 we plot the evolution of the comoving density of neutral gas
with redshift as predicted for irregular and spiral galaxies at different radii
and compared with various observations (Péroux et al. 2001,
Rao & Turnshek 2000, Zwaan et al. 1997, Rosenberg & Schneider 2002).
In figures 14 (a) and (b)
the predicted curves have been normalized in order to reproduce the value
measured by Zwaan et al. (1997) and Rosenberg & Schneider (2002), respectively.
In the case of the upper panel, where we consider the lower value for
at the present time (Zwaan et al. 1997),
both the external disk (R=14 kpc) and the irregular galaxy seem the most promising in reproducing the
data, since they represent the slowest evolving systems having
at any time (i.e. redshift) the right amount of gas to reproduce each point.
In the case of the lower panel (figure 14b), where the higher value from Rosenberg & Schneider (2002) is adopted
for the normalization at ,
the irregular and external spiral fail in reproducing the high redshift
points, which are substantially lower than the predictions, whereas the solar neighbourhood curve is
the one in best agreement with each point.
We conclude that the study of the neutral H evolution cannot be considered as a good diagnostic in
order to understand which galaxies are dominant in the high-redshift DLA population,
at least until the low redshift measures will be more homogeneous than they are at the present time.
In fact, from the observational point of view,
the low
redshift region () is particularly uncertain, since
the Lyman- line drops out of the visible atmospheric window
and many
systems are supposed to be metal (i. e. dust)-rich causing severe
complications in the measurements.
A larger sample of DLAs,
preferentially based on a radio-selected QSO sample,
is therefore required
in order to shed light on the real evolution of the neutral gas in the redshift range
untestable with the
earth based optical telescopes.
The first results in this field come from the CORAL survey (Ellison et al. 2001a), in which a set
of 22 DLAs has been assembled.
Although the authors stress that their results are tentative,
given the limited size of the data set, they conclude that
magnitude limited, surveys, based on optically selected QSOs,
underestimate the number of DLAs and the detected neutral gas mass by no
more than a factor of two.
5 Conclusions
We have investigated the chemical properties of DLA systems by means of
detailed chemical evolution models for galaxies of different
morphological types, i. e. ellipticals, irregulars and spirals.
In the case of spiral galaxies, we run a multizone code in order to
disentangle the different chemical evolution histories at various
galactocentric radii, which can differ substantially from each other,
giving rise to very
different abundance patterns. We compared our predictions
for [Si/Fe], [Ni/Fe], [Zn/Fe] and [N/Si]
with observational data either as functions of [Fe/H] or redshift.
The simultaneous comparison of the abundance ratios
as functions of metallicity (e.g. [Fe/H]
and/or [Zn/H]) and redshift provides
stronger constraints on the nature of DLA systems, and this
is the first time that this possibility was taken into account.
Our main goal was to infer the nature and possibly the age
of the DLA population,
by means of the [/Fe] and the [N/] ratios.
We have assumed that all galaxies formed either at redshift
or , but this assumption, which might be unrealistic,
influences only the diagrams
as functions of redshift, not those as functions of metallicity.
In several cases, we have compared our model predictions
with
abundance
measurements not dust-corrected with the exception of the [Si/Fe] and [Ni/Fe]
ratios versus [Fe/H] which have been
compared also with a set of data dust-corrected according to
the prescriptions of Vladilo (2000a,b).
Finally, we have studied the redshift evolution of the neutral
gas density, which can be useful to gain information
on the formation epoch and global evolution of the DLA population
and on the average evolution of the neutral gas in the universe,
provided that
DLAs really represent the largest gas reservoirs, i. e. that biases
do not affect the observations, thus
excluding some systems from the samples.
Our main results can be summarized as follows:
1) Under the assumption that galaxy formation occurred at for all the objects,
we can reproduce the observed dispersion in DLA metallicity
in the plot [Zn/H] versus redshift, by considering
evolutionary models for disk galaxies computed at different distances
from the galactic centre.
On the other hand, we cannot exclude that the same DLAs have started forming stars at different cosmic epochs.
Therefore, DLA systems cannot be treated as the stars in the Milky Way
which trace, with their metallicity, the evolutionary history of the
gas in the Galaxy.
Our results, together with
observational evidence concerning DLA systems, namely:
i) at the typical metallicity of the DLA galaxies is
approximately of solar, ii) the
paucity or absence of low ( solar)
metallicity objects and iii) a relevant metal enrichment observed in many
systems at , leads us to suggest that a substantial fraction of
the DLA
systems was already in place at and that is likely that they started forming stars between z=5 and z=3.
2) The -enhancements relative to refractory elements (e.g. Si and Fe)
observed in many systems
vanishes once dust-corrections are considered. The resulting almost
solar values for these ratios
are found to be consistent with the
evolution of both irregular (including star-bursting dwarfs) galaxies or spiral disks
seen at various galactocentric distances.
For the DLAs with the lowest metallicities the irregulars and the outer regions
of spiral disks
best reproduce the data. In fact, the external regions of spiral disks,
where the low density causes frequent oscillations in the star
formation above and below the threshold level, show a behaviour similar to
starburst galaxies. Such a weak and gasping star formation history seems
to be
the most promising in reproducing the majority of the observations ([/Fe], [N/], [Zn/H], [Ni/Fe]).
This regime of star formation is also typical of dwarf irregulars and
low surface brightness galaxies and therefore we cannot exclude that
DLAs could also be such systems.
However, both irregulars and outer disks cannot cover all the metallicity
range spanned by the observations.
At higher metallicities the observations are better
reproduced by considering an inner disk/solar
neighbourhood-like evolution.
This result is confirmed by the comparison between model predictions
and observations of the [S/Zn] ratios, both of which are
unaffected by dust depletion, so their pattern reflects pure
nucleosynthesis.
By means of a photometric code (Jimenez et al. 1998) matched to our
chemical evolution models,
we have performed
a prediction regarding the luminosity of a DLA system either if the absorption occurred
in a spiral or an irregular galaxy.
Assuming galaxy formation at , at
the magnitude of a typical spiral in the
I band is , which corresponds to a luminosity ,
where is the charactistic luminosity of the Lyman Break Galaxies at
(Steidel et al. 1999).
In the case of an irregular galaxy, , corresponding to a luminosity
.
Both values are consistent with the limits of derived
by Prochaska et al. (2002a) for DLA systems.
3) The predictions of our models indicate that, at least to first order,
the evolutions of Fe and Zn can be considered strictly linked and
independent of metallicity.
Based on this result, the observed spread in the
[Zn/Fe] vs [Fe/H] diagrams
should be due more to the dust
(like differential dust depletion of Fe and Zn, differential dust
pollution along different lines-of-sight, different amounts of dust
within DLA systems) than to pure nucleosynthesis. We do not feel safe in
drawing conclusions about the behaviour of the [Ni/Fe] ratios because of the
uncertainties still present in the nucleosynthesis of nickel.
4) Given the uncertainties in low redshift measures, at the present time
the study of the neutral H evolution cannot be considered as a good diagnostic in
order to understand which galaxies are dominant in the high-redshift DLA population.
A larger sample of DLAs,
preferentially based on a radio-selected QSO sample,
is required
in order to shed light on the real evolution of the neutral gas in the redshift range
untestable with the
earth based optical telescopes.
5) From the chemical evolution point of view,
elliptical galaxies are the most unlikely DLA candidates at
all metallicities because of the very high metallicities and
overabundances of -elements reached at the early phases of
their history, when a type II SN chemical enrichment is dominant.
Elliptical galaxies are perhaps better candidates to explain the Lyman-break
galaxies (see Matteucci & Pipino, 2002).
Acknowledgments
We are grateful to I.J. Danziger for reading the manuscript and useful suggestions. We also thank C. Chiappini, C. Péroux, A. Pipino and S. Cristiani for many useful discussions, and H. Umeda for having kindly provided the compilation of data in figure 2. Finally, we wish to thank an anonymous referee for many comments which improved the quality of our work.
References
- [] Anders, E., Grevesse, N., 1989, Geochim. Cosmochim. Acta, 53, 197
- [] Bechtold, J., astro-ph/0112521
- [] Bertin, G., Saglia, R. P., Stiavelli, M., 1992, ApJ, 384, 423
- [] Boissé, P., Le Brun, V., Bergeron, J., Deharveng, J., 1998, A&A, 333, 841
- [] Boissier, S., Prantzos, N., 1999, MNRAS, 307, 857
- [] Bradamante, F., Matteucci, F., D’Ercole, A. 1998, A&A,337, 338
- [] Cen, R., Ostriker, J. P., 1999, ApJ, 519, L109
- [] Centurión, M., Bonifacio, P., Molaro, P., Vladilo, G., 1998, ApJ, 509, 620
- [] Centurión, M., Bonifacio, P., Molaro, P., Vladilo, G., 2000, ApJ, 536, 540
- [] Centurión, M., et al., 2002, in preparation
- [] Chiappini, C., Matteucci, F., Gratton, R. 1997, ApJ,477, 765
- [] Chiappini, C., Matteucci, F., Romano, D., 2001, ApJ, 554,1044
- [] Chiappini, C., Matteucci, F., Romano, D., 2002, MNRAS, accepted, astro-ph/0209627
- [] Cowie, L. L., Songaila, A., Barger, A. J., 1999, 118, 603
- [] Dessauges-Zavadsky, M., D’Odorico, S., McMahon, R. G., Molaro, P., Ledoux, C., Péroux, C., Storrie-Lombardi, L. J., 2001, A&A, 370, 426
- [] Ellison, S. L., Pettini, M., Steidel, C. C., Shapley, A. E., 2001, ApJ, 549, 770
- [] Ellison, S. L., Yan, L., Hook, I. M., Pettini, M., Wall, J. V., Shaver, P., 2001a, A&A, 379, 393
- [] Fall, S. M., Pei, Y. C., 1995, in QSO absorption lines, Meylan, G. ed., p. 23
- [] Fedchak, J.A.,Wiese, L.M., Lawler, J.E., 2000, ApJ 538, 773
- [] Henry, R. B. C., Edmunds, M. G., Koeppen, J., 2000, ApJ, 541, 660
- [] Hill, V., Francois, P., Spite, M., Primas, F., Spite, F., 2000, A&A, 364, L19
- [] Howk, J. C., Savage, B. D., Fabian, D., 1999, ApJ, 525, 253
- [] Izotov, Y. I., Schaerer, D., Charbonnel, C., 2001, ApJ. 549, 878
- [] Jenkins, E. B., 1987, in Interstellar Processes, ed. D. J. Hollenbach & H. A. Thronson (Dordrecht: Reidel), 134, 533
- [] Jimenez, R., Padoan, P., Matteucci, F., Heavens, A. F., 1998, MNRAS, 299, 123
- [] Jimenez, R., Bowen, D. V., Matteucci, F., 1999, ApJ, 514, L83
- [] Kulkarni, V. P., Fall, S. M., Truran, J. W., 1997, ApJ, 484, L7
- [] Lanzetta, K. M., Wolfe, A. M., Turnshek, D. A., 1995, ApJ, 440, 435
- [] Le Brun, V., Bergeron, J., Boissé, P., Deharveng, J. M., 1997, A&A, 321, 733
- [] Lequeux, J., Rayo, J. F., Serrano, A., et al., 1979, A&A , 80, 155
- [] Lòpez, S. Reimers, D., Rauch, M., Sargent, W.L.W., Smette, A., 1999, ApJ, 513, 598
- [] Lu, L., Sargent, W. L., Barlow, T. A., Churchill, C. W., Vogt, S. S., 1996, ApJ, 107, 475
- [] Lu, L. and Sargent, W. L., Barlow, T. A., 1998, ApJ, 115,55
- [] Maeder, A., Meynet, G., 2001, A&A, 373, 555
- [] Marigo, P., Bressan, A., Chiosi, C., 1998, A&A, 331, 564
- [] Marigo, P., Bressan, A., Chiosi, C., 1996, A&A, 313, 545
- [] Matteucci, F., François, P., 1989, MNRAS, 239, 885
- [] Matteucci, F., 1991, SN 1987A and Other Supernovae, I. J. Danziger & K. Kjar eds., ESO, Garching, 703
- [] Matteucci, F., Raiteri, C. M., Busso, M., Gallino, R., Gratton, R., 1993, A&A, 272, 421
- [] Matteucci, F., Tornambé, A., 1987, A&A,185, 51
- [] Matteucci, F., 1992, ApJ,397, 32
- [] Matteucci, F., 1994, A&A, 288, 57
- [] Matteucci, F., Molaro, P., Vladilo, G., 1997, A&A, 321,45
- [] Matteucci, F., Recchi, S., 2001, ApJ, 558, 351
- [] Matteucci, F., 2001, The chemical evolution of the Galaxy, Astrophysics and space science library, Volume 253, Dordrecht: Kluwer AcademicPublishers
- [] Matteucci, F., Pipino, A., 2002, ApJ, 569L, 69
- [] Meyer, D. M., York, D. G., 1992, ApJ, 399, 121
- [] Meyer, D. M., Lanzetta, K. M., Wolfe, A, M., 1995, ApJ, 451, 13
- [] Mo, H. J., Mao, S., White, S. D. M., 1998, MNRAS, 295, 319
- [] Molaro, P., 2001, The link between Stars and Cosmology, eds. M. Chavez, A. Bressan, A. Buzzoni & D. Mayya eds., Kluwer Academic Publishers, in press
- [] Molaro, P., Bonifacio, P., Centuriòn, M., D’Odorico, S., Vladilo, G., Santin, P., Di Marcantonio, P., 2000, ApJ, 541, 54
- [] Nomoto, K., Iwamoto, K., Nakasato, N. T., et al., 1997, Nucl. Phys. A, 621, 467c
- [] Pei, Y. C., Fall, S. M., 1995, ApJ, 454, 69
- [] Péroux, C., McMahon, R. G., Storrie-Lombardi, L. J., Irwin, M. J., astro-ph/0107045, submitted to MNRAS
- [] Péroux, C., Petitjean, P., Aracil, B., Srianand, R., 2002, New Astronomy, accepted, astro-ph/0208450
- [] Pettini, M., Smith, L., Hunstead, W., King, D. L., 1994, ApJ, 426, 79
- [] Pettini, M., Lipman, K., Hunstead, R. W., ApJ, 1995, 451, 100
- [] Pettini, M., Bowen, D. V., 1997, A&A, 327, 22
- [] Pettini, M., Smith, L., King, D. L., Hunstead, W., 1997, ApJ, 486, 665
- [] Pettini, M., King, D. L., Smith, L. J., Hunstead, R. W., 1997a, ApJ, 478, 536
- [] Pettini, M., Ellison, S. L., Steidel, C. C., Bowen, D. V., 1999, ApJ, 510, 576
- [] Pettini, M., Ellison, S. L., Steidel, C. C., Shapley, A. E., Bowen, D. V., 2000, ApJ, 532, 65
- [] Pettini, M., Ellison, S. L., Bergeron, J., Petitjean, P., 2002, astro-ph/0205472
- [] Prantzos, N., Boissier, S., 2000, MNRAS, 315, 82
- [] Prochaska, J. X., Wolfe, A. M., 1997, ApJ, 487, 73
- [] Prochaska, J. X., Wolfe, A. M., 1999, ApJS, 121, 369
- [] Prochaska, J. X., Gawiser, E., Wolfe, A. M., 2001a, ApJ,552, 99
- [] Prochaska, J. X., Wolfe, A. M., Tyler, D., Burles, S., Cooke, J., Gawiser, E., Kirkman, D., O’Meara, J. M., Storrie-Lombardi, L., 2001b, ApJS, 137, 21
- [] Prochaska, J. X., Wolfe, A. M., 2002, ApJ, 566, 68
- [] Prochaska, J. X., et al., 2002a, ApJ, 123, 2206
- [] Prochaska, J. X., et al., 2002b, astro-ph/0206296
- [] Rao, S. M., Turnshek, D. A., 2000, ApJ, 130, 1
- [] Rao, S., Briggs, F., 1993, ApJ, 419, 515
- [] Recchi, S., 2002, PhD Thesis, University of Trieste
- [] Renzini, A., Voli, M., 1981, A&A, 94, 175
- [] Rosenberg, J. L., Schneider, S. E., 2002, ApJ, 567, 247
- [] Salpeter, E. E., 1955, ApJ, 121, 161
- [] Scalo, J. M., 1986, FCPh, 11, 1
- [] Steidel, C. C., Adelberger, K. L., Giavalisco, M., Dickinson, M., Pettini, M., 1999, 519, 1
- [] Storrie-Lombardi, L. J., McMahon, R. G., Irwin, M. J., 1996, MNRAS, 283, L79
- [] Storrie-Lombardi, L. J., Wolfe, A., 2000, ApJ, 543, 552.
- [] Thielemann, F. K., Nomoto, K., Hashimoto, M., 1993, in Origin and Evolution of the Elements, ed. N. Prantzos et al. (Cambridge: Cambridge Univ. Press), 297
- [] Thielemann, F. K., Nomoto, K., Hashimoto, M., 1996, ApJ, 460, 408
- [] Timmes, F.X., Woosley, S.E.,Weaver, T.A., 1995, ApJ, 98, 617
- [] Umeda, H., Nomoto, K., 2002, ApJ, 565, 385
- [] Van den Hoeck, L. B. & Groenwegen, M. A. T., 1997, A&AS, 123, 305
- [] Vladilo, G., 1998, ApJ,493, 583
- [] Vladilo, G., 1999, The Evolution of Galaxies on Cosmological Timescales, J. E. Beckman and T. J. Mahoney eds., ASP Conference Series,187,323
- [] Vladilo, G., Bonifacio, P., Centurión, M., Molaro, P., 2000, ApJ, 543, 24
- [] Vladilo, G., Centurión, M., Bonifacio, P., Howk, J. C., 2001, ApJ, 557, 1007
- [] Vladilo, G., 2002a, ApJ, 569, 295
- [] Vladilo, G., 2002b, A&A, 391, 407
- [] Zwaan, M. A., Briggs, F. H., Sprayberry, D., Sorar, E., 1997, ApJ, 490, 173.
- [] Zwaan, M., Briggs, F., Verheijen, M., 2001, in Extragalactic Gas at low redshift, eds. Mulchaet et al. (astro-ph/0108498)
This paper has been typeset from a LaTeX file prepared by the author.