Further author information: (Send correspondence to S.A.R.)
S.A.R.: E-mail: rinehart@rosette.gsfc.nasa.gov, Telephone: 1 301 286 3124, Address: NASA – Goddard Space Flight Center, Mail Code 631, Greenbelt, MD 20771.
Wide-field Imaging Interferometry Testbed II: Implementation, Performance, and Plans
Abstract
The Wide-Field Imaging Interferometry Testbed (WIIT) will provide valuable information for the development of space-based interferometers. This laboratory instrument operates at optical wavelengths and provides the ability to test operational algorithms and techniques for data reduction of interferometric data. Here we present some details of the system design and implementation, discuss the overall performance of the system to date, and present our plans for future development of WIIT. In order to make best use of the interferometric data obtained with this system, it is critical to limit uncertainties within the system and to accurately understand possible sources of error. The WIIT design addresses these criteria through a number of ancillary systems. The use of redundant metrology systems is one of the most important features of WIIT, and provides knowledge of the delay line position to better than 10 nm. A light power detector is used to monitor the brightness of our light sources to ensure that small fluctuations in brightness do not affect overall performance. We have placed temperature sensors on critical components of the instrument, and on the optical table, in order to assess environmental effects on the system. The use of these systems provides us with estimates of the overall system uncertainty, and allows an overall characterization of the results to date. These estimates allow us to proceed forward with WIIT, adding rotation stages for 2-D interferometry. In addition, they suggest possible avenues for system improvement. The possibility exists to place WIIT inside an environmentally controlled chamber within the Diffraction Grating Evaluation Facility (DGEF) at Goddard in order to provide maximum control over environmental conditions. Funding for WIIT is provided by NASA Headquarters through the ROSS/SARA Program and by the Goddard Space Flight Center through the IR&D Program.
keywords:
Interferometry, Michelson Interferometer, Wide-Field Imaging, Synthesis Imaging, Testbed1 INTRODUCTION
The Wide-Field Imaging Interferometry Testbed (WIIT) is a lab-based instrument for testing the concepts considered for interferometers in space. It will be used to test algorithms and data acquisition schemes which will be used with future interferometry missions and will provide information which will impact the design and operation of these future missions. The overview and aims of WIIT are discussed further in an accompanying paper1 and in references therein.
In this paper, we focus on some of the details of the design and operation of WIIT. In Section 2, we talk about some of the aspects of the design and configuration of the system. In Section 3, a number of tests used to test the ability and limits of the system are discussed. Finally, in Section 4, we mention approaches to improving the system and expanding its capabilities.
2 DESIGN
The overall design of WIIT has been challenging because of the stringent requirements of interferometry. These requirements have impacted the mechanical design of the system and the need for accurate metrology. In addition, they constrain our optical design and the electronics implementation (both in terms of hardware and software). An overview of the design is provided in Leisawitz, et al. (2002)1. Here we concentrate on some of the details of the design and implementation. In particular, we focus on electronic and software implementation and the overall operation of the system. Details of the mechanical design, system metrology, and optical design are included in an accompanying paper2.
2.1 Electronic Design and Software
 |
 |
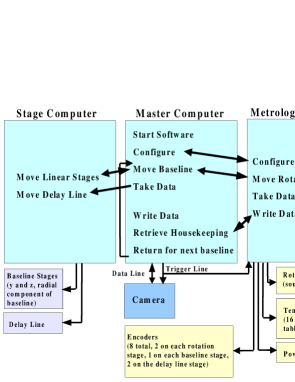
The electronics of WIIT are, in general, relatively uncomplicated. There are three computers used in the system; the Master computer, the Metrology computer, and the Stage computer. The Metrology computer controls the two rotation stages, housekeeping systems, and reads the encoders used to monitor position of the stages2. The Stage computer controls the motion of the three linear stages (two baseline stages and the delay line stage) via software provided by Aerotech. The Master computer coordinates the actions of the three computers and is used for acquisition of images from the camera. A block diagram of this can be seen in Figure 1.
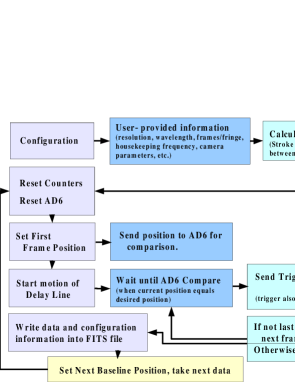
The three computers used in the WIIT system interact in several ways to simplify the process of data acquisition and system operation. The Master PC runs a program written in LabView to coordinate the computers and provide data acquisition. Figure 2 provides a pseudo-code diagram of how this process works. In words, the program queries the user for parameters of the run, including such information as central wavelength, desired spectral resolution, and number of frames per fringe. Based upon this information, the program calculates the total stroke length necessary and the delay line distance between successive frames. The AD6 is then reset, so that we can accurately measure relative position. This also ensures that the AD6 is in the proper mode to conform with the expectations of the software.
During this initialization process, the LabView prgram also coordinates with the Metrology PC to begin monitoring of environmental parameters. The LabView program creates a configuration file (based upon user-accessable parameters). The metrology software resident on the Metrology PC reads this file and configures the housekeeping systems (encoders, temperature sensors, power monitoring) accordingly. The metrology program then enters a data acquisition standby mode, and sends a handshake signal back to the Master PC to indicate that it is prepared.
Data acquisition commences on Master PC at this point. Based upon the parameters calculated during initialization, the position value for the first data frame is set into a buffer of the AD6. The Master PC then sends a signal to the Stage PC to start the motion of the delay line stage. When the position value in the AD6 equals that of the value in the buffer, it sends a signal (COMPARE) to the LabView program. The LabView program sends a trigger signal to the camera and records the data from the frame. The electronic trigger generated by this procedure is split out to both the camera and to the Metrology PC. This trigger signals the Metrology PC to take housekeeping data. This provides the distinct advantage of simultaneity of data streams, and avoids the problem of interpolation of two related, but differently time-sampled, data sets. The program then sets the position value for the next frame, and loops repeating this procedure for each value of delay line position calculated.
When the last frame has been taken (i.e. when is the same as calculated during initialization), the data is written as a FITS file. Simultaneously, a signal is sent to the Metrology PC that data acquisition is complete. The Metrology PC stops housekeeping data acquisition, and writes out seperate files for the power monitoring, temperature data, and encoder readings. When these files have been written, the Metrology PC handshakes with the Master PC and the Master PC retrieves these files. Post-run, these data care incorporated into a single FITS table for simplicity and ease of use.
2.2 Operation and Data Acquisition
As described above, the software/electronic design of WIIT makes operation and data acquisition very straightforward for the user, with an intuitive GUI for the user. However, there are certain other aspects of the system that must be addressed when taking data and some features which merit mention.
While our system is very stable over long timescales, it is still deemed important to verify that the system is properly aligned and operating as expected prior to taking interferometric data111Because the system has been undergoing a number of improvements over time, and installation of new elements can cause small alignment shifts, this has been especially necessary to date. With completion of the system, this should become less necessary.. When preparing to take data, we confirm that the two arms of the interferometer are aligned by alternately blocking the individual arms and observing the position of a point source on the camera array. If the two spots are not aligned, they can be quickly and easily brought into alignment by adjusting micrometer control of the beam combiner. Next, we confirm that the brightness level of the source is suitable. Because we operate with a white light source using several different bandpass filters and a laser, light levels can vary significantly. We therefore choose an appropriate neutral density filter and adjust camera parameters (integration time, gain) to achieve maximum signal without saturating the detector. At the same time, we adjust the camera settings to only display and record a subset of the CCD array choosing only to record data for the field-of-view of interest. For example, when observing a point source, we typically use an 8x8 subarray of the camera, choosing the subarray so that the point source is centered in the frame. This provides access to all of the relevant data while keeping the size of data files written to a minimum.
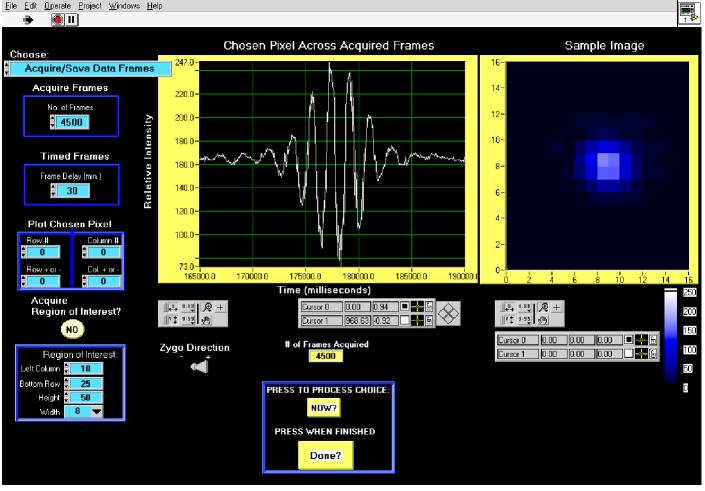 |
When taking data, the GUI provides several forms of useful feedback (see Figure 3). For system debugging purposes, it provides a running frame count, which has been valuable for understanding our triggered acquisition mode and limitations thereof. In addition, at the end of each run, the GUI displays the image of the last frame and a plot of the brightest pixel versus frame number. The latter can be manipulated to show different pixel values, or to show average pixel values inside a rectangular box. This is very useful for individual data runs (single baseline measurements) and especially for checking system health, as it allows us to quickly estimate the location of ZPD, fringe contrast, and the overall quality of the data. There are also quick look features built into the software which runs on the Metrology PC controlling the temperature sensors, power monitor, and encoders. This is discussed further in a companion paper2.
After data acquisition, the data is written onto a hot-swappable hard drive on the Master PC. For small data files, the data can be transferred via ftp or scp commands (or even by email). For wide-field of view data, however, a single scan at one baseline, using a 100100 subarray of the detector, produces several hundred Mb of data, depending upon the resolution desired. Multiply this by the number of baselines used, and the volume of data becomes enormous (see Leisawitz, et al.1), making these simple data transfer methods unacceptable. Therefore, we have multiple hot-swappable hard drives; one in the WIIT lab, one on the analysis computer at Goddard, and one on an analysis/development computer at the University of Maryland. When we produce large sets of data, the hard drive is physically transported to the computer where it will be reduced and switched the the drive there. This maximizes fidelity of the data when copied onto other computers, reduces concerns about bandwidth issues between different sites, and provides us a method for making system and software backups with triple redundancy.
3 TESTING AND SYSTEM BEHAVIOR
3.1 System Focus
 |
One of the major requirements on the setup of WIIT is very accurate system alignment and focus. It is critical, in order to maintain fringe quality, that the collimated beam entering the receiver mirrors is parallel, and that all of the optical components of the interferometer itself are well-aligned. The alignment of the system, and the basic procedures used to focus the system are discussed in a companion paper2, but here we discuss the final focussing procedure.
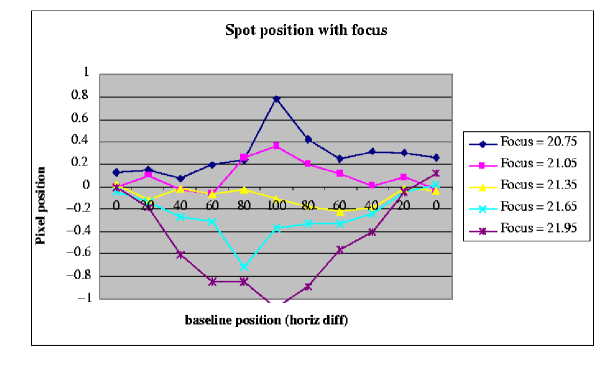
If we were dealing with a single aperture, lack of focus could be observed directly through an out-of-focus spot on the detector produced by the divergent/convergent rays. In the case of an interferometer, the individual receiver mirrors are much smaller and cannot resolve focus issues in this way except for very large deviations. However, the divergence of the rays does manifest in an easily measurable way; if the system is not in focus, then movement of the baseline mirrors results in a measurable change in the position of an imaged point source. This is obviously problematic for an interferometer, as when the two arms of the interferometer move to different baselines, the images that each of the two arms produce shift by similar amounts in opposite directions. Obviously, it would be difficult to produce interferograms if the two images do not coincide to relatively high accuracy. In Figure 4, we show the differential position of the spots produced by each arm as a function of baseline position (where 0 is the shortest baseline and 100 is the longest baseline). We can see that for even small changes in focus position, the two spots begin to seperate at different baselines (and that they seperate in opposite ways on either side of focus, as one would expect). Further, we find that at our best position, the two spots remain coaligned to within 0.2 pixels (peak to peak). This method has allowed us to achieve optimal focus for the system to within about 0.15 mm, where this number is limited by the uncertainty of repeatability for individual pixel positions (we have found that the individual pixel positions have 1 uncertainties of 0.1 pixels) and by the straightness of the rail upon which the baseline stages travel.
3.2 Servo Jitter
 |
After we first acquired fringes with WIIT, we observed that the fringe quality was lower than expected. We found that one of the significant causes of this is the behavior of the delay line stage. There are two issues regarding the delay line stage which were cause for concern; first, there is servo position error in the stage, which leads to periodic velocity fluctuations while the stage is in motion. This in turn causes non-uniform spacing of data points when running an open-loop acquisition. Second, there is stage jitter caused by the servos. This was explored by using a distance measuring interferometer (Zygo) to measure the position of the delay line stage while the stage was stationary, but with the servos in operation. In Figure 5, we show the plots of delay line position as a function of time, first with the servos on then with them off. Environmental effects are clearly present in both plots, but the high frequency noise is unique to the data taken with servos operating. This high-frequency noise has a 1 value of nm. Fortunately, we had anticipated the latter as a possible problem, and therefore had planned to use a Zygo interferometer to mitigate it by closing the data loop. The Zygo measures the position of the delay line directly, and sends a quadrature signal to a converter (an AD6 purchased from U.S. Digital) attached to the parallel port of the Master PC. The AD6 then tracks the position of the delay line stage and produces “COMPARE” pulses when the value reaches the position set by the Master PC. It is this pulse which is used to trigger camera acquisition and housekeeping operation. This reduces the problems of non-uniform velocity of the stage and stage jitter from the data, by linking each frame directly to an exact position of the delay line stage. However, while eliminating this problem has significantly improved the data produced by WIIT, the data of Figure 5 suggest another issue.
3.3 Turbulence Testing
After implementing the closed-loop data acquisition, we found that there were still some noise issues which were unaccounted for. The postulate was that we were witnessing noise due to environmental effects such as temperature changes in the room and air turbulence.
 |
Using the Zygo interferometer, we directly examined the effects of turbulence on our system. We used the Zygo in conjunction with flat mirrors mounted directly to the optical table to measure variations in the “length” of the path. We found that the “length” of the path deviated significantly over time, as expected. This is shown clearly in Figure 6. In this figure, we used a relatively short path length (20 cm) in order to observe the effects of the environment. We found that the noise was not significant at frequencies above about 1 Hz, but that at lower frequencies, the noise was significant. This result was also borne out at longer path lengths (up to 200 cm), which also showed that the noise due to environmental effects is close to linearly correlated with path length. We also found that the system was acoustically sensitive and was vulnerable to motion near the apparatus. The table was therefore enclosed in a “tent” comprised of black plastic of an aluminum frame and the test sequence was repeated.
 |
We found that the tent significantly reduced noise at all frequencies. Comparision of the plots shown in Figure 6 show clearly the significance of this reduction. However, we still see evidence for variation in the measured distance. To further explore this behavior, we ran the turbulence test overnight, while taking temperature data with the sensors located on the optical table. We found (see Figure 7) that long-term variations in position correlated well with room air temperature. This is not unexpected, as temperature changes of air cause small variations in the index of refraction of air, which directly impacts the length of the path as measured by the Zygo interferometer. By directly measuring this correlation, we can use temperature monitoring data to correct for variations in the measured position of the delay line stage due to thermal effects. Note that the shift in position is about three times larger than expected for the measured temperature shift (in dry air), but that this is accounted for by thermal expansion/contraction of the table and by the effects of water vapor in the air. Figure 7, however, illustrates another problem. If turbulence and thermal effects have an impact on the laser of our Zygo metrology system for these short path lengths, they also could cause relative phase shifts between the two arms of the interferometer. To further improve, we are undertaking two system improvements. First, we will install another level of environmental baffling, by enclosing the interferometer in a hard box. Second, we have ordered a two-channel digital Zygo interferometer. This will be used to measure the path length of the two arms of the interferometer seperately, so that we can trigger camera frames based upon the relative path length difference of the two arms. When this system is implemented, we will have substantially reduced environmental effects on the system. The tent also has the side benefit of reducing stray light within the system. Without the tent and with roomlights on we found a small additional noise contribution (2%). With room lights off, this contribution becomes very small, but obviously impairs other work within the lab. The addition of the tent allows light isolation for WIIT while still allowing full use of the rest of the lab.
In Figure 8, we can see how the two improvements to date, the addition of closed-loop operation and the tent for environmental shielding, have improved operation. The improvement between open-loop and closed-loop data is very clear upon examination of this figure. The improvement due to the environmental shielding is less clear, although there is certainly some evidence that the data is less noisy. The primary advantage of the environmental shielding, however, is at very low frequencies, which will have the most significant impact on longer data acquisition runs. Since these fringes were taken over a short period of time (a few minutes), the effects of the lowest frequency variations cannot be seen. The two improvements discussed here should significantly reduce noise in the data.
 |
3.4 System Stability
One of the major concerns for WIIT is the long-term stability of the system. Is the point of zero path difference (ZPD) vulnerable to wander over time? How often does the system need to be checked to verify that the two arms are aligned and that everything is functioning properly? Since, in its final incarnation, WIIT will operate entirely under software control for several days at a time, ensuring that the entire system is stable over this time period is critical. To answer these questions, we have developed a series of “system health tests” which are used to monitor the long-term behavior of the system. These tests are enumerated in the Table 1.
| Test | Purpose | |
|---|---|---|
| 1 | Dark Frames | Dark Current and Read Noise |
| 2 | Flat Fields | Uniformity of response, calibration |
| 3 | Spot position with baseline | Quality of Focus |
| 4 | Power monitor with baseline | Uniformity of Illumination |
| 5 | White Light Stability (arm blocked) | Image quality and stability |
| 6 | Laser Stability | Image quality and stability |
| 7 | White Light Fringes | ZPD Position, Fringe Quality |
| 8 | Laser Fringes | Fringe Quality |
We have found, from application of this set of procedures over the past six months, that the system does not appear to have any long-term stability issues. Because of the ongoing work on the system and installation of new components, we have been unable to accurately quantify the stability of individual elements, but as the final components of the system are installed we will be able to precisely determine our vulnerability to system drift.
3.5 Camera Characterization
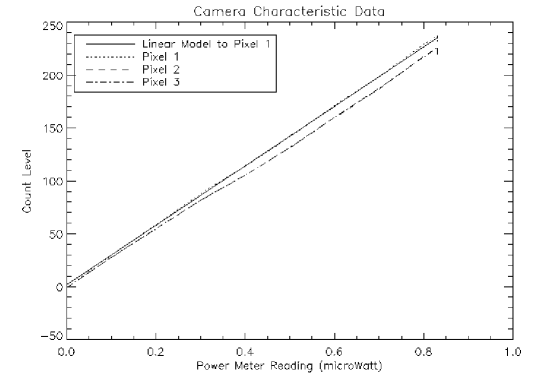
In the process of testing and characterizing the system, we have attempted to understand the behavior of all of the subsystems to the greatest accuracy possible. As an example of this effort, we include here information on the characterization of the camera. In specific, the major topics of interest here are the linearity of response, dark current and read noise, and uniformity of response across the array. The dark current and read noise were tested by taking a number of dark frames using different gains and integration times. We found that the dark current plus read noise occupied at most 3% of the dynamic range for all integration times of interest. The uniformity of response was measured using a series of flat field exposures. From these, we found that the individual pixel response was uniform to better than 1% where the major component of the nonuniformity here was due to “striping” on the detector due to slight offsets in black level and gain for the two readout chanelns of the camera. In order to measure the linearity of response, we used a white light source at the focus of the collimator with a secondary power monitor. The power monitor provides an accurate relative measure of light on the detector. By changing the amount of light, we are able to measure the response with increasing source brightness. A figure of the response is shown in Figure 9. We find that the camera response is linear for nearly the whole range. Only at the highest end of the detector range is there deviation from linearity, and it was found that this deviation was of order 1%, within the last 10% of the camera’s dynamic range. Further, we found that this behavior appeared to be consistent for different pixels to very high accuracy. We conclude that for the majority of our observations, the camera can be assumed to be completely linear. For observations where the full dynamic range of the camera is required, it may be necessary to correct for the non-linearity in software, but given the uniformity of the deviations across the array, this should be simple to implement.
 |
4 THE FUTURE OF WIIT: WIIT2
WIIT is a valuable instrument which will be used to help prepare for astronomical wide-field interferometry. To continue improving the system, several upgrades will be undertaken in the near future. First, we will encase the interferometer inside rigid box, to provide additional isolation from air turbulence and temperature variations within the room. Second, we will be installing a new Zygo interferometer system with two seperate interferometer heads. These two measurement beams will be injected into the two arms of WIIT, so that we are able to directly measure the optical path length of both arms individually. We will then be able to trigger not on the position of the delay line stage, as done now, but on the actual difference in distance for the two arms. This will greatly improve the system and provide another reduction in the effects from air turbulence and temperature variations. As a side note, it will also be possible to use this to estimate the scale size of turbulence cells around the apparatus and estimate overall sensitivity to air movement around WIIT. Third, we will improve the communications between the individual computers. This will improve the operability of the system and will lead to the complete automation of data acquisition. Finally, we will continue to characterize the system and understand the limitations and abilities of individual components, including both the 1-D components and the rotation stages for 2-D interferometry.
In addition to the work on WIIT itself, we will be using data from WIIT to improve our understanding of algorithms and procedures for dealing with interferometric data. This will help us optimize data acquisition for the system, and will be of direct bearing on the methods used for future interferometry missions.