Abstract
We present X-ray and optical observations of the z0.52 galaxy cluster RBS380. This is the most distant cluster in the ROSAT Bright Source catalog. The cluster was observed with the CHANDRA satellite in September 2000. The optical observations were carried out with the NTT-SUSI2 camara in filters V and R in August and September 2001. The preliminary conclusions are that we see a very rich optical galaxy cluster but with a relative low X-ray luminosity. We also compare our results to other clusters with similar properties.
[]The Galaxy Cluster RBS380:
X-ray and optical analysis
RBS380 Galaxy Cluster
1 Introduction
The galaxy cluster RBS380 was observed with NTT-SUSI2 as part of a programme to search for gravitational arcs in X-ray bright clusters of galaxies. We selected the most X-ray luminous clusters from the ROSAT Bright Survey (Schwope et al. 2000), which have a predicted probabilty for arcs of 60%. RBS380 is the most distant cluster of this sample and is therefore the first one that we analyse. In a parallel programme several of these clusters are observed in X-rays with CHANDRA. The aims of the project are threefold. One aim is to compare mass determinations by the gravitational lensing method and the X-ray method. A second aim is to perform arc statistics to constrain cosmological models. A third aim is to study in detail the distant background galaxies that are magnified by the gravitational lensing effect.
2 Observations and Data Reduction
2.1 Optical Data
The galaxy cluster RBS380 was observed with the New Technology Telescope (NTT)
in service mode during the Summer 2001. The Superb Seeing Imager-2 (SUSI2)
camera was used in bands V and R. The SUSI2 detector is a 2 CCDs array,
each with 10241024 pixels, subtending an area on the sky
of .
The data reduction was performed with the IRAF package. A total number of 6
images with very good seeing conditions () were used in the analysis, with an
exposure time of 760 sec each.
After bias subtracting, the flatfielding cannot be done in a
standard way. A hyper-flat (Hainaut et al. 1998) was built using both the
twilights flats set and the night-sky (scientific) images set. The twilights
correct very well the high spatial frecuencies in the field, whereas from the
scientific images one obtains the low spatial frecuencies correction. We found
that a simple linear combination of the two final flats (one from the twilight
flats and the other from the scientific images) was enough for producing a high
quality final one. Of course, the procedure has to be done for each filter.
Once the images were flatfielded, they were co-added, obtaining a deep image of
the field and free of gaps between the chips (this was possible due to the
dithering between the exposures).
2.2 X-ray Data
The RBS380 cluster was observed in October 17, 2000 by the CHANDRA X-ray
Observatory (CXO). A single exposure of 10.3 ksec ( 3 hrs) was taken with the Advance CCD
Imaging Spectrometer (ACIS). Only the 22 arrays ACIS-I chipset was active. Each
CCD is a 10241024 pixels array. The pixel resolution is , covering a
total area on the sky of .
The data were processed with the CIAO suite toolkit provided by the CXC. We
upgraded the gainmaps, checked the correction for the aspects offsets and
removed bad pixels from the field (using the files provided by the CXC). Then we
built the lightcurve for the observing period, looking for short high
backgrounds intervals, but finding none.
Since we are interested in diffuse emission, the first step is removing the
point sources present. We used the wavdetect subroutine to detect them.
We applied it to a broadband (0.3-10 keV) image. We found 29 sources, expecting
none to be spurious. After removing the sources, we filled the holes using the
same counts distribution of background pixels for that region.
The correction for telescope vignetting and variations in the spatial efficiency
of the CCDs was done by means of an exposure map. The exposure map was generated
for a integrated energy distribution peak of 0.7 keV. Background correction was
also applied by using the sets provided by the CXC.
3 Results
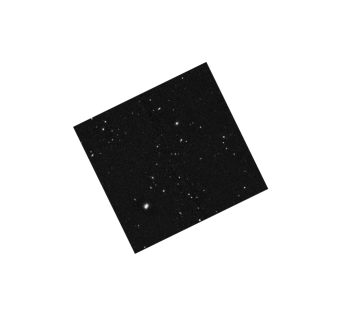
The preliminary results show optical R and V images with a high number density of
galaxies. The right side of Fig. 1 shows the final R band
image. So far
no gravitational arcs have been detected. On the left side of Fig. 1
we present the results in X-ray. We selected a circular region of radius
centred at the peak of the emission. We obtain a count rate of 0.05 counts/s in the
encircled region, where most of the cluster emission is supposed to be. The derived
X-ray luminosity is erg/s. This is a relatively low X-ray luminosity
for a massive cluster of galaxies.
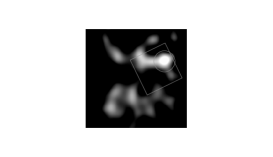
Furthermore, the structure found in the X-ray emission is not perfectly symmetrical, but presents extended emission to both sides of the main region. This could mean that the cluster is not relaxed, but rather interacting with surrounding material or another close cluster. This is point that merits more attention indeed.
4 Conclusions
A clear correlation between optical richness and X-ray luminosity is not yet well
established. Although it is in general assumed that a high number density of galaxies
should imply a great amount of intergalactic hot gas, there are few cases in the
literature that show little correlation between these two facts. In particular,
Cl050024 and Cl0394713 are two interesting cases (Schindler &
Wambsganss 1996, 1997; Schindler et al. 1998). In Table 1 we show the X-ray luminosities of the
three clusters.
| Name | Redshift | Luminosity [erg/s] | band |
|---|---|---|---|
| Cl050024 | 0.32 | 5.6 1044 | bolometric |
| Cl09394713 | 0.41 | 7.9 1044 | bolometric |
| RBS380 | 0.52 | 1.06 1044 | [0.3-10] keV |
Since we are presenting preliminary results, we have not fully analysed the optical images of RBS380. In a forthcoming paper we will build a catalogue of objects in the field. With such a catalogue we will be able to establish what are the galaxies that belong to the cluster and get a precise number density map.
Acknowledgements.
This work has been partly supported by a predoctoral Marie Curie Fellowship to RGM at the Liverpool John Moores Astrophysics Institute (HPMT-CT-2000-00136). We specially thank Betty De Filippis and Africa Castillo for many useful discussions and time-sharing. We also thank Olivier Hainaut for detailed explanations on hyper-flatfielding.References
- [] Hainaut O.R., Meech K.J. Boehnhardt H., West R.M., 1998, A&A, 333, 746
- [] Schindler S., Wambsganss J., 1996, A&A, 313, 113
- [] Schindler S., Wambsganss J., 1997, A&A, 322, 66
- [] Schindler, S., Belloni, P., Ikebe, Y., Hattori, M., Wambsganss, J., Tanaka, Y., 1998, A&A, 338, 843
- [] Schwope A., Hasinger, G., Lehmann, I, et al. 2000, AN 321, 1