Spectro-Polarimetric search for hidden AGNs in four southern Ultraluminous Infrared Galaxies
Abstract
We report on a spectro-polarimetric analysis of four southern Ultra-Luminous Infrared Galaxies (ULIRGs), aimed at constraining the presence of hidden broad AGN lines. For IRAS 19254–7245 (The Superantennae) we find evidence for a significant level of polarized light in the H line with FWHM2300 km/s. Some degree of polarization is also detected in IRAS 20551-4250, though with lower significance. In the two other sources (IRAS 20100–4156 and IRAS 22491–1808) no polarized signals are detected. Although it is unclear from the present data if the origin of polarization is due to reflected light from an AGN or more simply to dichroic transmission by a dust slab, we find interesting correlation between the presence of polarized components in the optical spectra and independent evidence for AGN emissions in hard X-rays and the far-IR.
keywords:
galaxies: individual: IRAS 19254-7245 galaxies: individual: The Superantennae galaxies: individual: IRAS 20100-4156 galaxies: individual: IRAS 20551-4250 galaxies: individual: IRAS 22491-18081 Introduction
With bolometric luminosities exceeding , Ultra-Luminous Infrared Galaxies (ULIRGs) are the brightest sources in the local universe. Whether they are powered by a hidden quasar, a circum-nuclear starburst, or a combination of both, has been subject of a lively debate since their discovery. Although observational hints on the nature of these galaxies have been increasing in the last decade, their physical understanding is still subject to uncertainties. If mid–infrared ISO spectroscopy highlights clear cases of starburst–dominated activity (Genzel et al. 1998), hard X–ray observations otherwise suggest that the presence of an obscured AGN may be more frequent and significant than predicted on the basis of the IR data alone. Analyses of multi–wavelength (X–ray, optical and IR) observations currently suggest that both AGN and starburst activity happen concomitantly in ULIRGs (Genzel et al. 1998, Veilleux et al. 1999, Braito et al. 2002, Berta et al. 2002).
In the presence of a central engine enshrouded in a dusty torus, an appreciable non–thermal polarized radiation may be detected, produced by either electron or dust scattering. The use of polarimetry for study hidden broad line regions in Seyfert 2 galaxies has been pionereed by Miller & Antonucci (1983). Polarisation produced by scattering or absorptive dichroism may be also detected in the continuum of starburst galaxies spectra, and so the polarisation itself is not a straight indicator of an abscured AGN. The technique of searching for polarised light in IRAS galaxies has been well exploited recently by some authors (see for example Tran et al., 1999; Young et al., 1996). Up till now the only galaxies which show polarised broad H all have seyfert or LINER classifications based on their optical spectra.
Genzel et al. (1998) studied the mid–IR spectral properties of a sample of 15 ULIRGs from a complete IRAS sample with Jy. The far–IR selection allows to avoid selection biases due to dust absorption, making easier the analysis of the relationship between AGN and starburst activity.
To add further constraints on the physical processes happening within these sources, we have performed a spectro-polarimetric survey of four of the Genzel et al. IRAS sample in the southern sky. We report here the results of the polarimetric observations, while the full-light spectra are presented and discussed by Berta et al (2002) and Fritz et al. (2002). A review of the optical and IR properties of these sources can be found in Duc et al. (1997). Section 2 reports on the observations and data analysis. Section 3 presents details about our results, and Section 4 contains a short discussion.
| Object | Obs. Date (start) | Exp. Time (s) | Slit apert.(”) |
|---|---|---|---|
| IRAS 19254–7245 | Nov. 1, 2000 | 8 750 | 4 |
| IRAS 20100–4156 | Oct. 29, 2000 | 8 1200 | 3.2 |
| IRAS 20551–4250 | Oct. 30, 2000 | 8 1000 | 5.6 |
| IRAS 22491–1808 | Oct. 31, 2000 | 8 900 | 8 |


2 Observations and data reduction
The spectro-polarimetric data have been collected with EFOSC2 at the 3.6m ESO telescope in La Silla. Observations have been carried out during the nights of October 29th to November 1st, 2000. Observing logs are summarized in Table 1. Sky was not photometric, with a seeing between 0.9 and 1.2 arcsec during the run. We adopted the 236 line/mm grism, with an effective dispersion of 2.77 Å/pixel at the central wavelength, operating between 3690 and 9320 Å, and a 1.220 arcsec slit. This slit width corresponds to a spectral resolution of 21.2 Å FWHM, or 970 Km/s in the source frame. Position angles for the slit were chosen in order to encompass the most interesting morphological features. In the case of galaxies with double-nuclei (i.e. IRAS 19254-7245 and IRAS 20100-4156), the slit has been positioned along the line joining the two nuclei.
Polarimetric observations were obtained with the combination of a retarder plate and a Wollastone prism. Each object was observed with four different retarder angles (0∘, 22.5∘, 45∘ and 67.5∘), corresponding to different polarization angles of the transmitted radiation. In order to check for and eventually remove instrumental polarization, spectra of unpolarized standard stars and light transmitted through a pinhole with a polaroid filter were obtained.
Data reduction of the 2D spectra was performed using the standard IRAF tasks (for details see Berta et al. 2002). Spectra were flux-calibrated by means of the spectrophotometric standard star in NGC7293 (Oke 1990) and then corrected for atmospheric extinction as well as for Galactic reddening. The polarimetric reduction of the 1D extracted spectra was performed using software written by J.R. Walsh under the MIDAS environment and IDL procedures developed by us. Particular care has been taken in order to avoid the problem concerning the biased threshold always present in polarimetric measures. Debiasing has be done following the relation where is the observed degree of polarization, is the bias corrected one and is the r.m.s. error on the polarization (Di Serego Alighieri, 1997).
3 Results
The spectra of the four observed galaxies are shown in Figures 1 and 2. Each spectrum is obtained by identifying the trace of the main nucleus. On the left panels, from top to bottom, the unpolarized and polarized spectrum, the polarization degree and direction angle are shown in the order, throughout the observed wavelength range. The panels on the right show expansions around H. The plots relative to the polarization (flux, percentage and position angle) are spectrally binned in order to have an error bar on the polarization degree of 0.5 % (the error bars shown in the polarization degree spectra). The original spectra are not rebinned. Error bars are shown also in the plots of polarization angle.
When detected (as in the case of IRAS 19254-7245 and IRAS 20551-4250), the polarized lines appear to contain some structure, which however is only due to the poor signal to noise ratio (we have checked in particular that these apparent blends do not correspond to the redshifted H and [Nii]6584 lines). Table 2 summarizes our data on the polarization degree, H line fluxes and observed line widths.
3.1 Note on individual sources
IRAS 19254–7245. the Superantennae (Colina et al., 1991), has been classified as a Seyfert 2 galaxy by Mirabel et al. (1991) on the basis of optical spectral properties. In their polarimetric analysis, Heisler et al. (1997) and Lumsden et al. (2001) fail in detecting scattered light and attribute the lack of polarized components to geometric effects: if the scattering particles lie close to the plane of the obscuring torus, an edge–on observer wouldn’t be able to observe any polarized flux. In particular Lumsden et al. (2001) found only polarised narrow emission line, and this may be explained if one consider that we were looking at a slightly different location (Lumsden, 2002). Moreover our total flux spectrum is essentially identical to theirs (Lumsden, 2002).


The analysis of our EFOSC2 integration on the Southern Nucleus leads to a detection of a significant polarized residual, in particular in the spectral region around H (see Figure 1, top left panel). The polarization degree turns out to be .
The width of this spectral structure in polarized light, which might be interpreted as the H+[Nii] blend although we do not have the spectral resolution to resolve it, is 70 Å, or 3500240 km/s. This line width is only marginally wider than that of the H+[Nii] blend measured in the total-light spectrum by Berta et al. (2002, 2500 km/s).
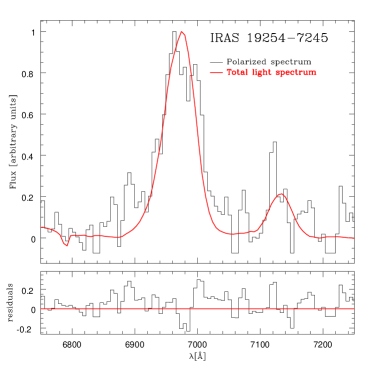
Figure 3 shows the comparison of the polarized to the total–light H as well as the difference between the two. There is no clear positive residual, but the very low S/N doesn’t allow to be conclusive about the presence of a scattered component. In this figure (as in the following figure 4) we do not have rebinned the polarized flux spectra in order to keep the full spectral resolution around the Hα line.
We have attempted also to fit this polarized feature by taking into account some information on the complex kinematic structure of the source as reported by previously published higher-resolution work. Following Colina et al. (1991), Vanzi et al. (2002) infer that each emission lines are in fact composed of three different kinematical components. They reproduce the observed optical emission lines with a synthetic profile with three different gaussians. Similarly, we have fit our polarized emission structure with three different kinematic components for the triplet [Nii]6548, H and [Nii]6584 (hereafter “model A”). The gaussian parameters (recession velocity , Åand percentage of flux) of Vanzi et al. (2002) were adopted. When taking into account our lower spectral resolution Å, the observed width of the polarized structure is not reproduced in this way.
Instead, we have found a best-fit by adding some intrinsic line-spread, i.e. =23.3, 5.8, 4.3 Å for the three components at =0.06149, 0.05858, and 0.06414 (see Figure 4, “model B”, Vanzi et al., 2002). Note that the sigma value of the two latter component are lower than our instrumental spectral resolution. In conclusion, our analysis indicate a kinematic component with an intrinsic width of FWHM of 55 Å, or 2360 km/s in the velocity space.
Given the complex kinematic structure of the source and our modest spectral resolution and low signal-to-noise, we cannot be conclusive about the presence an a broad-line AGN based on these data, particularly considering that the full-light spectrum displays a similarly broad spectral complex. Dychroic transmission of the H+[NII] complex through a dust screen may still be consistent with the present data.
IRAS 20100–4156. Lying at , this object is extremely bright (, adopting , , H0=65 km/s/Mpc). The top left panel of Figure 2 shows the spectrum of the southern nucleus: only an upper limit of erg cm-2 s-1 to the polarized H flux can be set. The northern nucleus, of comparable luminosity, does not show any polarization either.
IRAS 20551–4250. A detailed description of the optical properties of ESO 286-IG19 is given by Johansson (1991). We find very faint polarized flux in correspondance of the H line at level, with low significance and with a complex structure. The polarized feature is not spectrally resolved (see Table 2). Very similar results on this object has been obtained by Lumsden and his collaborators (2002).
IRAS 22491–1808. The South America galaxy (Carico, 1990) was observed in polarized light by Young et al. (1996) in the R band, but no polarization was detected. We confirm the lack of polarization () and set an upper limit of erg cm-2 s-1 to the H scattered flux.
| (IRAS) | degree | H flux | H FWHM |
|---|---|---|---|
| 19254 | 1.8 | 2.5 10-16 | 23603500 240 |
| 20100 | – | 2 10-17 | – |
| 20551 | 4.1 10-16 | 1000 | |
| 22491 | – | 5 10-17 | – |
4 Discussion and conclusions
We have found very faint but significant polarization signals in two out of four of the Ultra-Luminous IR Galaxies observed in our spectro-polarimetric survey: these are the IRAS 19254-7245 (Superantennae) and IRAS 20551-4250. In the former, the polarized line may be broadened by 2000–3000 km/s. The present observations tend to confirm that ULIRGs display, except in few cases (see, for example, Young et al. 1996, Tran et al. 1999, Hines et al. 1999), faint signals in optical polarized light. These results are consistent with either very weak AGN components in the source nuclei (otherwise dominated by starburst emission), or with a dust distribution covering the nuclear source and producing dichroic transmission. The signal-to-noise ratio of the data does not allow to distinguish between the possible polarization mechanism (e.g. electron scattering, dust scattering or dichroism). In the case of IRAS 19254-7245 a slightly trend of polarization degree with wavelength seems to be present (see Figure 1 left panel, third row) and this should exclude the presence of electron scattering (that is wavelength independent).
It is interesting to compare the present results with those based on independent data. All four of our sources have been observed with XMM-Newton by Braito et al. (2002). Their analysis is revealing clear evidence for AGN activity in IRAS 19254 and 20551. In both sources, strong iron K lines and large hydrogen column densities, indicative of hidden AGNs, are detected. With regard to the other two sources, the presence of non–thermal activity cannot be ruled out but is strongly constrained by the XMM data.
The optical-IR-millimetric spectral energy distributions of these same sources have also been analysed by Berta et al. (2002) and Fritz et al. (2002) adopting combined stellar, starburst and AGN templates. AGN contributions to the bolometric emissions of 40% and 18% are indicated for IRAS 19254 and IRAS 20551, and of the order of few % for the other two. We notice interesting agreement between the results of the present polarimetric analysis and those based on entirely independent approaches.
Acknowledgments
We wish to thank the technical staff of ESO 3.6m telescope at La Silla, and particularly M. Sterzik and R. Athreya, for their efficient support. We thanks also S.L. Lumsden for useful comments on our paper and for kindly furnish us his data on IRAS 19254-7245 and IRAS 20551-4250.
References
- [1] Berta S. et al., 2002, in preparation
- [2] Braito V. et al., 2002, astro–ph/0202352
- [3] Carico D.P., 1990, ApJ, 349, L39
- [4] Colina L., Lipari S., Macchetto F., 1991, ApJ, 379, 113
- [5] Di Serego Alighieri S., 1997, in VII Canary Islands Winter School of Astrophysics, Cambridge University Press, 287
- [6] Duc P.A., Mirabel I.F., Maza J., 1997, A&ASS, 124, 533
- [7] Fritz J. et al., 2002, in preparation
- [8] Genzel R. et al., 1998, ApJ, 498, 579
- [9] Johansson, L., 1991, A&A, 241, 389
- [10] Heisler C.A., Lumsden S., Bailey J., 1997, Nature, 385, 700
- [11] Hines D.C. et al. 1999, ApJ, 512, 145
- [12] Lumsden S.L. et al., 2001, MNRAS, 327 (2), 459
- [13] Lumsden S.L., 2002, private communications
- [14] Miller J.S., Antonucci R.R., 1983, ApJL, 271, L7
- [15] Mirabel I.F., Lutz D., Maza J., 1991, A&A, 243, 367
- [16] Oke J.B., 1990, AJ, 99, 1621
- [17] Tran H.D. et al., 1999, ApJ, 516, 85
- [18] Vanzi L. et al., 2002, astro–ph/0202435
- [19] Veilleux S., Sanders D.B., Kim, D.C., 1999, ApJ, 522, 139
- [20] Young S. et al., 1996, MNRAS, 281, 1206