XMM-Newton confirmation of Soft X-ray excess emission in clusters of galaxies – the discovery of O VII emission from an extended warm baryonic component
We investigate a sample of 14 clusters of galaxies observed with XMM-Newton in a search for soft X-ray excess emission. In five of these clusters a significant soft excess is evident. This soft X-ray excess is compared with the thermal emission from both the hot intracluster gas and any cooling (flow) gas that may be present. A warm (k0.2 keV), extended (several Mpc), plasma component is particularly clear in the outer parts of the cluster, where the normal cluster X-ray emission is weak. This warm component causes both a thermal soft X-ray excess at low energies (below 0.4–0.5 keV), as well as O vii line emission with a redshift consistent with a cluster origin, and not easily interpreted as Galactic foreground emission. The intensity of this component is commensurate with what has been measured before with the ROSAT PSPC in the 1/4 keV band. We attribute this component to emission from intercluster filaments of the Warm-Hot Intergalactic Medium in the vicinity of these clusters. For the central regions of clusters the detection of lines in the soft X-ray spectrum is more difficult, due to the predominance of the X-ray emitting hot plasma there, hence we cannot discriminate between the thermal and nonthermal origin of the soft excess, leaving several options open. These include thermal emission from warm filaments seen in projection in front of or behind the cluster center, thermal or nonthermal emission in the cluster core itself related to magnetic reconnection, or Inverse Compton emission from the cosmic microwave background on relativistic electrons.
Key Words.:
Galaxies: clusters: general – – Galaxies: cooling flows – X-rays: Galaxies: clusters1 Introduction
The phenomenon of soft excess in clusters of galaxies, viz. diffuse soft X-ray and EUV radiation at a level higher than that expected from the hot intracluster medium, has been a subject of controversy ever since the time of the first reports (Lieu et al. 1996a , 1996b , Mittaz et al. mittaz98 (1998)). As a result, a large number of papers on both theoretical and observational aspects appeared. On the former, in spite of the many ideas proposed, there are only two prevailing interpretations of the phenomenon: (a) the original thermal warm plasma emission model from the three papers cited above (see also Fabian fabian1997 (1997), and Cen & Ostriker cen1999 (1999)); (b) inverse-Compton scattering between the cosmic microwave background (CMB) and intracluster relativistic electrons (Hwang hwang1997 (1997), Ensslin & Biermann ensslin1998 (1998), Sarazin & Lieu sarazin1998 (1998)). On the latter, an important feature is the soft excess surface brightness relative to that of the hot virialized thermal component - this in general was seen to rise with cluster radius. The behavior was first realized in A 1795 (Mittaz et al. mittaz98 (1998)) and subsequently found to be conspicuously present also in A 2199 (Lieu et al. 1999a ), where on both occasions it was taken as evidence for pre-virialized matter falling into the cluster while getting heated. Later came results for the Shapley supercluster region where both the ROSAT PSPC and BeppoSAX LECS spectra exhibit the same effect (Bonamente et al. 2001a ). Most recently, a detailed analysis of the EUVE data of five clusters using wavelet reconstruction technique (Durret et al. durret (2002)), and a synoptic study of 38 X-ray bright clusters in directions of low Galactic absorption (Bonamente et al. bonamente2002 (2002)), revealed the rising trend of the soft excess as commonly occurring, and points to the existence of a soft radiation component from the outer region of clusters where there is insufficient virialized plasma to confine any relativistic particles. The radiation from such regions is likely to be signature of warm filaments where a significant number of baryons is expected to reside (Cen & Ostriker cen1999 (1999), Bonamente et al. bonamente2002 (2002)).
Owing partly to the challenges presented by the soft excess phenomenon to our understanding of clusters and large scale structures, papers also appeared which questioned the reality of the phenomenon in many of the cases described above. Key examples include the work of Bowyer et al. (bowyer1999 (1999)) which attributed the EUV excess at large cluster radii of A 1795 and A 2199 to an artifact of erroneous background subtraction, and Arabadjis & Bregman (arabadjis1999 (1999)) who reported the absence of a soft X-ray excess in many clusters observed by the ROSAT PSPC when these data were modeled with interstellar absorption correctly taken into account. The former was addressed by a dedicated re-observation of A 1795, A 2199, and Virgo using for the purpose of subtraction an in situ background measurement obtained by pointing at small offset from the cluster (Lieu et al. 1999a , Bonamente et al. 2001b ); in each case the EUV excess was found to remain present at statistically significant levels for the regions in question. The latter may be rebutted by noting that (a) when the ROSAT PSPC data of many clusters were analyzed or re-analyzed using the correct absorption code by the authors mentioned in the previous paragraph, a soft X-ray excess was discovered; (b) also pointed out earlier is the radially rising importance of the soft component which in the context of Arabadjis & Bregman (arabadjis1999 (1999)) would imply a cosmic conspiracy - somehow our interstellar gas distribution is correlated with the central position of many clusters.
Here we investigate the soft excess phenomenon using data obtained by the EPIC cameras (Strüder et al. strueder (2001); Turner et al. turner (2001)) onboard the XMM-Newton satellite. Compared with the ROSAT PSPC or BeppoSAX LECS instruments, the EPIC cameras have a higher sensitivity, better spatial and spectral resolution and cover a broader energy range. Reliable spectra can be obtained for energies larger than 0.2 keV. Only EUVE is sensitive to even softer photons, but this instrument lacks spectral resolving power.
2 Data selection
2.1 Cluster sample
In this paper we examine the same sample of 14 clusters described in more detail by Kaastra et al. (2002b ). Briefly, the sample consists of 13 clusters with strong cooling flows, taken from the Guaranteed Time program of the RGS consortium and other available data sets. These cooling flow clusters were selected mainly based upon their suitability for spectroscopic studies with the Reflection Grating Spectrometers (RGS) of XMM-Newton. This selection criterion favours relatively medium distant, compact and cool clusters. Nearby clusters in general have a large angular size, resulting in a degradation of the spectral resolving power of the RGS. In very hot clusters the line emission is weak with respect to the Bremsstrahlung continuum. The Coma cluster was added as a control case of a cluster without cooling flow. The cluster sample is listed in Table 1.
Cluster redshift Orbit exposure nr. (ks) Coma 0.0240 86 14 A 1795 0.0631 100 26 A 4059 0.0475 176 20 Sérsic~159-03 0.0580 77 30 Virgo 0.0043 97 29 A 1835 0.2532 101 25 MKW 3s 0.0450 129 35 A 2052 0.0350 128 27 NGC 533 0.0185 195 35 A 496 0.0324 211 7 A 1837 0.0698 200 44 Hydra A 0.0539 183 10 A 262 0.0163 203 20 2A 0335+096 0.0349 215 14
2.2 Event selection and background subtraction
The event selection and further analysis is described in more detail in another paper (Kaastra et al. 2002b ). Here we give a short summary. For most of the clusters, the data were obtained in the full frame mode, with the thin filter. Exceptions are A 496, A 1837 and A 2052 (extended full frame for pn), and Coma (medium filter). For A 1835 we discarded the MOS1 data (taken in a large window mode). The data were extracted using the standard SAS software, equivalent to version 5.3. For MOS, we included events with pattern, for pn we took only pattern. Not all hot pixels get removed by the standard SAS procedures. In particular at low energies this happens sometimes. We have verified, however, that hot pixels do not contribute significantly to the soft events.
The background spectrum of the XMM-Newton EPIC camera’s is described in detail by Lumb et al. (lumb (2002)). The main components are the cosmic X-ray background, dominating the background at low energies, and a time-variable particle component, dominating the high energy background.
2.2.1 Time-variable particle background
The time-variable particle component is caused by clouds of soft protons. Apart from long quiescent intervals, there are sporadic episodes where this background component is enhanced by orders of magnitude, as well as time intervals with only a low level of flaring.
The contribution of X-ray photons to the full field 10–12 keV band count rate is almost negligible as compared with the background. This energy band is dominated by low energy protons. Therefore it can be used as a monitor for the time-variable background component. Thus we divided the observation into time intervals of 260 s, and intervals with high particle background (as measured in the 10–12 keV band) were excluded. The threshold level for rejection was set to 35 counts / 260 s for MOS and 50 counts / 260 s for pn. This threshold is about 2.5 and 3.5 above the average quiescent level of 23 and 31 counts / 260 s for MOS and pn, respectively. Only in a few cases with enhanced background did we adopt a slightly higher threshold than the above. This was the case in A 4059, A 496, Hydra A and 2A 0335+096, where the threshold level was set to 50 for MOS and 56 for pn.
The above procedure is sufficient to remove the large flares, simply by discarding the time intervals with high 10–12 keV count rates. However after removing these intense large solar proton events the average background level still varies slightly. The r.m.s. variation from cluster to cluster is 10–20 %. This is due to the fact that for some observations the count rate is slightly enhanced but smaller than the cutoff threshold. This holds in particular for the clusters with a higher threshold but also to some extent for the others. These remaining weak flares cannot be removed by time selection. For them, however, the increase in background flux in the 0.2–10 keV raw spectrum is to first order proportional to the increase in 10–12 keV count rate. We utilize this behaviour to make a first order correction to the estimated background spectrum. The usual procedure would be to subtract the background spectrum using a blank field observation screened in the same way as the cluster data. Here in order to correct for the weak variability we divided the cluster and blank field observation into subsets with the same 10–12 keV count rate. Using these subsets we normalized the blank field background to have a flux distribution in the 10–12 keV band similar to the cluster observation. This ensures correct particle background subtraction, under the assumption that for low proton count rates the shape of the proton spectrum does not vary when its flux increases by a small amount. However in order to account for any possible remaining particle background subtraction problems, we have included a systematic uncertainty of at least 10 % of the total background in all our fits. Because the background at low energies is dominated by diffuse cosmic X-rays, and in most cases the low energy flux of the clusters we study is sufficiently well above the total (particle plus X-ray) background, our results are not very sensitive to these details in the background.
The deep field used in our background subtraction procedure consisted of the background event file provided by the XMM-Newton Science Operations Center, containing a total of 320–410 ks exposure time on 8 deep fields (the exposure time differs slightly for the different instruments). This background event file was filtered the same way as the source file.
As stated above, the contribution of X-ray photons to the 10–12 keV band count rate is almost negligible. Only for Coma, the hottest and brightest cluster in our sample, the full-field 10–12 keV cluster emission reaches a level of 10 % of the quiescent background count rate in the pn camera only. Owing to the lower sensitivity of the MOS cameras at high energies, the relative cluster contamination in the 10–12 keV band is at most 5 % there. Thus, we expect that our method over-estimates the time-variable particle contribution in Coma by 5–10 %. This does not affect our science results for Coma, however, since (i) the difference is within the systematic background uncertainty used by us; (ii) at low energies the background is dominated by the constant cosmic X-ray background, and not by the soft proton component; (iii) except for the outermost annulus, the X-ray flux of Coma is a factor of 5–100 times brighter than the subtracted background for all energies below 6 keV; (iv) the spectral fit is dominated by the higher signal-to-noise part of the spectrum below 6 keV.
2.2.2 Cosmic X-ray background
While at high energies the particle contribution dominates the background spectrum, at low energies the cosmic X-ray background yields the largest contribution to the measured background. The cosmic X-ray background varies from position to position on the sky. This is in particular important at low energies. To get a typical estimate for the sky variation, we took the PSPC count rates for 378 regions at high Galactic latitude as studied by Snowden et al. (snowden2000 (2000)) and determined the population variation for this component in the R1 (low energy) band; the r.m.s. variation is typically 353 %. In principle, the background estimate for any location on the sky can be improved by taking the measured PSPC count rates into account. However, this requires detailed spectral modeling of the soft X-ray background for each position on the sky that is being studied, which can be rather uncertain due to the poor spectral resolution of the PSPC. Here we have taken a conservative approach by using the average background as contained in the standard EPIC background files, but we included a systematic background error of 35 % of the total background below 0.5 keV, 25 % between 0.5–0.7 keV, 15 % between 0.7–2 keV, and 10 % above 10 keV. This last 10 % also includes the systematic uncertainty in the subtracted time-variable particle background component.
Note that the above 35 % systematic background uncertainty at low energies is a r.m.s. estimate. In individual cases there may be a larger deviation from the average high latitude X-ray background.
The differences between the spectral response for pn data taken with the full frame mode (as in our deep fields) and the extended full frame mode (as in some of our clusters) are negligible compared to the systematic uncertainties on the background and effective area that we use in this paper. Of more importance is the difference between data taken with the medium filter (Coma) and the thin filter (all other clusters and the deep fields). For a power law photon spectrum with photon index 2, the medium filter produces about 10 % less counts at 0.2 keV, 6 % less at 0.3 keV, and less than 2 % above 0.4 keV. These are all well within our adopted systematic uncertainties.
Finally, in all fields the brightest X-ray point sources were removed.
2.3 Assessment of the calibration accuracy
Since soft excess emission occurs near the lower boundary of the useful energy range of the EPIC camera’s, assessing the current accuracy of the calibration is an important issue. Currently the quoted accuracies for the EPIC calibrations of the effective area are in the order of 5 % between 0.4 and 10 keV for pn (Briel et al. briel (2002)) and also a 5 % between 0.2 and 10 keV for MOS (Ferrando et al. ferrando (2002)). A larger difference exists between the pn and MOS cameras at higher energies (5 keV).
Hence we have investigated the quality of the calibration specifically for the low energy part of the spectrum. We have studied MOS2 spectra, taken with the thin filter, of the BL Lac object PKS 2155-304. The thin filter is used for all our clusters except for Coma. The spectrum of PKS 2155-304 is known to be a power law over a broad energy range, which is confirmed by high resolution grating spectra (XMM-Newton RGS, Chandra LETGS). An analysis by our group of the LETGS data of PKS 2155-304 leads to a best estimate of the Galactic column density of cm-2, within the error bars of the independently measured 21 cm column density ( cm-2, Lockman & Savage lockman (1995)).
Fitting this spectrum over the full 0.2–10 keV range (as we will do for our clusters) with a power law and keeping the absorption column fixed to the above value, leads to an acceptable fit. In the low energy range below 1 keV the fit residuals are in general less than 5 %, while the fit shows an apparent soft excess in the 0.2–0.3 keV band of 5 %. This excess should be attributed to the remaining calibration uncertainties. If instead we leave the column density as a free parameter, the best fit value is cm-2, i.e. cm-2 smaller than the Galactic value. The fit residuals over most of the energy range have only slightly changed, and are still less than 5 % below 1 keV. The ”soft excess” in the 0.2–0.3 keV band has diminished now from 5 % to a negligible 2 %.
We conclude from the above that in spectral fits over the full 0.2–10 keV range, a 5 % excess in the 0.2–0.3 keV band (or any other higher energy band) falls just within the calibration uncertainty, and an apparent column density deficit of cm-2 is also within this uncertainty range.
We have repeated the same analysis using pn data of PKS 2155-304. Typically the fit residuals are a factor of 1.4 larger as compared with MOS2.
Hence, in the following we will only consider detections of a soft excess secure for those spectra where the measured excess corresponds to 10 % or more in the 0.2–0.3 keV band, or apparent column density deficit larger than cm-2).
Combining MOS and pn data, we have accommodated for these uncertainties by using systematic errors to the spectra of 10 % of the source flux below 0.3 keV and above 2 keV, and 5 % in the 0.3–2 keV range. This is in addition to the systematic uncertainty in the background.
2.4 Spectral extraction and fitting
Spectra were extracted in 9 annuli with outer radii of 0.5, 1, 2, 3, 4, 6, 9, 12 and 16′. The effective area for each annulus was determined as follows. First, a template image was created (for which we took a vignetting-corrected ROSAT PSPC image, obtained from NASA’s skyview utility). This image was then corrected for energy-dependent vignetting (both due to the telescope and in case of the MOS cameras also due to the Reflection Grating Array). This vignetted image was convolved with the energy and position dependent telescope point spread function . After this the exposure correction for bad pixels/columns, CCD gaps and excluded point sources was taken into account. This procedure was followed for a grid of energies. The ratio of the number of counts in these simulated images to the number of counts in the original image was then used as the (energy-dependent) correction factor to the full on-axis effective area. No deprojection corrections were applied. The spectra for each annulus were then fitted individually. Again, more details and justification for this procedure are given by Kaastra et al. (2002b ).
The template PSPC images represent the low-energy emssion ( keV). However, this does not strongly affect our effective area correction for high energies, because the image mainly serves to estimate what fraction of the photons from a given annulus are detected in the neighbouring annuli due to the instrumental point spread function of XMM-Newton. This fraction depends only a little upon the shape of the image within the annulus, not upon its normalisation. Our method does not produce bias as long as the spectral shape does not vary on a smaller scale compared with the width of the annulus. This condition is met in all of our clusters.
The spectra for each annulus were accumulated in 15 eV bins. These bins were then binned further onto a grid with spacing of about 1/3 FWHM for all three detectors. We used the same energy grid for all three detectors. Further binning with a factor between 2–12, intended to enhance the S/N ratio for the weak spectra of the outer parts, was performed for all spectra, in particular for the parts of the spectrum where no spectral lines are present. Spectral fitting was restricted to the 0.2–10 keV range. The energy range below 0.2 keV is currently too poorly calibrated to be useful for spectral analysis.
For the spectral analysis, we used the SPEX package (Kaastra et al. 2002a ). For the interstellar absorption, we used the Morrison & McCammon (morrison (1983)), and for thermal plasma emission we used the collisional ionization equilibrium (CIE) model as available in SPEX. Systematic errors, both as a fraction of the source spectrum and the background spectrum, were added according to the prescriptions of the previous sections.
We fitted all three EPIC spectra together. The MOS and pn fit results are consistent with each other, as follows from plots of the fit residuals that we made for each spectrum. There were no significant differences larger than the systematic uncertainties assigned to each energy, and for our best-fit models the values showed full consistency with the model for most spectra.
3 Spectral analysis
3.1 Basic spectral model
As a basic spectral model, we use at each radius a two temperature model with Galactic absorption. The abundances are left as free parameters. In the center of most of our clusters (except for Coma) there is a combination of hot and cooler gas. As RGS spectra of all our clusters have shown (Peterson et al. peterson2001 (2001); Kaastra et al. kaastra2001 (2001); Tamura et al. 2001a , 2001b , Peterson et al. peterson2002 (2002)), the amount of cooling gas in the cluster centers is much smaller than predicted by the standard isobaric cooling flow model, and in most clusters there is not much gas found below a temperature of about a third of the hot gas temperature. Therefore we decided to constrain the model to a two temperature model, with the temperature of the coolest gas fixed to half the temperature of the hot gas. This recipe keeps the fitting procedure stable. In fact, a factor of about two difference in temperature between both components is just the maximum temperature resolution that can be reached for any spectrum. It corresponds to the typical temperatures of which most ions have a significantly different concentration. With CCD spectral resolution, as we have here, the temperature structure is mostly constrained by the different line centroids of the L-shell spectra of iron ions, each ion being sensitive to a different temperature range. In the fit we left the abundances of Fe, Si and O free, and since the strongest Ne and Mg lines occur in the Fe-L shell energy band, which is the strongest temperature indicator, we also left those abundances free. In order not to increase the number of free parameters unnecessarily, we coupled the abundances of S, Ar, Ca and Ni to the Si abundance, and the abundances of C and N to the abundance of O, using solar ratios (Anders & Grevesse anders (1989)). However our results are not too strongly dependent upon the precise abundances. In order to reduce the number of free parameters further, we fixed the abundances of the cool component to those of the hot gas.
While a two temperature structure is the natural choice for the innermost cooling part of the cluster, usually the gas in the outer parts of the cluster is assumed to be isothermal, with a single temperature at each radius. In some clusters substructure in the outer parts may cause a broadened temperature structure, and thus in those cases our two temperature approach will lead to a better description. Also in those cases where there are large scale variations in temperature from one side of the cluster to the other, the annular spectra may contain gas at different temperatures. In those cases where the gas is truly isothermal, we find that the emission measure of the coolest gas drops to zero, and in several of our clusters this is indeed the case.
For each cluster we then determined the best fit two temperature model with Galactic absorption as the starting point for further analysis.
In most of the clusters, the measured spectrum in the outermost, 9th annulus (12–16′) is too noisy to yield useful constraints, mainly due to the relatively large background in the EPIC data. Therefore we restrict the analysis to the innermost 8 annuli (radius less than 12′) for all our clusters except for Coma and Virgo. In addition, A 1835 has a relatively small angular size (mainly due to its large redshift), and for that cluster we also discard annulus 8 (9–12′). The Coma annuli are centered on one of the two dominant elliptical galaxies, NGC 4874, which has a distinct spectrum from the rest of the cluster (Arnaud et al. arnaud2001 (2001)); the same holds for Virgo with M 87 (Böhringer et al. boehringer2001 (2001)). In both cases we therefore discarded the innermost annulus (0.5′) containing these elliptical galaxies. Finally, in A 4059 the standard two temperature model did not provide a good fit. Chandra observations of the central part of the cluster (Heinz et al. heinz (2002)) show strong interaction between the central AGN and the cluster medium with cavities etc. Therefore we also discarded the innermost annulus of A 4059 in our present analysis.
3.2 Absorption deficit?
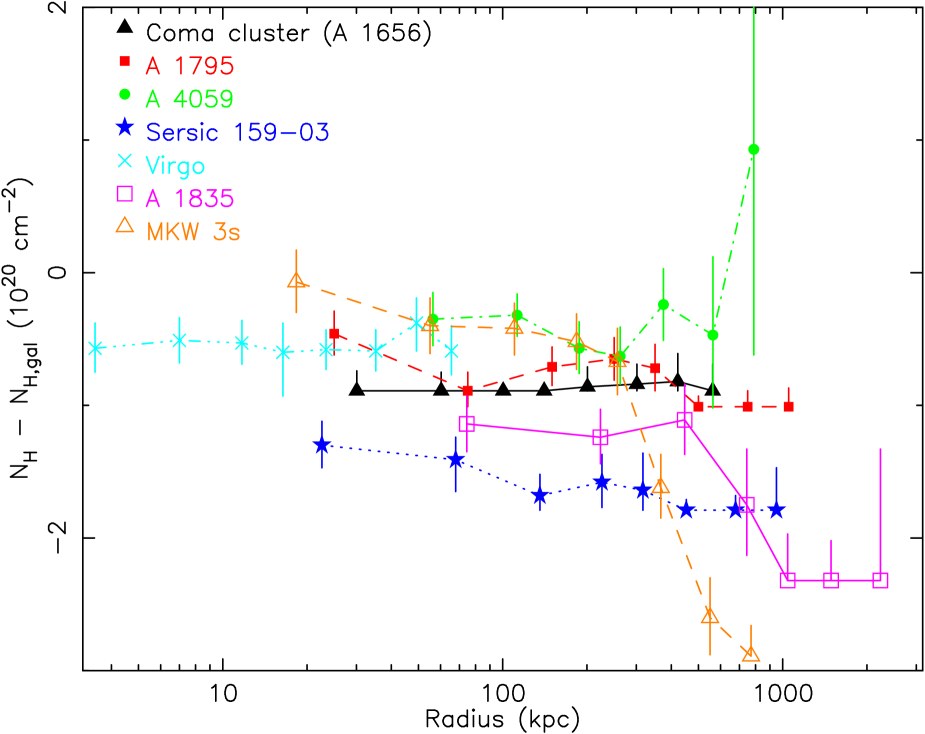
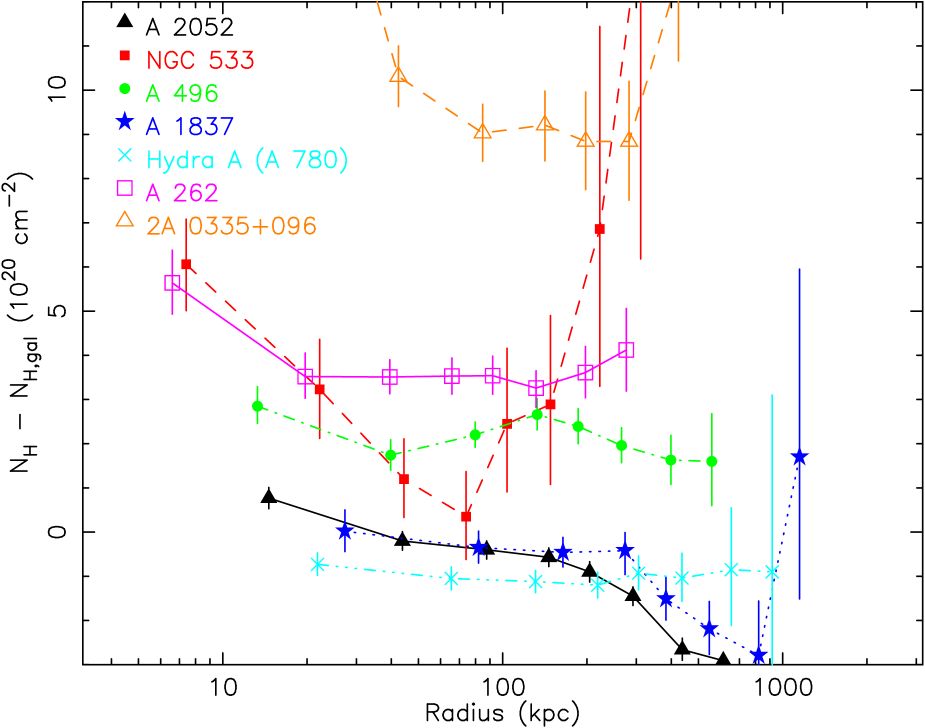
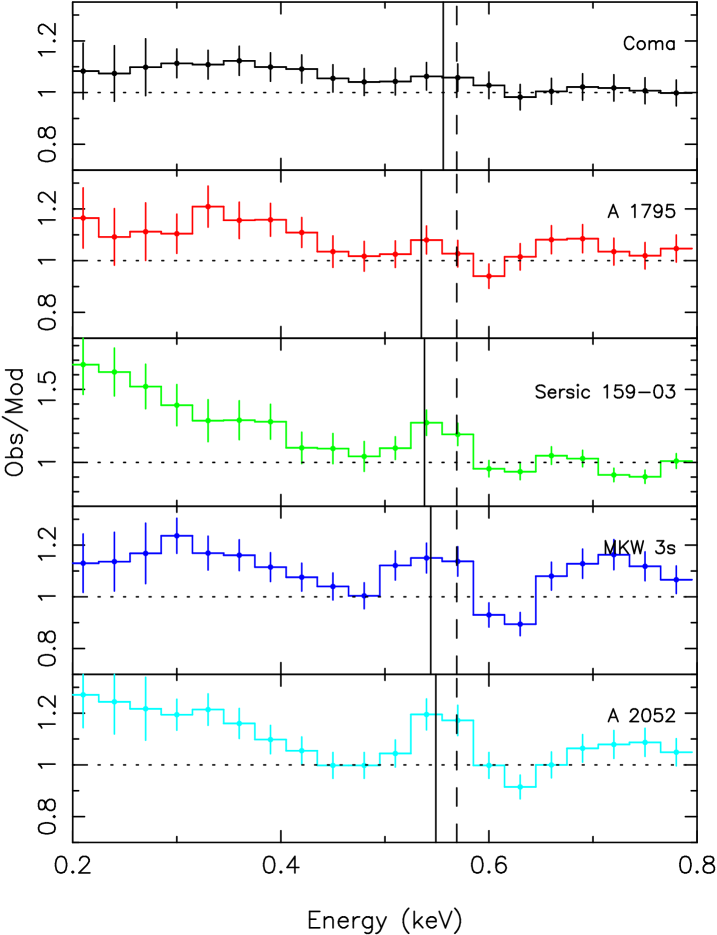
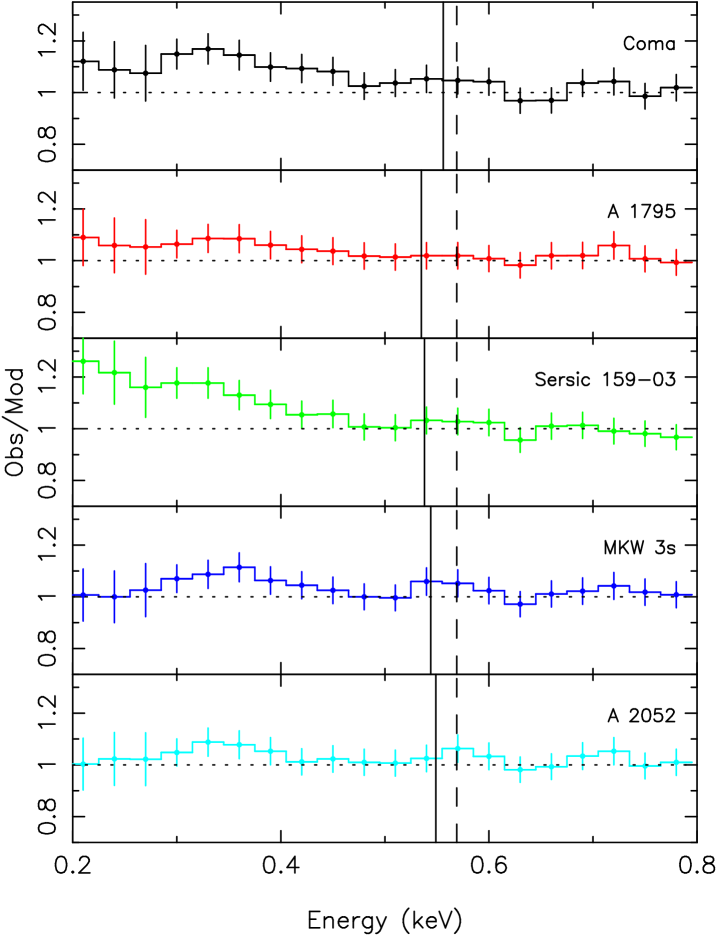
As a first model to test the presence of soft excess emission in our clusters, we have modified our standard two temperature model with fixed Galactic column density. Instead we allow the absorbing column density to be free. We have determined the best fit column densities and plot the difference with the adopted Galactic column density in Figs. 1 and 2.
In most of our clusters the fitted Galactic column density appears to be almost constant with radius. In a few cases there appears to be a small relative excess absorption in the innermost bin(s). This may be real but could also be due to inappropriate modeling of the complex cool gas distribution in the innermost core, or modeling inaccuracies due to the strong spectral gradients in the central bin, which has a size not much larger than the width of the telescope point spread function. Excess absorption in the cores of clusters of galaxies will be studied in detail in another paper (Kaastra et al. 2002, in preparation).
In a few clusters (MKW 3s, A 2052, A 1837) we observe a strong apparent drop of the fitted column density beyond kpc radius. In all these three clusters this drop occurs beyond the radius where also the hot intracluster medium starts to have a significantly lower temperature.
We have also determined the weighted average of the column density for all our clusters. The results are summarized in Table 2 and Fig. 3.

Cluster Coma 0.89 0.01 0.05 0.88 A 1795 1.01 0.13 0.06 0.88 A 4059 1.06 0.64 0.13 0.42 Sérsic 159-03 1.79 0.10 0.07 1.69 Virgo 1.80 1.25 0.09 0.55 A 1835 2.32 0.84 0.15 1.48 MKW 3s 2.89 1.88 0.12 1.01 A 2052 2.91 1.84 0.11 1.07 NGC 533 3.00 5.66 0.66 2.66 A 496 4.23 6.44 0.20 2.21 A 1837 4.38 3.71 0.24 0.67 Hydra A 4.80 3.79 0.17 1.01 A 262 5.33 8.94 0.24 3.61 2A 0335+096 18.64 28.71 0.50 10.07
In 10 out of 14 clusters we obtain a lower column density than the Galactic column density. Only in four clusters we find excess absorption: NGC 533, A 496, A 262 and 2A 0335+096. All these four clusters with apparent excess absorption have rather poorly determined 21 cm column densities. A higher total column density of cm-2, consistent with what we find here (( cm-2) was found before in PSPC spectra of 2A 0335+096 (Irwin & Sarazin irwin (1995)). Our column density in A 262 is also consistent with an earlier PSPC analysis (David et al david96 (1996)). The higher column density in A 496 has also been reported before by Tamura et al. (2001b ).
It is unclear why some of these column densities are so large. For example, the maps of Dickey and Lockman (dickey (1990)) show a range of column densities between cm-2 for a cone of 2° around A 262, clearly excluding a high value of as we measure here. However, IRAS 100 m maps (obtained with NASA’s skyview facility) show enhanced emission near the cluster and to the east of it, suggesting that perhaps some additional absorption by Galactic dust and gas could explain the excess absorption. This was also suggested earlier by David et al. (david96 (1996)).
A 496 is located at the NW boundary of a region of several degrees diameter with enhanced infrared emission, so also here enhanced absorption is a legitimate interpretation.
2A 0335+096 is located in a region of the sky which has already a large column density, and the infrared maps show strong and patchy emission in this region. So again excess absorption is not unexpected.
Only NGC 533 appears to be in a region with a rather smooth column density distribution, with not much indication of enhanced infrared emission. Inspection of Fig. 2 shows that the excess absorption is mainly due to the innermost two annuli; we note that this cluster is very compact, in fact its angular core radius is almost similar to that of A 1835, and its surface brightness as observed by EPIC drops by an order of magnitude within the central annulus. Thus, similar to that cluster modeling problems related to the instrumental psf in combination with the strong spectral gradients in the central part may explain this deviation.
Therefore, a likely explanation for the apparent (NGC 533) or true (A 496, A 262 and 2A 0335+096) excess absorption in these four clusters can be given. In the remainder of this paper we therefore focus upon the 10 clusters with an absorption deficit. For consistency, we checked the IRAS 100 m maps for all these 10 clusters, and found only significant cirrus-like structure for A 1837. All others appeared to have rather smooth infrared maps.
For the 10 clusters with an apparent lower column density, the derived deficit ranges between cm-2. The significance of this deficit should be assesed against three sources of uncertainty: the measured error in the 21 cm column density, the statistical error in our X-ray determination of the column density, and the systematic calibration uncertainty of our instruments.
In most of these 10 clusters with an apparently lower column density, this deficit is much larger than the typical uncertainty of about cm-2 in the measured 21 cm column density. For example, for Coma the inferred column density is almost zero. A total column density that is significantly smaller than the Galactic column can thus be excluded.
The statistical errors on the X-ray column densities (Table 2, third column), though already overestimated by the inclusion of systematic uncertainties in our spectral modeling, are always smaller than cm-2 for the 10 clusters with an absorption deficit.
The deficit in many of these clusters is also larger than the typical systematic calibration uncertainty of cm-2 (see Sect. 2.3). The apparent lower column density is therefore most likely due to excess emission instead of lack of absorption. We conclude that in several of our clusters there is a real soft excess. In the next section we argue that in five of the ten clusters with apparent absorption deficit the phenomenon is due to a soft X-ray excess in the spectrum. In the remaining cases either the statistics are insufficient to establish a soft excess, or there are other complicating factors.
3.3 Significance of the soft excess
In order to characterize the apparent soft excess and to assess its significance, we have fitted the spectra using our previous model for a two temperature plasma with Galactic absorption, plus in addition a third soft emission component for which we consider three different cases: a power law spectrum, a thermal plasma with cluster abundances (coupled to the abundances of the hot gas), and a thermal plasma with zero metallicity (pure H/He mixture).
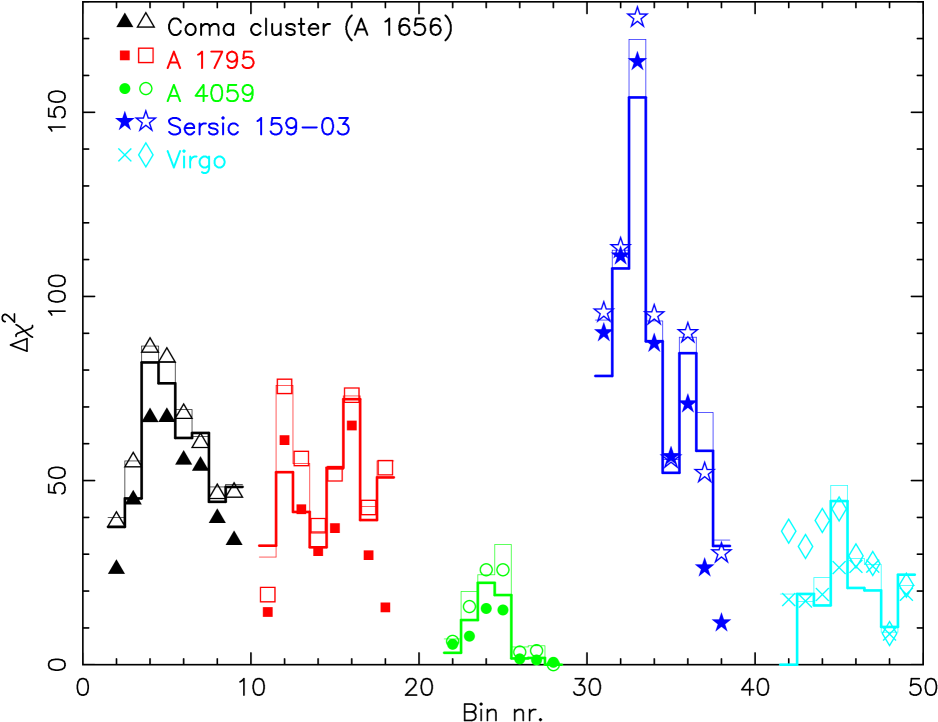
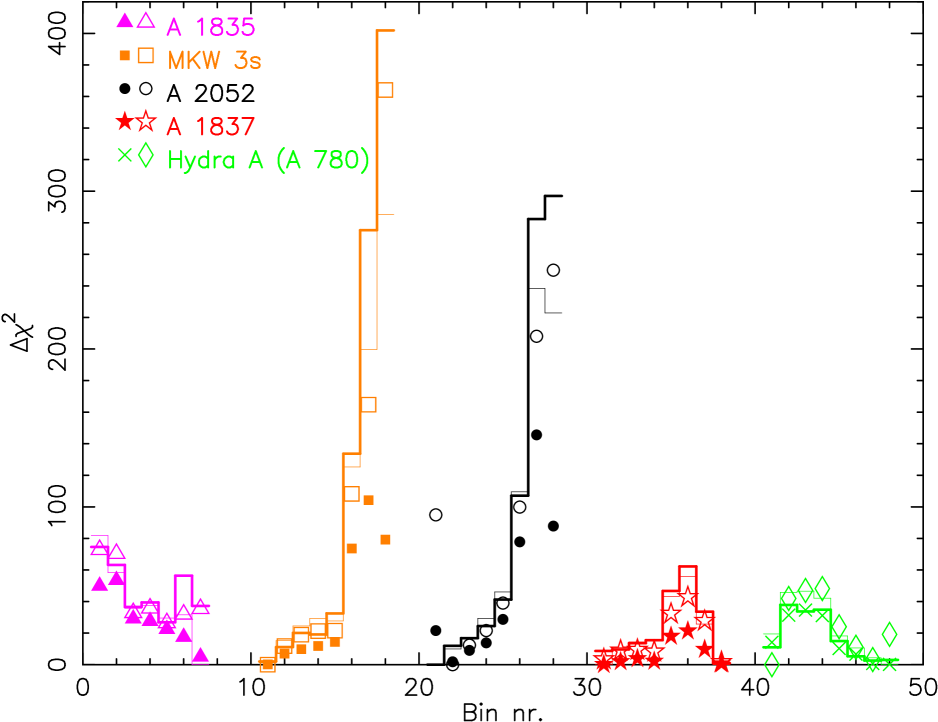
By introducing these additional soft emission components, the fits improve dramatically. This is shown in Figs. 4 and 5, where the improvement in is shown as compared with the two temperature model with Galactic column density. All three models (as well as the model of a free column density discussed in the previous section) give very similar improvements in the fits. How significant are the improvements in the fits? We have performed formal F-tests for all three models on all the cluster spectra. A significant improvement at the 95 % confidence level or much higher is achieved in at least two annuli for the following clusters: Coma, A 1795, Sérsic 159–03, A 1835, MKW 3s and A 2052. In these last two cases the excess is in particular strong in the outermost annuli, while for Sérsic 159–03 the excess is strong for all radii.
In A 4059, Virgo, A 1837 and Hydra A, the fit improvement is in general not very significant. In the first three cases also the apparent column density deficit (Table 2) is within the suspicious range for systematic calibration uncertainties (see section 2.3). Hydra A has a rather large Galactic column density, making the low energy flux small, and thereby the detection of any soft component more difficult.
A 1835 is by far the most compact cluster in our sample, due to its large redshift (0.25). It only shows a significant excess in the innermost two annuli, within a radius of 1′. Possible small scale spectral gradients in this innermost cooling core in combination with the instrumental point spread function forces us to be more alert on possible systematic uncertainties. Hence in the remainder of our paper we will only focus upon the five most clear cases: Coma, A 1795, Sérsic 159–03, MKW 3s and A 2052.
Is it possible to test which of the three models for the soft excess (power law, thermal CIE model with cluster abundances, thermal CIE model with zero metallicity) fits the data best? Performing a formal F-test, only for the outermost two annuli 7 & 8 (radius between 6–12′) of the MKW 3s and A 2052 clusters the thermal CIE model with cluster abundances is much better than the power law model or the thermal CIE model with zero metallicity. Hence, in Sect. 5 we investigate in more detail the properties and physical implications for these three models in all five clusters with a significant soft excess. But first we consider the spectral signature of the soft excess in these five clusters.
3.4 Spectral signature of the soft excess: O vii emission
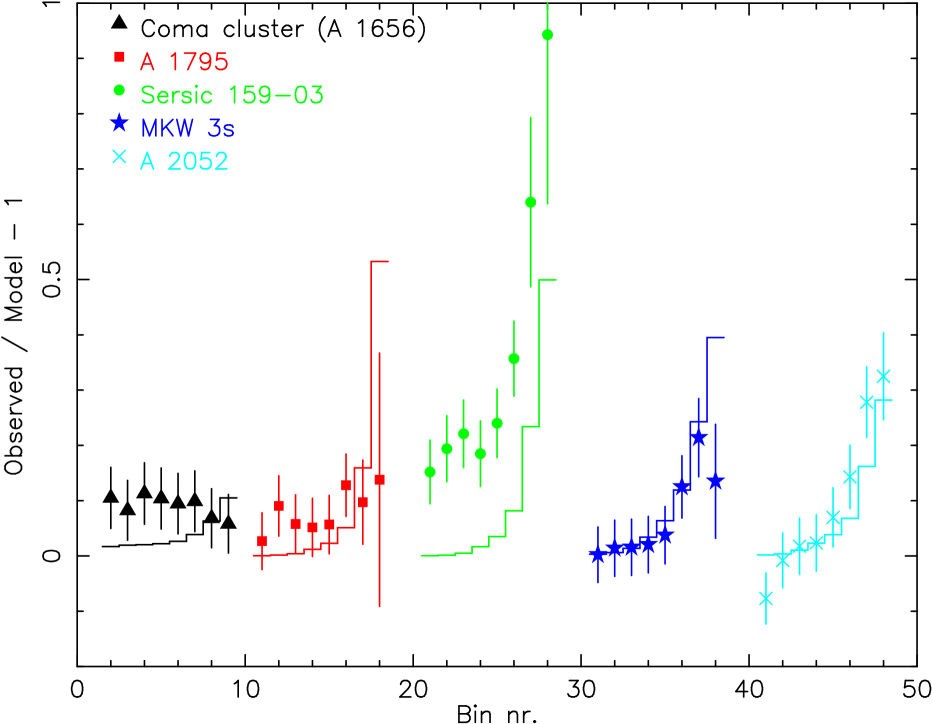
The fit residuals with respect to our basic two temperature model in the outer part of the clusters (4′–12′) show in several cases apart from a soft excess also clear evidence for an emission blend of O vii around 0.54 keV. This is demonstrated in Fig. 6. The centroids of this feature could be determined for Sérsic 159–03, MKW 3s and A 2052 (Table 3).
Cluster Galaxy cluster Sérsic 159–03 54410 57610 MKW 3s 53714 56114 A 2052 55010 57010
Note that for these plots the systematic background errors were excluded because of the following reasons. In the inner parts (Fig. 7) the background can be neglected anyway (the modeling errors are dominated there by the systematic effective area uncertainties and data Poisson noise). In the outer parts (Fig. 6) we will show below (Fig. 8) that the degree of soft X-ray excess is commensurate with the 1/4 keV sky background enhancement in the vicinity of these clusters - an effect at the level of our 35 % adopted systematic background uncertainty at low energies. Thus the question concerning whether the outer soft excess is a background rather than cluster phenomenon is already clear, and has to be addressed by examining the original spectral data of the excess.
The resonance, intercombination and forbidden line of O vii have energies of 574, 569 and 561 eV, respectively; for a low density plasma at 0.2 keV temperature, the centroid of the triplet (including satellite lines) has an energy 568.7 eV, and for the entire 0.05–3 keV temperature range this centroid does not vary by more than 0.5 eV.
It is evident from Table 3 that the measured centroid is in agreement with an origin at the cluster redshift. However, we cannot fully exclude that (a part of) it is of Galactic origin. This would be the case in particular if the triplet emission would be dominated by the forbidden line (561 eV), which is the case if photoionization of this medium is important. Although photoionization of the interstellar medium by the diffuse Galactic radiation field may occur, it is not obvious that it should be as strong as for example in AGN environments. Some caution is also needed, because the centroid may be slightly shifted due to the influence of the O viii Ly line of the cluster at 653 eV, which is redshifted by about 30 eV towards any Galactic O vii triplet.
In order to investigate the origin of the O vii emission further, we have performed an additional set of spectral fits. Contrary to our earlier analysis, we took for the soft excess not a relatively cool plasma with cluster abundances and cosmological redshift, but a plasma with solar abundances and zero redshift (i.e. a Galactic origin). Restricting again to the 4–12′ range, increases (with respect to the hypothesis of a cluster origin) from 864 to 884, 671 to 743 and 798 to 948, for Sérsic 159–03, MKW 3s and A 2052, respectively. The number of degrees of freedom in all cases is 702. When we perform a formal F-test, the Galactic origin can be rejected only marginally for MKW 3s (at the 91 % confidence level) and more significantly for A 2052 (at the 99 % confidence level). The increase for Sérsic 159–03 is not significant (formal level: 62 %).
Finally we have checked whether uncertainties in the gain of the EPIC camera’s may affect our results. The gain slowly degrades as a function of time, but in principle the data processing takes this into account. We have measured the energy of the instrumental background line of Al-K at 1.487 keV for MKW 3s and A 2052. For both fields, the measured centroid for all three EPIC camera’s agrees within 1 % with the predicted energy: the measured average line energy for MKW 3s is only 0.4 % smaller than predicted, and for A 2052 0.8 %. For the pn camera, the measured energy of the Cu-K instrumental line even agrees within 0.1 % with the predicted energy of 8.041 keV. We conclude that there is no evidence for significant energy scale uncertainties.
The O vii emission line is difficult to recognize in the central parts of the clusters. This is illustrated in Fig. 7. This does not imply that there is no such line emission in the central parts, but its signal may simply be lost due to the strong intensity of the radiation from the hot gas, which is in particular bright in the cluster core.
We conclude that in particular in the outer parts of some of our clusters there is evidence for O vii line emission, and that at least a significant component of the emission resposible for this line feature is of cluster origin.
4 Sky background variations
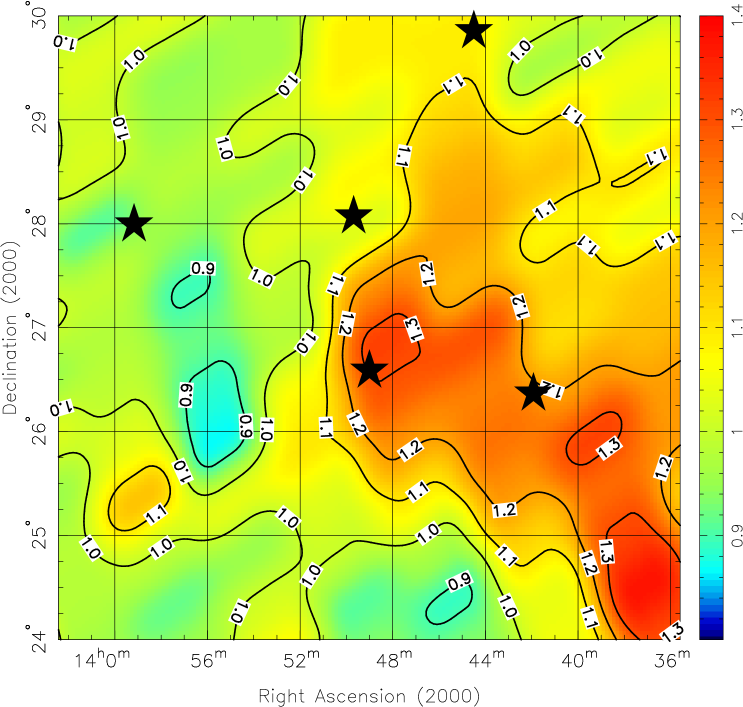
In order to test if the excess can be explained by sky variations of the diffuse X-ray background, we have collected intensity maps of the 1/4 keV band of the ROSAT PSPC (Snowden et al. snowden97 (1997); we took the data from NASA’s skyview facility). Table 4 lists the count rates for all clusters as well as the background field in three annular regions: the innermost region with a radius of 15′ typically spans the XMM-Newton field of view, the second and third annuli give the background in the annuli between 1°–2° and 2°–5° from the cluster. For the background field, we have determined the exposure-averaged values for the 8 individual fields. The variation among those fields is consistent with the adopted 35 % variation at low energies. For the brightest clusters (Coma, Virgo), the enhanced emission due to the cluster itself is clearly visible in the innermost annulus.
Cluster 0′–15′ 1°–2° 2°–5° Coma cluster 2.07 1.21 1.37 A 1795 1.31 1.07 1.10 A 4059 0.97 0.86 0.89 Sérsic 159–03 1.21 0.99 1.02 Virgo 2.44 1.20 1.44 A 1835 1.03 0.99 1.01 MKW 3s 1.28 1.19 1.20 A 2052 1.36 1.18 1.21 NGC 533 0.46 0.47 0.47 A 496 0.83 0.86 0.84 A 1837 0.50 0.58 0.57 Hydra A 0.64 0.60 0.61 A 262 0.53 0.50 0.50 2A 0335+096 0.55 0.52 0.52 Background 0.90 0.86 0.87
The spectrum of the diffuse background at high Galactic latitudes has been modeled by Kuntz & Snowden (kuntz (2000)). It consists of four components. We list them here with their relative contributions in the 0.2–0.3 keV band: 1. the local hot bubble with temperature 0.11 keV (48 %); 2. A soft distant component with temperature 0.09 keV (34 %); 3. A hard distant component with temperature 0.18 keV (7 %); 4. The extragalactic power law with photon index 1.46 (11 %). In the soft 0.2–0.3 keV band, most of the diffuse sky background is therefore due to local warm gas.
All the five clusters with a soft excess appear to be located in regions with enhanced soft X-ray background as compared with our background field, as is evident from Table 4. The background in the 1–2° annulus is enhanced by 41, 24, 15, 38 and 37 % for Coma, A 1795, Sérsic 159–03, MKW 3s and A 2052, respectively. In Fig. 8 we plot the fractional soft excess in the 0.2–0.3 keV band, as compared with the two temperature model. The error bars in this plot do not contain the 35 % systematic background uncertainty that we took into account otherwise in our analysis. Instead of that we also plot an estimate of the contribution to the measured soft excess due to the local X-ray background enhancement. This estimate is given by the subtracted background in the XMM-Newton data, multiplied by the excess percentages mentioned above as derived from the PSPC data. This is justified here since at low energies the total background in the EPIC camera’s is dominated by the diffuse X-ray background and the contribution of particles is small.
In A 1795, MKW 3s and A 2052, the observed soft excess is clearly consistent with an enhancement of the diffuse soft X-ray sky background in the vicinity of each cluster, as revealed earlier by ROSAT. This is not the case for Coma, and definitely not the case for Sérsic 159–03, although in this last case the increase of the soft excess beyond 4′ (annuli 6–8) could be due to this sky background enhancement. Note also that all five clusters except Coma are located not only in regions with enhanced soft X-ray emission, but interestingly they are also close to the boundaries of these large scale structures (see Figs. 9–12). We come back to this in Sect. 6.
The enhancement of the diffuse soft X-ray sky background near at least three of these clusters thus corresponds well with the detected soft X-ray excess. Its magnitude is consistent with the 35 % systematic error applied to the lowest energy part of the spectra. The third, soft component added to our model describes both shape and magnitude of this enhancement quite well, as is evidenced by the improvement of the fit.
5 Models for the soft excess
We have seen before that it is not always possible to discriminate between the three different spectral models, based upon goodness of fit criteria. Therefore we consider in this section the implications and derived physical parameters for all three scenarios.
5.1 Power law model
A non-thermal interpretation of the soft excess was discussed in section 1. More recently, McCarthy et al. (mccarthy (2002)) proposed that a power law component contributing 30 % of the total luminosity in the central parts of several clusters provides a good fit to the ASCA/PSPC spectra of these clusters. They couple this to the cooling flow problem. The relativistic electrons may either be genuinely diffuse or associated with AGNs. It should be emphasized, however, that any widespread existence of such electrons in the intracluster medium cannot easily be accounted for by processes other than diffusive shock acceleration of cosmic rays, which necessarily implies the intracluster presence of relativistic protons carrying at least ten times more pressure than the electrons (see Lieu et al. 1999b ). Thus, while for a central cluster region this pressure may even provide the means of halting any cooling flows, for the outer regions a large cosmic ray pressure may pose stability problems - as also alluded to in section 1, the cosmic rays cannot be confined.
The derived photon index of the power law component for the five clusters with a significant soft excess is shown in Fig. 13, the luminosity in the full 0.2–10 keV band as a fraction of the luminosity of the thermal gas is shown in Fig. 14.
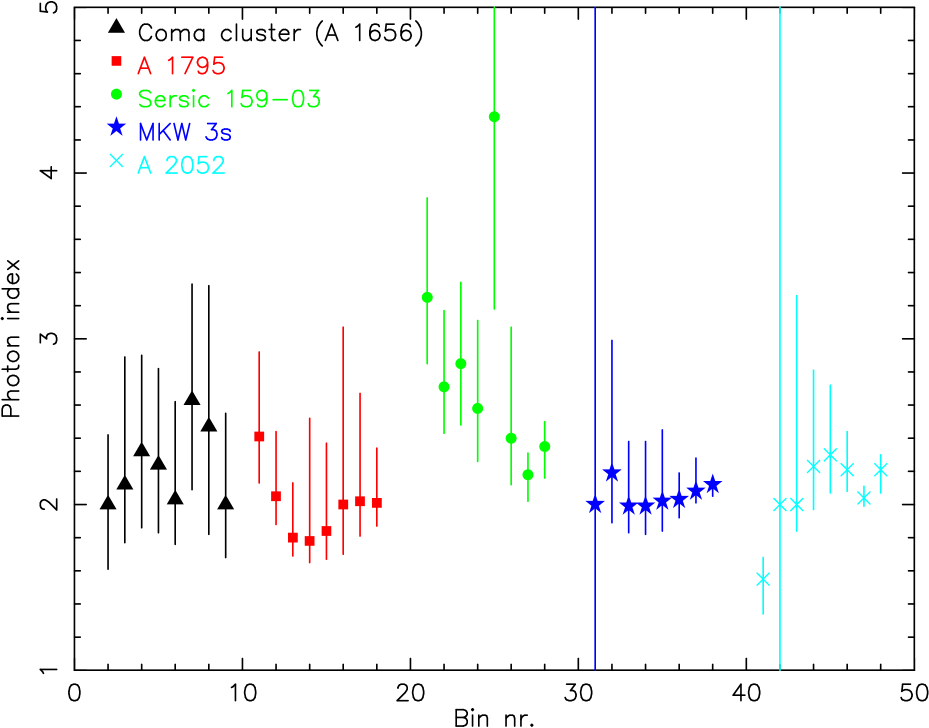
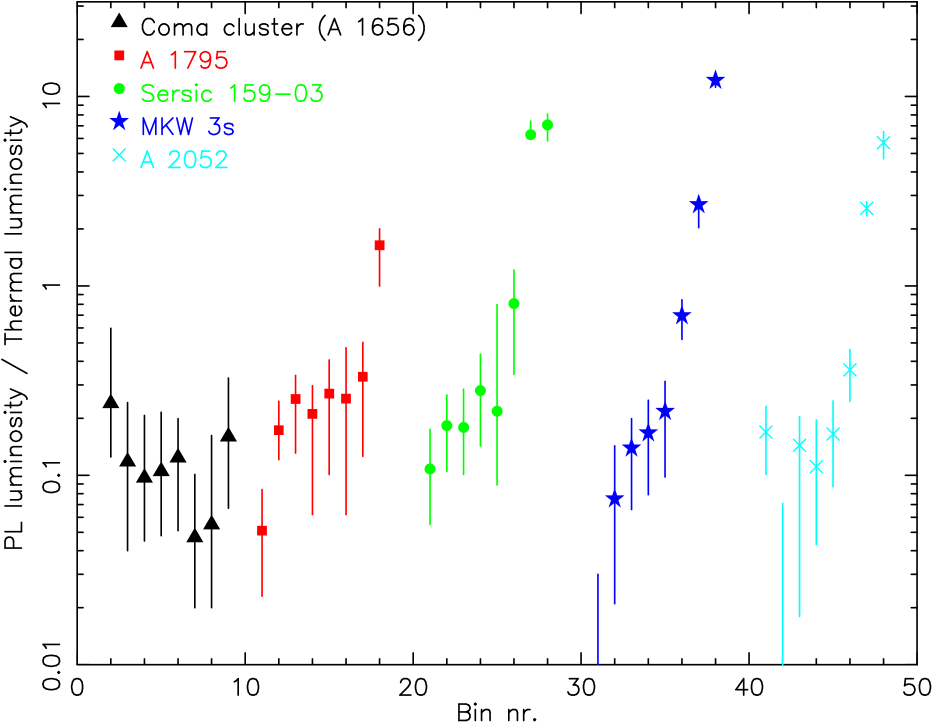
For Coma, the soft excess contributes about 10 % to the total luminosity of all annuli, while for the other clusters the relative contribution of the power law increases from about 10 % in the center to 100 % or even a factor of 10 larger in the outer parts. It should be noted, however, that for the outermost annuli of MKW 3s and A 2052, where the relative luminosity of the power law is very large, a thermal model with cluster abundances for the soft excess yields a better fit.
The photon index as a function of radius is constant for most clusters, at a value close to 2. Only in Sérsic 159–03 the photon index decreases from about 3 in the center to about 2.3 in the outer parts.
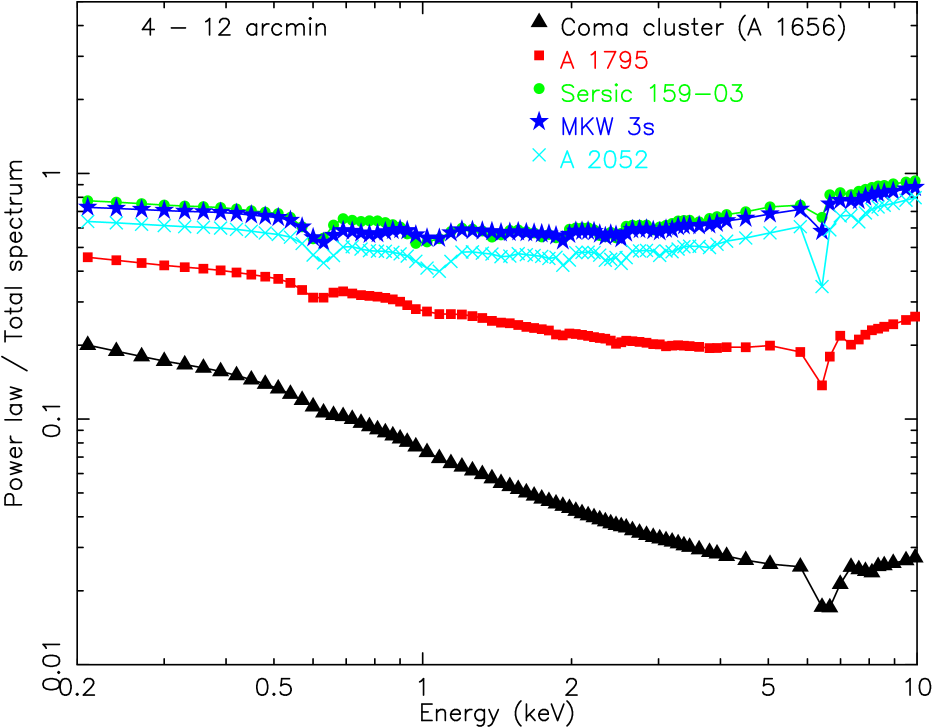
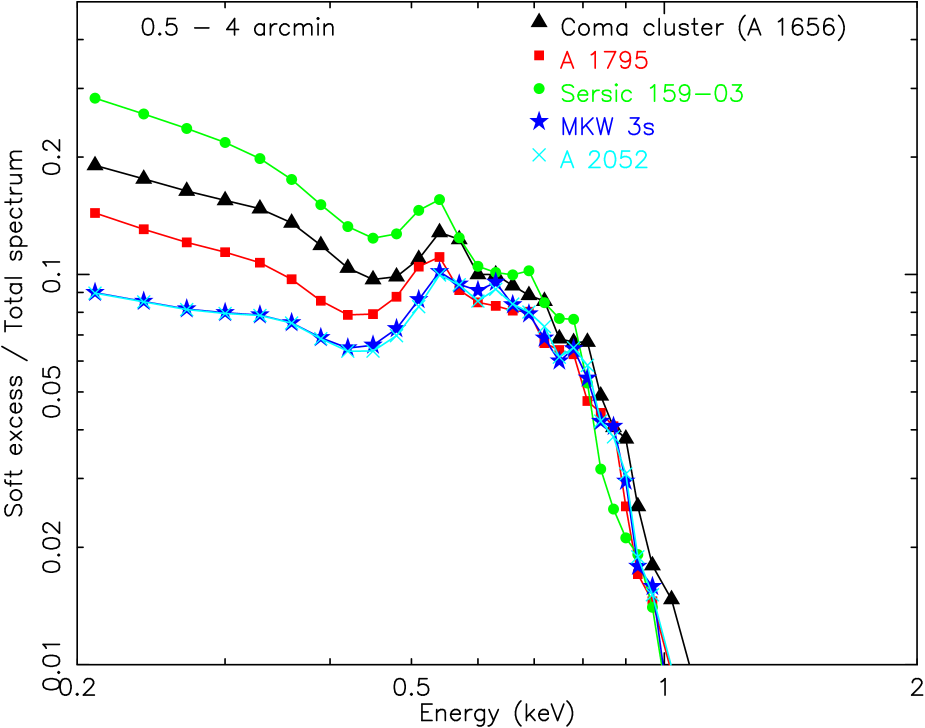
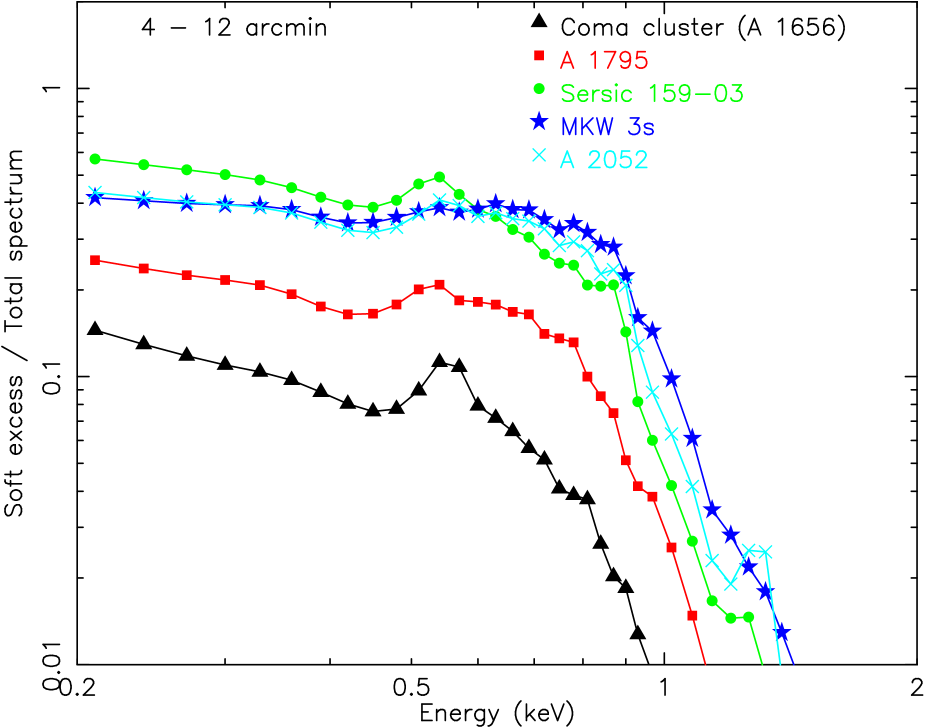
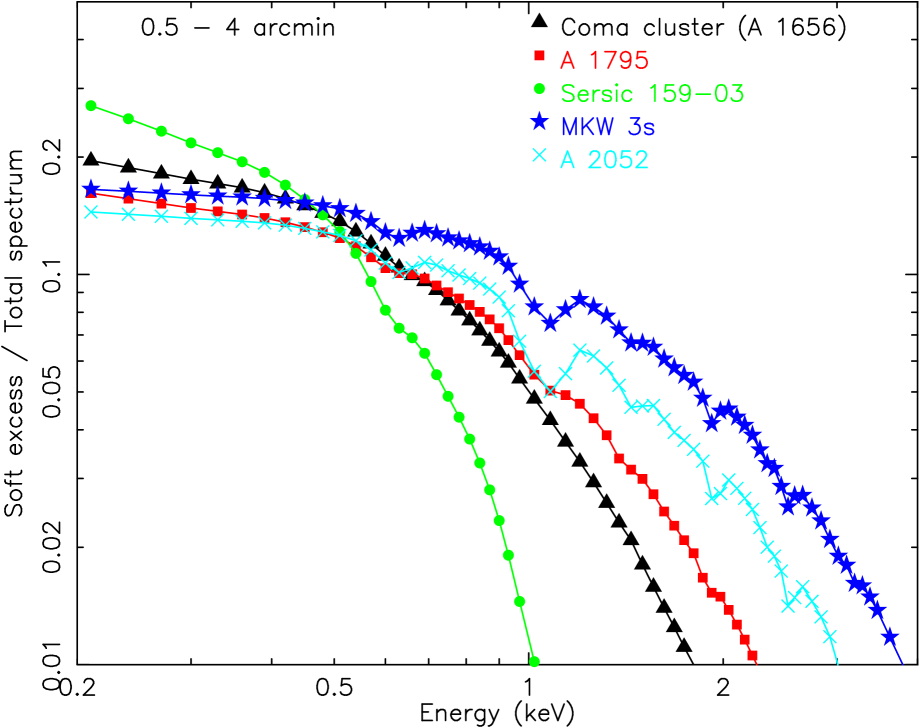
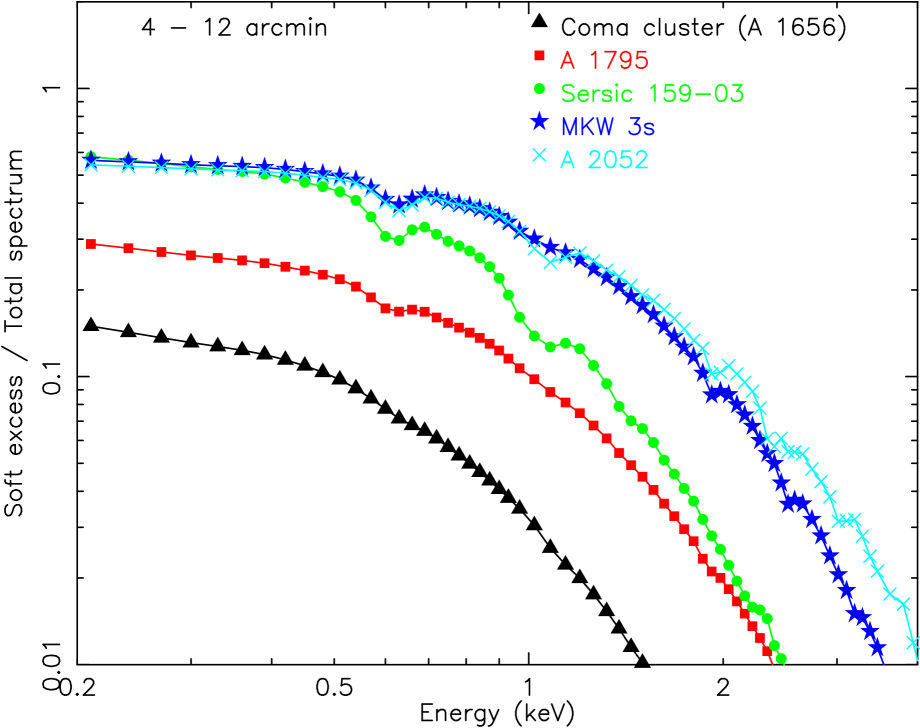
The luminosity-weighted photon indices as well as the total luminosity of the soft excess integrated over all annuli are listed in Table 5. It is evident that the power law component contains a significant fraction of the total luminosity of the cluster, in particular at large radii. This is illustrated in Figs. 15 and 16, where we show the fraction of the total model spectrum caused by the soft power law component, for the inner parts of the cluster and the outer parts.
Cluster ( W) ( W) Coma 2.2 1.00.3 10.5 A 1795 1.9 4.80.9 19.9 Sérsic 159–03 2.6 1.30.2 4.5 MKW 3s 2.1 1.70.2 4.0 A 2052 2.1 1.20.1 3.0
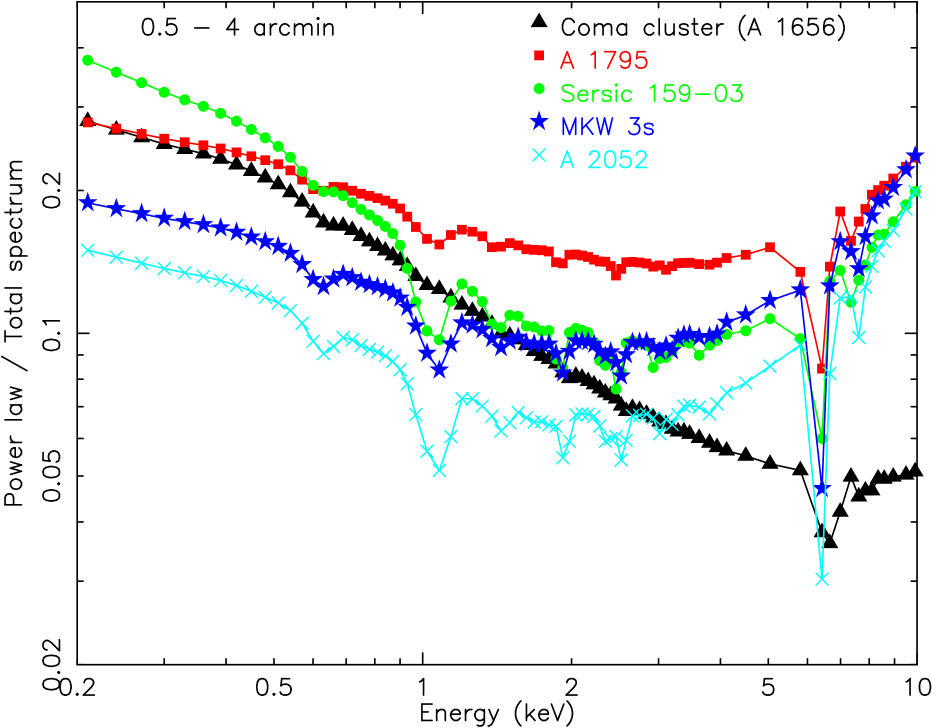
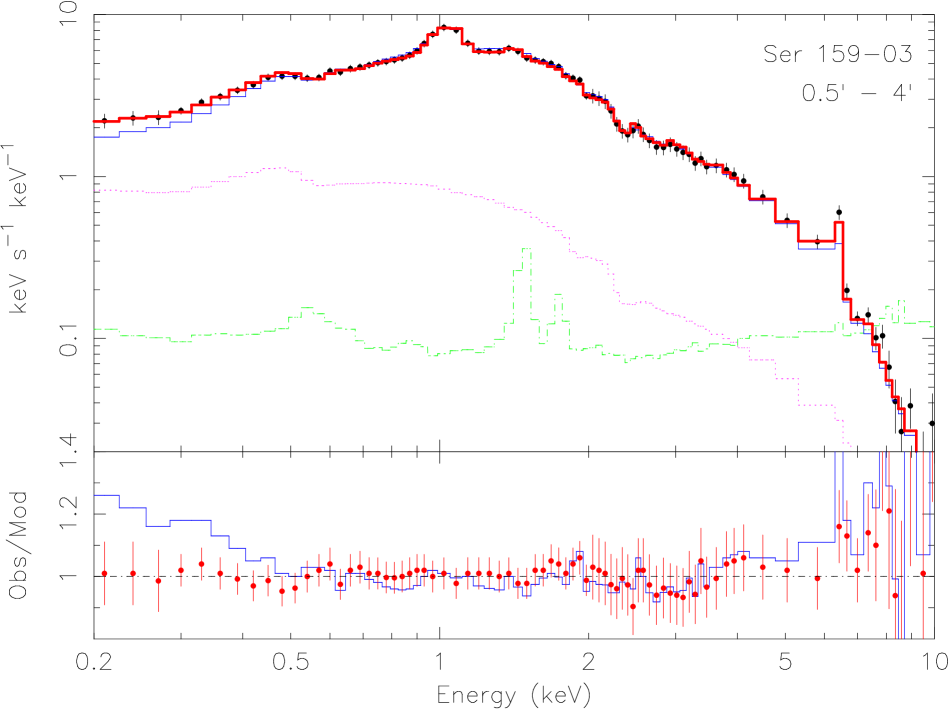
Finally, as a typical example of the quality of the spectral fits, we show in Fig. 17 the fit in the 0.5′–4.0′ range of Sérsic 159–03. It is seen that when the power law component is added, the fit is in particular improved at low energies and at the Fe-K complex near 6.7 keV.
5.2 Thermal emission from warm cluster plasma
An alternative interpretation of the soft excess is that it originates from a thermal warm plasma accounting for a fair fraction of the missing baryons in the present epoch, with temperature distinctly lower than that of the virialized intracluster medium, as discussed in section 1. We tested this possibility by adding a third, thermal emission component to the original model, with the abundances coupled to the abundances of the hotter cluster plasma. In the outer annuli of MKW 3s and A 2052 this provides a statistically better fit as compared with a power law soft excess. In this case, the soft component only contributes with the spectrum below 1 keV (Figs. 18 and 19), contrary to the power law model that dominates the spectrum at large radii for almost all energies (Figs. 15 and 16).
In all the five clusters, the best-fit temperature does not vary significantly as a function of radius. The average values for each cluster are given in Table 6. In all these clusters, the temperature of the soft excess is close to 0.2 keV.
Cluster k (keV) ( m-3) ( m-3) Coma 0.1870.011 9 63 A 1795 0.2000.008 17 138 Sérsic 159–03 0.1800.006 16 42 MKW 3s 0.2300.012 7.8 36 A 2052 0.2080.007 6.9 27
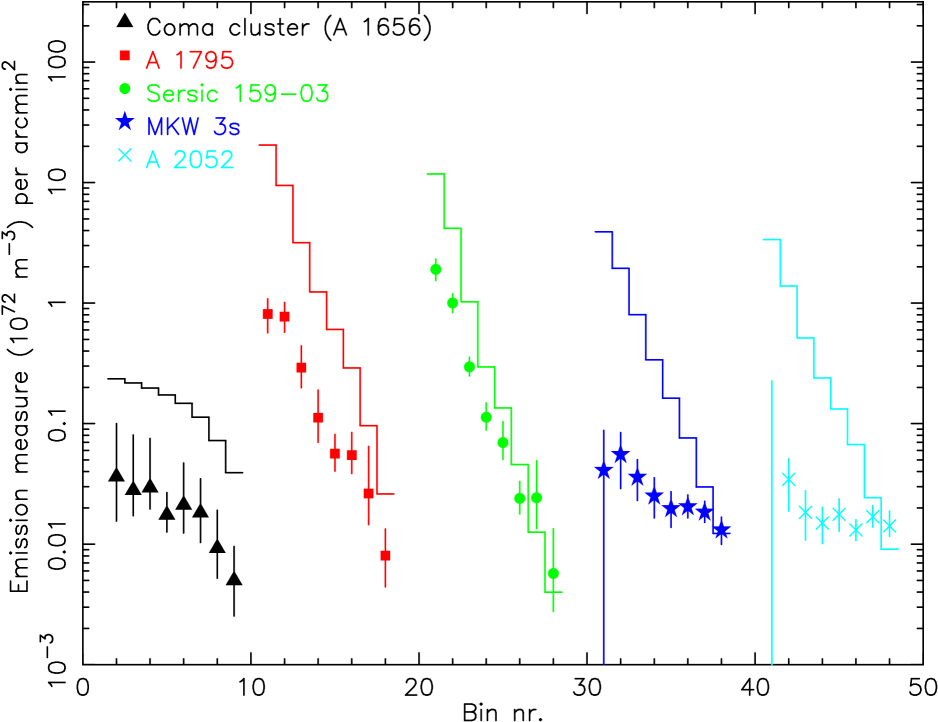
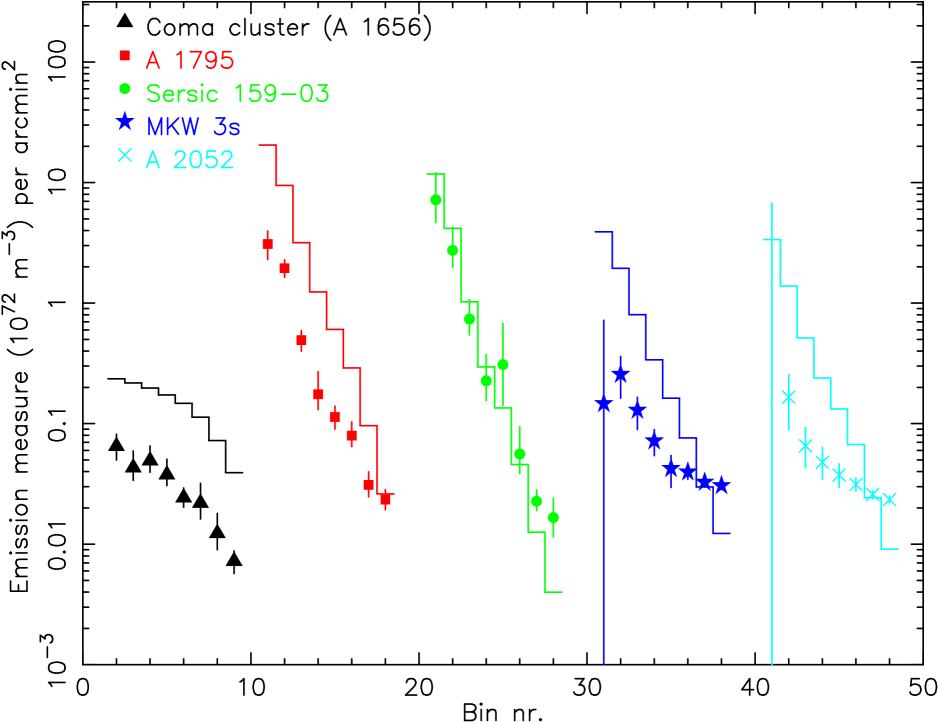
The radial distribution of the emission measure of the soft excess is shown in Fig. 20, together with the emission measure of the hot gas (both temperature components of the hot component added together). The data are plotted as a surface brightness. For Coma, the emission measure of the soft excess is almost a constant fraction of the emission measure of the hot gas, while for A 1795 and Sérsic 159–03 it increases slowly with radius as compared with the hot gas. The same holds for MKW 3s and A 2052, but in both cases the surface brightness of the soft component is more or less constant within the error bars.
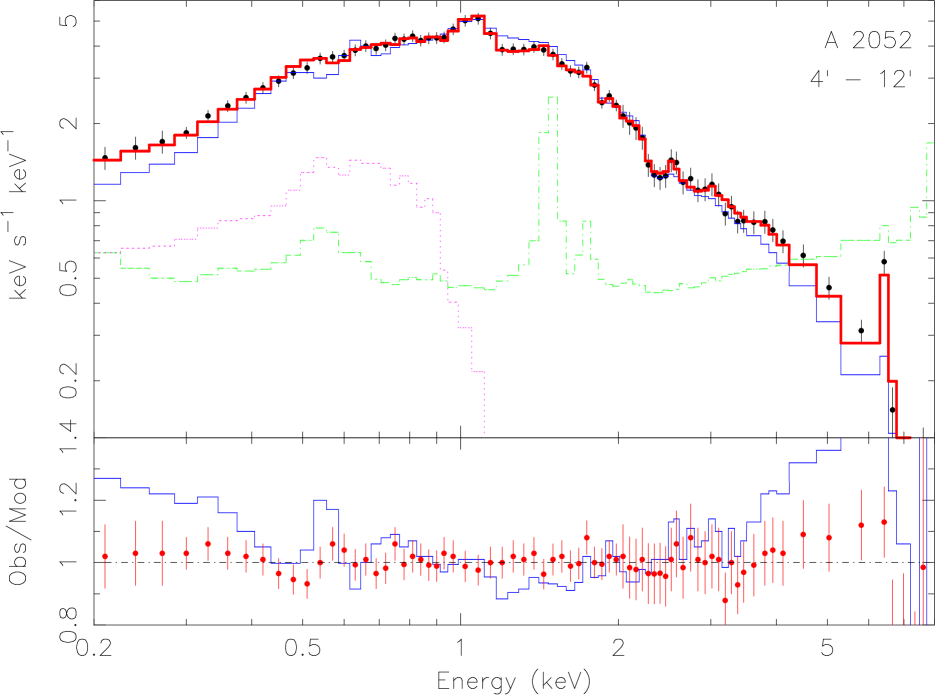
Again, as a typical example of the quality of the spectral fits, we show in Fig. 21 the fit in the 4′–12′ range of A 2052. It is seen that when the third, warm thermal component is added, the fit improves for several energies, including the low- and high energy tail, but also for the region between 0.5–2 keV.
5.3 Thermal emission from warm gas with zero metallicity
Instead of a thermal plasma with cluster abundances, we consider here a model for the soft excess consisting of warm gas with zero metallicity (a pure H/He mixture). This could apply if for example the soft excess is caused by fresh, not enriched material falling into the cluster. Now the soft component contributes to a larger range of the spectrum as compared with the model with cluster abundances: significant excess emission is produced below 2 keV (Figs. 22 and 23).
Again, in all the five clusters, the best-fit temperature does not vary significantly as a function of radius. The average values for each cluster are given in Table 7. The temperatures for most clusters except Sérsic 159–03 are larger than in the case with cluster abundances for the soft excess. Also the emission measures are larger.
Cluster k (keV) ( m-3) ( m-3) Coma 0.500.09 11 63 A 1795 0.690.12 31 138 Sérsic 159–03 0.190.04 39 42 MKW 3s 0.730.04 17.1 36 A 2052 0.610.05 12.9 27
The radial distribution of the emission measure of the soft excess is shown in Fig. 24, similar to Fig. 20 for the case of a soft excess with cluster abundances. Qualitatively the same remarks can be made as for that model (see previous section). However, contrary to the model with cluster abundances, the present model fails to explain the strong O vii line emission near 0.57 keV.
6 Discussion
We have studied here the presence and properties of a soft X-ray excess in a sample of 14 clusters of galaxies. Four of these clusters appear to have larger absorption column densities than the column densities derived from 21 cm observations. In the remaining sample of 10 clusters, four show no direct proof of significant excess emission. The assessment of this absence is mainly limited by the remaining small calibration uncertainties in the instrument response. One of the clusters (A 1835) is very compact, with a strong cooling flow, making it hard to constrain a true soft excess.
In five clusters we have found evidence for a significant soft excess, stronger than the uncertainties in calibration or background subtraction. We discuss those cases in the next section. Here we conclude with a remark on our multi temperature modeling. Almost all of the studied clusters are cooling flow systems where cooler thermal emission is expected in addition to the emission from hotter gas, particularly for the central regions. Based both upon our modeling of RGS and EPIC spectra of several clusters (see Sect. 3.1), as well as extensive spectral simulations done by us, it is noted that because cooling flow does not appear to continue below temperatures 1/3 that of the hot virial plasma and does not produce any significant O vii line emission, in our attempt to model cluster cores it is sufficient to treat the emission measures of both components as free parameters under the only constraint of . This lower bound temperature for the cooling flow emission (typically between one and a few keV) is also much higher than the characteristic temperature (0.2 keV) of the soft excess.
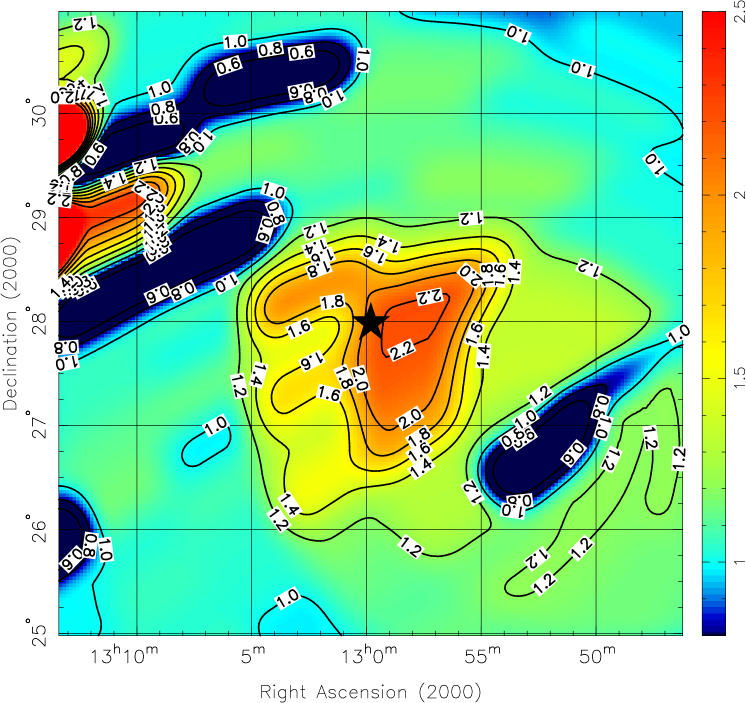
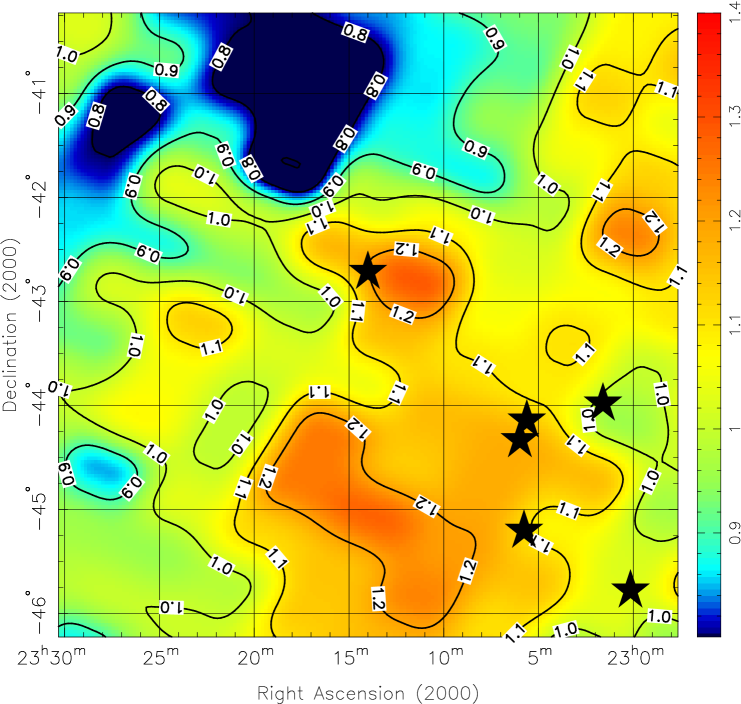
6.1 MKW 3s and A 2052
Both clusters are close to each other on the sky (1.5° distance) as well as in redshift (MKW 3s: 0.0455; A 2052: 0.0356), at a distance of about 60 Mpc. Apparently they are located in a region of the sky with enhanced soft X-ray emission distributed over an area of several degrees width, as is evidenced by the PSPC maps (Fig. 12; Table 4). The flux of the soft component as measured with ROSAT matches the flux of the soft excess as measured here with XMM-Newton (Fig. 8). Our spectral fits, in particular in the outer parts of the cluster, where the soft excess is relatively strong, indicated that a thermal plasma model with cluster metallicity provides a better spectral fit than a power law component. The temperature of the soft component of about 0.2 keV matches the temperature of the ”hard distant component” in the four component decomposition of the high Galactic latitude modeling by Kuntz & Snowden (kuntz (2000)) mentioned earlier. This hard component – averaged over the sky – contributes about 7 % to the total 0.2–0.3 keV photon number flux. Since the diffuse soft X-ray emission in this region of the sky is about 37 % larger than on average, we conclude that in this region this hard distant component is apparently 6 times brighter than on average.
Kuntz & Snowden (kuntz (2000)) attribute this component in general to a Galactic corona. However, in a later paper (Kuntz et al. kuntz2 (2001)) it is shown that the PSPC data are not inconsistent with the hypothesis that a major fraction of this hard component originates from the Warm-Hot Intergalactic Medium (WHIM). The PSPC data simply lack sufficient spectral resolution to discriminate between both possible origins for this component. Therefore we conclude that at least a part of it may be due to localized diffuse emission from the (supercluster) region. This extragalactic origin is also indicated by the presence of redshifted O vii emission (Sect. 3.4).
Is it possible that a large part of the enhanced 1/4 keV enhancement in this region of the sky is caused by emission from filaments between clusters? In order to answer this question, we have investigated the distribution of galaxies and clusters in this region of the sky. Galaxies were taken from the Updated Zwicky Catalog (Falco et al. falco (1999)); this catalog is an almost complete catalog of galaxies up to a limiting magnitude of 15.5. In the present field, the redshift distribution is approximately bimodal, with two strong peaks near redshifts of 0.035 (the redshift of A 2052) and 0.045 (the redshift of MKW 3s). There are very few foreground or background galaxies catalogued in this region. Galaxies of both redshift groups are found around the location of both A 2052 and MKW 3s, so that it looks as if two layers of galaxies are superimposed. Both clusters are part of the southern tip of the Hercules supercluster, which contains at least 12 Abell clusters and stretches NE-wards over a distance of at least 30° (Einasto et al. einasto (2001)). In Fig. 12 we also plot the locations of the Abell clusters of this Hercules supercluster in the area surrounding MKW 3s and A 2052. The local enhancement of the 1/4 keV background near these two clusters coincides with this subconcentration of Abell clusters, which further strengthens the case for an extragalactic origin of the measured soft excess in these two clusters.
It is interesting to note that Bonemente et al. (bonamente2002 (2002)) found soft excesses using PSPC data in several clusters after subtracting a background measured in a region outside the main cluster emission, yet a region which is now found to be within the WHIM emitting radius. The presence of a soft excess in the data of Bonemente et al. can be explained by an enhancement of the WHIM towards the cluster as compared with the background region of Bonamente et al. (due to enhanced filament density towards the connecting node of the filaments, i.e. the cluster).
Finally, we note that beyond the radius where the soft excess in both clusters becomes significant (at about 4′ radius or 300 kpc distance), the ambient temperature of the hot cluster gas also starts decreasing significantly. This temperature drop is similar to what is observed in Sérsic 159–03 (Kaastra et al. kaastra2001 (2001) and next section).
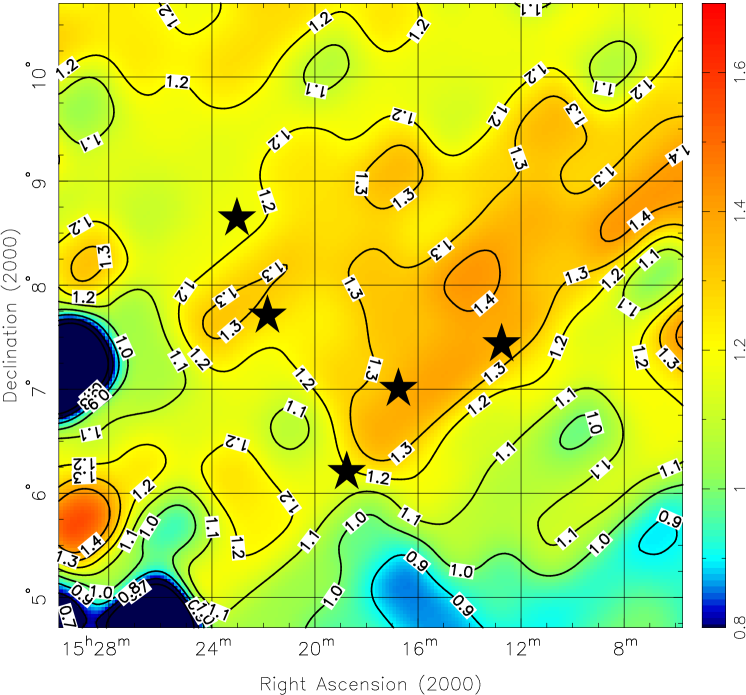
6.2 Sérsic 159–03
A soft excess has been reported for this cluster previously by Bonamente et al. (2001d ), based upon ROSAT PSPC data.
As we have shown in the previous section, this cluster also shows evidence for O vii emission from the soft excess component, probably from extragalactic origin. A small supercluster (SCL 206) consisting of A 3952, A 3969, A 3970 and A 3972 (Einasto et al. einasto (2001)) is found about 2° to the SW of the cluster, at a similar or slightly larger redshift than Sérsic 159–03. This region shows also enhanced soft X-ray emission (Fig. 11), but the enhanced region is much larger than this supercluster.
In A 2052 and MKW 3s the soft excess has approximately a constant surface brightness (Fig. 20), and its flux is consistent with the PSPC 1/4 keV brightness in the region (Fig. 8). Sérsic 159–03 has a similar component as is evidenced by the relative increase of the soft excess at large radii, consistent with the PSPC brightness (Fig. 8). However, in addition there is a component with a 15 % contribution in the central part. This component decreases in surface brightness for larger radii, more or less similar to the brightness decrease of the hot gas (Fig. 20).
The increase of the soft excess in Sérsic 159–03 at large radii can thus be ascribed to the same large scale soft X-ray component as in the other two clusters, but the central enhancement cannot be explained this way. In fact, the fit residuals for the two temperature model show no significant O vii feature in Sérsic 159–03 within a radius of 4′, but the low energy soft excess continuum is present and strong (Fig. 7). In fact, a power law model for the soft excess gives a somewhat better fit than a thermal spectrum for these innermost radii.
We will now focus our attention on the soft excess in the inner parts of this cluster.
6.2.1 Warm intracluster gas
We consider first the case that the warm gas coexists with the hot gas inside the cluster. As is shown in Fig. 20, the emission measure of the warm gas is typically a quarter of the emission measure of the hot gas. We assume here pressure equilibrium between both media. For a central temperature of 2.4 keV and a central hydrogen density of m-3 (Kaastra et al. kaastra2001 (2001)), the warm gas at 0.2 keV temperature must have an overdensity of a factor of 10 and a spatial filling factor of 0.2 %. Such dense, relatively cool gas would however cool down very rapidly, on a time scale of year. On the other hand, if the warm gas is contained in magnetic pressure dominated loops that are in pressure equilibrium with the hot gas, the gas pressure in the warm loops may be much smaller, resulting in a lower gas density and hence a longer cooling time. Such magnetic loops could be similar to the loops advocated by Norman & Meiksin (norman (1996)). In their model, magnetic reconnection of cooler loops with hotter loops that are coupled to the hot intracluster gas causes effectively the cooling rate to decrease by an order of magnitude. A strongly reduced cooling rate is indeed observed in Sérsic 159–03 (Kaastra et al. kaastra2001 (2001)) and almost all our cooling flow clusters (Peterson et al. peterson2002 (2002)). However, in these clusters the amount of gas with temperatures below a few times the hot gas temperature is very small, and it is hard to imagine why there should be little cooling gas present at temperatures of 0.8 keV, but large amounts around 0.2 keV.
6.2.2 Nonthermal radiation due to magnetic reconnection
Another possibility is of course that the soft excess is due to nonthermal radiation caused by the reconnection of such magnetized loops. In the central 4′ of Sérsic 159–03 the 0.2–10 keV luminosity of the soft excess is about a quarter of the luminosity of the cooling gas (the coolest of the two hot temperature components in our spectral fit). Therefore the acceleration mechanism causing the putative nonthermal emission will have to be efficient. A full investigation of the implications for a reconnection model is out of the scope of this paper, however.
6.2.3 Inverse Compton scattering
Inverse Compton scattering as a possible mechanism for the production of a soft excess was discussed in section 1. However, in the case of Sérsic 159–03 this model leads to a very large pressure of the cosmic ray electrons, as already demonstrated by Bonamente et al. (2001d ). The pressure can be several times the gas pressure.
6.2.4 Warm intercluster gas
Another possible explanation for the central soft excess is that it is due to thermal emission from warm gas that is located outside the cluster, for example in the form of warm filaments seen in projection in front of or behind the cluster. The decreasing surface brightness of the soft excess emission then implies that these filaments are probably oriented along the line of sight, towards the direction to the cluster center. If this warm gas is associated with structures in the galaxy distribution, then we should see a large amount of foreground or background galaxies superimposed on Sérsic 159–03. Unfortunately the available redshift data near this cluster region are very sparse: in fact, the cD galaxy of Sérsic 159–03, ESO 291–9, is the only galaxy with a measured redshift within 16′ from the cluster center.
The emission measure of the soft excess is m-3 (Table 6). For a cylindrical filament with a radius of 4′ (400 kpc) and a density of 1000 m-3 (the hot gas density in Sérsic 159–03 at a radius of 4′, cf. Kaastra et al. kaastra2001 (2001)), seen in projection in front of the cluster, the implied column length is 1 Mpc. It scales proportional to . These dimensions are representative of warm filaments (e.g. Cen & Ostriker cen1999 (1999)). Previous detections of similar filamentary structures with Mpc sizes were based upon correlations between low surface brightness X-ray structures as seen with the PSPC and galaxy count overdensities (Wang et al. wang (1997); Kull & Böhringer (kull (1999); Scharf et al. scharf (2000)).
It is quite natural to expect that the filament density increases towards the nodes (clusters); since the X-ray emissivity scales proportional to density squared, the soft X-ray excess will be biased towards the densest regions close to the cluster; this is for example contrary to absorption line studies of these filaments, where the scaling is proportional to density (not squared). Given the uncertain density and temperature structure of the filaments (at least as can be derived from the present data) we do not attempt to derive detailed mass profiles here.
6.3 A 1795
A 1795 is a member of the Bootes supercluster (Einasto et al. einasto (2001)). The region shown in Fig. 10 forms the Western boundary of this supercluster, which has a diameter of about 11°. A 1795 is the X-ray brightest cluster of this supercluster, its direct neighbours A 1775 and A 1800 are a factor of 5–6 fainter, while all other supercluster members are even fainter than these last two clusters.
In A 1795, most of the soft excess emission, in particular at large radii, is consistent with the enhanced soft X-ray background found with the ROSAT PSPC (Figs. 8 and 10). The location of A 1795 near the boundary of a region of enhanced soft X-ray emission, as well as the indication of a weak redshifted O vii line are suggestive for a similar origin of warm intercluster gas as found in MKW 3s, A 2052 and Coma. However, more evidence is needed to prove the case for A 1795. Remarkably, the soft excess as measured with EUVE (Mittaz et al. mittaz98 (1998)) is much stronger than we find here using our XMM-Newton data. This may indicate a very soft X-ray spectrum, since EUVE has more sensitivity in the EUV band as compared with XMM-Newton.
6.4 Coma
The Coma cluster is one of the first clusters where a soft excess has been reported (Lieu et al. 1996b ). In our present study of the central part of Coma we find a soft X-ray excess of about 10 %, almost constant in surface brightness. Most of the soft X-ray emission in the Coma cluster is likely to be due to the cluster itself, as Fig. 9 shows that the local soft X-ray enhancement is centered around Coma. Note that Bonamente et al. (bonamente2002 (2002)) using PSPC data obtained a 20 % excess in the overlapping region. The discrepancy can be understood because of the different spectral sensitivity as a function of energy for the PSPC as compared to EPIC; also, at low energies the spectral redistribution function of both instruments has strong low energy tails. Therefore comparing fractional excesses in count rates from different instruments is not very helpful.
Our spectral fits are not able to discriminate between the different spectral models for the soft excess. However, there is a big difference between the models with a power law and warm thermal cluster gas. For the power law model, the derived oxygen abundance of the cluster is about 0.48 times solar, while for the warm gas scenario the oxygen abundance is 0.07 times solar. In both cases, the best fit iron abundance is about 0.26–0.29 times solar. The low oxygen abundance in the warm gas scenario is driven by the absence of strong O vii emission in the central part of the Coma cluster, in combination with the excess continuum emission below 0.6 keV. Unfortunately it is not well possible to derive firm conclusions on the preferred soft excess model from the measured oxygen abundance. RGS spectra of most of the clusters of our sample yield oxygen abundances centered around 0.2–0.4 times solar (Tamura et al. tamura2002 (2002)). This is just between the values implied for both scenarios.
A power law component in Coma was found before using BeppoSAX PDS data (Fusco-Femiano et al. fusco (1999)). Their best fit model yields a photon index of 1.8, with a confidence range of 0.7–3.6. The corresponding 20–80 keV flux was W m-2. In the power law scenario, our best fit model () predicts a 20–80 keV flux of W m-2, a factor of three below the value found by Fusco-Femiano et al. However, if we put at our lower limit of 1.8, we get a hard X-ray flux that matches exactly the BeppoSAX measurements. It should be noted further that the error bars on the photon index of the BeppoSAX spectrum are rather large, and that our current extraction region (radius less than 12′) does not cover the full Coma cluster, so that in our case we might miss a part of the power law flux.
Also, our modeling of a power law in the central parts of Coma are in good agreement with previous EUVE data. We find a power law contribution of 20–30 % percent at 0.2 keV when the power law is included in the model (see Figs. 15 and 16), which is in reasonable agreement with the findings of Bowyer et al. (bowyer1999 (1999)).
Finally, Cheng (cheng (2002)) has argued that about 6 % of the soft excess in the central parts of Coma could be due to emission from individual elliptical galaxies in the cluster. A natural test of this model would be to correlate the soft X-ray emission with the known location of these galaxies. However the signal to noise ratio of our data is insufficient to test this hypothesis quantitatively.
7 Summary and conclusions
We have studied here a sample of 14 clusters of galaxies in a search for excess soft X-ray emission. In five clusters (Coma, A 1795, Sérsic 159–03, MKW 3s and A 2052) we detect excess soft X-ray emission, in four of these clusters (NGC 533, A 496, A 262 and 2A 0335+096) excess absorption is found and in the remaining five clusters no significant soft excess could be detected.
For three of the clusters with excess absorption this excess absorption can be explained by enhanced foreground absorption related to the infrared cirrus. For the remaining cluster the compactness of its core in combination with steep spectral gradients is the likely cause of less reliable fits.
In the five clusters with a detected soft X-ray excess, the strength of the measured excess is well above the remaining calibration uncertainties of XMM-Newton.
In at least three of these clusters (MKW 3s, A 2052 and Sérsic 159–03) we have firm evidence for the presence of extended emission (on an angular scale of several degrees) due to warm gas of temperature 0.2 keV. This extended emission is also seen in maps of the ROSAT PSPC 1/4 keV band. The surface brightness of this spectral component on a cluster scale (within 12′ radius) is more or less constant. The thermal nature of this component is supported by the detection of the unresolved O vii triplet at the redshift of the cluster. We attribute this component to emission from the warm intercluster medium. Interestingly, in all these three clusters the ambient hot cluster temperature drops rapidly in the region where the soft excess becomes dominant. Apparently we see here a smooth(ed) transition between the warm intercluster medium and the hot intracluster medium.
In the other two clusters the same process can explain the soft excess emission, although in the Coma cluster a power law model also gives a satisfactory fit, and is consistent with the measured hard X-ray spectrum of this cluster.
Finally, in Sérsic 159–03 there is an additional soft component that peaks near the center of the cluster. From the X-ray spectrum it is not fully possible to distinguish different scenario’s for this central component. Possible scenario’s include non-thermal X-ray radiation related to magnetic reconnection, and thermal X-ray emission due to filaments filled with warm gas and oriented along the line of sight towards the cluster.
Acknowledgements.
We thank J.A.M. Bleeker for allowing to use his Guaranteed Time data for this analysis. We thank H. Böhringer for allowing to use the NGC 533 data for this study. We thank an anonymous referee for helpfull remarks on the manuscript. This work is based on observations obtained with XMM-Newton, an ESA science mission with instruments and contributions directly funded by ESA Member States and the USA (NASA). SRON is supported financially by NWO, the Netherlands Organization for Scientific Research.References
- (1) Anders, E., & Grevesse, N. 1989, Geochim. Cosmochim. Acta 53, 197
- (2) Arabadjis J.S. & Bregman, J.N. 1999, ApJ 514, 607
- (3) Arnaud, M., Aghanim, N., Gastaud, R., et al. 2001, A&A 365, L67
- (4) Böhringer, H., Belsole, E., Kennea, J., et al. 2001, A&A 365, L181
- (5) Bonamente, M., Lieu, R., Nevalainen, J., & Kaastra, J.S. 2001a, ApJ, 552, L7
- (6) Bonamente, M., Lieu, R., & Mittaz, J.P.D. 2001b, ApJ, 547, L7
- (7) Bonamente, M., Lieu, R., & Mittaz, J.P.D. 2001d, ApJL 561, L63
- (8) Bonamente, M., Lieu, R., Joy, M.K., & Nevalainen, J. 2002, ApJ, in press.
- (9) Bowyer, S., Berghöfer, T.W., & Korpela, E.J. 1999, ApJ, 526, 592
- (10) Briel, U.G., Dennerl, K., Freyberg, M.J., et al. 2002, in New Visions of the X-ray Universe in the XMM-Newton and Chandra Era, ed. F.A. Jansen, ESA, in press
- (11) Cen, R., & Ostriker, J.P. 1999, ApJ, 514, 1
- (12) Cheng, L.-M. 2002, PASJ 54, 153
- (13) David, L.P., Jones, C., & Forman, W. 1996, ApJ 473, 692
- (14) Dickey, J.M., & Lockman, F.J. 1990, Ann. Rev. A&A 28, 215
- (15) Durret, F., Slezak, E., Lieu, R., Dos Santos, S., & Bonamente, M. 2002, A&A, in press
- (16) Einasto, M., Einasto, J., Tago, E., Müller, V., & Andernach, H. 2001, AJ, 122, 2222
- (17) Ensslin, T.A., & Biermann, P.L. 1998 A&A 330, 90
- (18) Fabian, A.C. 1997, Science, 275, 48
- (19) Falco, E.E., Kurtz, M.J., Geller, M.J., et al. 1999, PASP, 111, 438
- (20) Ferrando, P., Abbey, A.F., Altieri, B., et al. 2002, in New Visions of the X-ray Universe in the XMM-Newton and Chandra Era, ed. F.A. Jansen, ESA, in press
- (21) Fusco-Femiano, R., dal Fiume, D., Feretti, L., et al. 1999, ApJL 513, L21
- (22) Heinz, S., Choi, Y.-Y., Reynolds, C.S., & Begelman, M.C. 2002, ApJL 569, L79
- (23) Hwang, C.-Y. 1997, Science, 275, 48
- (24) Irwin, J.A., & Sarazin, C.L. 1995, ApJ, 455, 497
- (25) Kaastra, J.S., Ferrigno, C., Tamura, T., et al. 2001, A&A 365, L99
- (26) Kaastra, J.S., Mewe, R., & Raassen, A.J.J. 2002a, in New Visions of the X-ray Universe in the XMM-Newton and Chandra Era, ed. F.A. Jansen, ESA, in press
- (27) Kaastra, J.S., Tamura, T., Peterson, J.R., et al., 2002b, A&A, in preparation
- (28) Kull, A., & Böhringer, H. 1999, A&A 341, 23
- (29) Kuntz, K.D., & Snowden, S.L. 2000, ApJ, 543, 195
- (30) Kuntz, K.D., Snowden, S.L., & Mushotzky, R.F. 2001, ApJL 548, L119
- (31) Lieu, R., Mittaz, J.P.D., Bowyer, S., et al. 1996a, ApJ, 458, L5
- (32) Lieu, R., Mittaz, J.P.D., Bowyer, S., et al. 1996b, Science 274, 1335
- (33) Lieu, R., Bonamente, M., Mittaz, J., et al. 1999a, ApJ, 527, L77
- (34) Lieu, R., Ip W.-I., Axford, W.I. & Bonamente, M. 1999b, ApJ, 510, L25
- (35) Lockman, F.J., & Savage, B.D. 1995, ApJS 97, 1
- (36) Lumb, D.H., Warwick, R.S., Page, M., De Luca, A. 2002, A&A 389, 93
- (37) McCarthy, I.G., West, M.J., Welch, & G.A. 2002, ApJ 567, 762
- (38) Mittaz, J.P.D., Lieu, R., & Lockman, F.J. 1998, ApJL 498, L17
- (39) Morrison, R., & McCammon, D. 1983, ApJ 270, 119
- (40) Norman, C., & Meiksin, A. 1996, ApJ 468, 97
- (41) Peterson, J.R., Paerels, F.B.S., Kaastra, J.S. et al. 2001, A&A 365, L104
- (42) Peterson, J.R. et al. 2002, in preparation
- (43) Sarazin, C.L., & Lieu, R. 1998, ApJL 494, L177
- (44) Scharf, C., Donahue, M., Voit, G.M., Rosati, P., & Postman, M. 2000, ApJ 528, L73
- (45) Snowden, S.L., Egger, R., Freyberg, M.J., et al. 1997, ApJ 485, 125
- (46) Snowden, S.L., Freyberg, M.J., Kuntz, K.D., & Sanders, W.T. 2000, ApJS 128, 171
- (47) Strüder, L., Briel, U., Dennerls, K., et al. 2001, A&A 365, L18
- (48) Tamura, T., Kaastra, J.S., Peterson, J.R., et al. 2001, A&A 365, L87
- (49) Tamura, T., Bleeker, J.A.M., Kaastra, J.S., Ferrigno, C., & Molendi, S. 2001, A&A, 379, 107
- (50) Tamura, T., et al. 2002, in preparation.
- (51) Turner, M.J.L., Abbey, A., Arnaud, M., et al. 2001, A&A 365, L27
- (52) Wang, Q.D., Connolly, A.J., & Brunner, R.J. 1997, ApJ 487, L13