High-speed energy-resolved STJ photometry of the eclipsing dwarf nova IY UMa
Abstract
We present high time-resolution photometry of the dwarf nova IY UMa using the S-Cam2 super-conducting tunnel junction device attached to the 4.2m William Herschel Telescope on La Palma. Exploiting the well-defined white dwarf and hot spot eclipse features, we derive an updated orbital ephemeris for IY UMa and an orbital period of 0.07390897(5) days. A white dwarf ingress/egress duration of s along with the contact phases of the bright spot gives and , corresponding to a mass ratio of . The white dwarf eclipse width of then implies . A curious rise with a duration of s is observed in the orbital lightcurves during all three eclipses. It occurs between the end of white dwarf ingress and hot spot ingress and is blue in colour. We suggest that the source of this light lies in the buried part of the gas stream, resulting in a compact, hot impact cavity.
keywords:
binaries: eclipsing — stars: individual (IY UMa) — accretion, accretion discs — novae, cataclysmic variables1 Introduction
Modelling eclipses in binary systems remains one of the most reliable tools for extracting stellar masses and radii. In the semi-detached systems, mass transfer via Roche lobe overflow results in an orbital lightcurve that is often dominated by light from the accretion flow rather than the stellar components. If viewed from sufficiently large orbital inclinations, the shadow cast by the mass donor therefore slices not only across the accreting stellar object, but also probes the extended accretion flow around it.
IY UMa is a member of the cataclysmic variable (CV) subclass of dwarf novae, in which a white dwarf accretes from a late-type donor star in an unstable mass-transfer rate regime. During quiescence, the accretion disc fills up until a global disc instability is triggered and the disc is emptied onto the primary white dwarf during semi-regular and short lived outbursts (e.g. Lasota 2000). The white dwarf has no significant magnetic field in such systems, and the extended accretion disc is the dominant contributor to the optical light. In dwarf novae with short orbital periods, longer and more pronounced super-outbursts can occur in addition to normal outbursts. During such super-outbursts, the tidal torque of the mass donor star causes the large accretion disc to deform and precess, producing prominent light modulations (the superhumps) at a period slightly longer than the orbital period of the binary. Although IY UMa was already reported in 1997 to be a variable star (Takamizawa 1998), its status was only established in January 2000 after a reported brightening. Intensive monitoring of this object revealed a short-period dwarf nova in super-outburst featuring prominent superhumps as well as deep primary eclipses with an orbital period of 1.77 hours (Uemura et al. 2000). Since then, several additional outbursts and super-outbursts have been reported, confirming that IY UMa is one of the few eclipsing dwarf nova systems. Patterson et al. (2000) presented extensive photometry during and after the January 2000 outburst and derived IY UMa’s system parameters using the well-defined eclipse features of the white dwarf and hot spot, while Rolfe et al. (2001) used the superhumps to trace the ellipsoidal shape of the accretion disc.
We obtained high time-resolution photometry of IY UMa using the S-Cam2 superconducting tunnel junction device attached to the 4.2m William Herschel Telescope on La Palma (Rando et al. 2000). This cryogenic detector has both intrinsic energy sensitivity and high precision photon time-tagging, permitting rapid, low-resolution spectroscopy. It is thus ideally suited to the study of eclipse transitions in accreting binaries. It consists of a 6x6 array of tantalum superconducting tunnel junction (STJ) devices, cooled to 0.3 K. The STJ devices - hereafter pixels - have sizes of 25 x 25 m2, corresponding to 0.6 x 0.6 arcsec2. The field of view of the full array is 4 x 4 arcsec2, permitting good background subtraction when the seeing is nominal (). The device has an energy resolving power of 8.5 at 500nm. Photon energies are assigned to pulse-height analyser (PHA) channels in the range 0-255. The effective bandpass - determined by the glass optics, atmospheric absorption, IR filters and the detector’s quantum efficiency - is around 340 to 680 nm, such that useful events fall between channels 60 - 165. The relationship between channel number and photon energy is linear ( 42.5 channels eV), but varies slightly from pixel to pixel. The arrival times of individual photons are logged with an accuracy of 5 s using GPS timing signals. The data acquisition and reduction steps are described in Section 2, with a detailed analysis of the eclipses in Section 3 followed by our conclusions.
2 Data acquisition and reduction
| Obs. No. | UTC interval∗ | Phase coverage |
|---|---|---|
| 1 | 21:50 - 22:30 | 0.78 - 1.15 |
| 2 | 22:31 - 23:11 | 1.16 - 1.53 |
| 3 | 23:18 - 23:38 | 1.60 - 1.79 |
| 4 | 23:39 - 00:19 | 1.79 - 2.17 |
| 5 | 01:26 - 02:07 | 2.80 - 3.18 |
∗Night of April 26/27 2000
We made five S-Cam2 observations of IY UMa on the night of Apr 26/27 2000. The detector was mounted on the Nasmyth focus of the 4.2-m William Herschel telescope on La Palma, with the focussed light fed through a derotator wheel. Throughout the night, atmospheric conditions were good with no cloud cover and stable seeing at 1 arcsec, permitting good background subtraction. Five exposures were made on IY UMa, covering three eclipses (Table 1).
A detailed description of the data reduction procedure for S-Cam2 data is contained in Perryman et al. (2001). The first key step is the shifting of all events onto a common energy/PHA scale, based on a laboratory calibration. After this, the data are split into user-selected energy ranges for the purposes of producing lightcurves in different colour bands. Three energy ranges are selected, with the boundaries between them selected to ensure roughly equal numbers of events in each. For IY UMa, the adopted ranges are channels 1 - 94, 95 - 110 and 111 - 255. Using the nominal relationship between channel number and photon energy, converting from eV to nm, and then allowing for the instrumental bandpass limits, these correspond to three colour bands spanning 325 - 470 nm, 470 - 554 nm and 554 - 643 nm (labelled blue, green and red henceforth). In addition a composite white light band is also produced. In practice - due to the modest resolving power of the instrument - photons of a given energy corresponding to one band have a finite probability of spilling-over into the adjacent one.
The data are also time-binned, corrected for pixel-to-pixel efficiency variations, corrected for atmospheric extinction in a time-dependent fashion, and finally background subtracted. The latter stage employs two corner pixels to obtain an estimate of the mean sky background during a given observation, and is implemented in a time-independent manner. The default width of time bins is 1.0s, appropriate for tracking eclipse transitions in CVs, but much shorter duration bins may be selected if necessary. Finally, the heliocentric corrections to the individual GPS based UTC timings are calculated using the SLALIB software library (Wallace 2001). This allows the calculation of heliocentric Julian dates (HJD) for all time bins, in order to compare the eclipse timings with previously published values.

3 Data analysis
Figure 1 displays the extracted object lightcurve in the three bands as well as a white light lightcurve with a time resolution of 1s. Orbital phases are calculated using the ephemeris that we will derive later in this section. The overall lightcurve shape is very similar to that of other eclipsing dwarf novae such as Z Cha (e.g. Wood et al. 1986). The out of eclipse light curve is characterised by a broad and strong orbital hump, caused by the impact region between the incoming gas stream and the disc edge rotating into view. Typical out-of-eclipse count rates in each energy band are 350 counts s-1, increasing up to 600 counts s-1 during the hot-spot hump. The highly structured eclipse consists of the gradual eclipse of the extended accretion disc as well as sharp features when the compact white dwarf and hot spot region are eclipsed and re-appear. During minimum light, count rates drop to 50 counts s-1 above the background.
The slight mismatch in counts in all three bands between the second and third observations is due to an electronic calibration having been performed on the array, which results in a small shift in the overall gain of the device. This effect does not affect our subsequent analysis.
We estimated the visual out-of-eclipse magnitude of IY UMa to be during our observations based on a comparison of IY UMa’s count rate with those of observed standard stars. The internal variations in the lightcurve scaled as expected from Poisson statistics, indicating that no significant systematic effects were contributing to the variability. Uncertainties on individual data points were thus given by the square-root of the count rate, delivering a typical precision of 0.05 magnitudes per data point in the three color bands.
3.1 Power spectrum
The orbital lightcurves show, apart from the striking eclipse and hot spot features, significant aperiodic flickering in all three colours. Flickering is a common characteristic of accretion and reflects the dominant contribution that the accretion disc light makes to the orbital lightcurve. In order to characterise the flickering behaviour of IY UMa, the eclipse sections ( in terms of phase) were removed. The data were then detrended with an 8th order polynomial in order to remove remaining orbital modulations and isolate the rapid flickering. The white light Fourier power spectrum is displayed in Figure 2. The power spectrum has been rebinned on a logarithmic scale for plotting purposes. The flickering activity exhibits itself as a power-law component with index reaching the Poisson noise level around 0.1 Hz.
We employed different detrending filters to ascertain their effect on the derived flickering properties. This ensured that the power-law index was derived from a frequency range that was not affected by the detrending process. No significant differences were detected between the power spectra of the individual color bands. We also compared the power spectrum of the regions around the bright spot hump (0.6-0.9) with that of the phase interval 0.1-0.6 and found the same flickering power-law. Significant flickering power is thus present on timescales of minutes to hours.
Bruch et al. (1992) documents the flickering properties of several CVs and finds flickering power-laws with a mean index of -2. The flickering indices span a broad range from system to system. And for a given system the flickering index varies significantly between observing epochs. Despite its slightly shallower flickering index, IY UMa’s flickering properties thus appear to be typical for a CV.
There is no evidence for any periodic oscillations, such as the short period (20-30s) dwarf nova oscillations that are ocassionally observed in systems around their outburst (e.g. Steeghs et al 2001) or persistent oscillations such as in the short period dwarf nova WZ Sge. None have been reported for IY UMa so far.

3.2 Eclipse timings
Patterson et al. (2000) were able to identify the white dwarf and hot spot eclipses in their lightcurves towards the end of their campaign as the system approached its quiescent brightness. Although the white dwarf ingress and egress was not well resolved, they estimated its duration to be s. Our adopted time binning of 1s is thus perfectly adequate for resolving these features during primary eclipse.
To illustrate the individual eclipse features, the counts in the three energy bands were added together and the three observed eclipses were averaged in order to derive a mean white light eclipse lightcurve for IY UMa (Figure 3). A smoothed lightcurve was then calculated using a running mean filter with a width of 10s, as well as the numerical derivative of this smoothed lightcurve. The white dwarf eclipse is well resolved and the start and end of both white dwarf ingress (,) and egress (,) were measured for all three eclipses. White dwarf ingress/egress (,) was then calculated as the mid-point between the beginning and end of ingress/egress. As a complimentary measurement of white dwarf ingress/egress, the point at which the derivative is maximal (,) was also determined. The derived white dwarf ingress/egress times when comparing the two methods always agreed to better than 2s, which we use as a conservative error estimate on all individual eclipse timing measurements.
Immediately after white dwarf ingress and before the start of the bright spot ingress, an increase in the count rate is observed for a short duration. Since this curious eclipse feature may influence the start of hot spot ingress, hot spot ingress and egress times were measured instead as the phases of maximum derivative ( and ). Finally, the phase of minimum light was measured for each eclipse (). We could not measure any significant differences between the eclipse timings in the three energy bands, and therefore Table 2 lists all measured timings based on summed white-light lightcurves in order to improve the signal to noise.
| eclipse number: | 1239 | 1240 | 1241 |
|---|---|---|---|
| 2.4244215 | 2.4983506 | 2.5722487 | |
| 2.4247713 | 2.4987550 | 2.5725796 | |
| 2.4245964 | 2.4985528 | 2.5724142 | |
| 2.4291654 | 2.5030394 | 2.5769555 | |
| 2.4294779 | 2.5034435 | 2.5772865 | |
| 2.4293216 | 2.5032414 | 2.5771210 | |
| 2.4246092 | 2.4985483 | 2.5724325 | |
| 2.4293492 | 2.5032415 | 2.5771346 | |
| 2.4257624 | 2.4995868 | 2.5735045 | |
| 2.4332554 | 2.5072813 | 2.5811620 | |
| 2.4278598 | 2.5018623 | 2.5757053 |
all times are HJD - 2451660.0, uncertainty
Our three accurate mid-eclipse times () together with those listed in Patterson et al. (2000) were used to calculate a refined orbital ephemeris for IY UMa;
All eclipse measurements were given equal weight in this ephemeris determination. The figures in brackets denote the error on the last digits. The above ephemeris is used throughout this paper whenever an orbital phase needs to be calculated.
In order to ascertain the reliability of our white dwarf ingress/egress measurements as given in Table 2, we calculated synthetic white dwarf lightcurves using a spherical white dwarf with given linear limb darkening coefficient. The limb of the Roche lobe was evaluated using a three-point approximation (e.g. Wood & Horne 1990). White dwarf eclipse lightcurves were then calculated using variable limb darkening coefficients and ingress/egress phases were measured in the same manner as the data. We thus established that the individual phase measurements are reliable to within 4 seconds, with no measurable systematic offset. We then derived our final mean white dwarf ingress/egress duration of s based on 6 individual measurements. The total white dwarf eclipse duration is s, or 0.0637 in terms of phase. Minimum light occurs seconds after white dwarf conjunction reflecting the distortion caused by the hot spot, while the curious rise in the eclipse after the end of white dwarf ingress reaches its peak seconds later. The duration of white dwarf ingress and egress are indistinguishable, indicating that the white dwarf is fully eclipsed before the rise of the short duration feature commences. We will look into this eclipse feature in more detail in Section 3.4.

3.3 System parameters
We follow the techniques of Wood et al. (1986) and Patterson et al. (2000), and use the measured hot spot ingress/egress phases as a constraint on the binary mass ratio . Predicted hot spot ingress and egress phases were calculated as a function of mass ratio using ballistic stream trajectories in the binary potential, assuming the secondary star is filling its Roche lobe. The distance between white dwarf and the first Lagrangian point is referred to as . Using our three hot spot phases, we find that , while which corresponds to in terms of the binary separation . Our derived mass ratio agrees with, and improves upon, the value derived by Patterson et al. (2000). IY UMa is one of the calibrators for Patterson’s empirical relation between the superhump period excess () and the binary mass ratio (Patterson 2001). We remark that our value for the mass ratio together with the observed period difference between orbital period and superhump period leads to based on IY UMa alone if we assume a linear relation.
Interestingly, our inferred accretion disc size is significantly larger compared to the measured by Patterson et al. (2000) and derived by Stanichev et al. (2001). Their observations took place 1-2 months before our data, and thus closer to the superoutburst that was first reported on January 13, 2000. We estimated the brightness of IY UMa to be during our observations. This is brighter than the reported quiescent V magnitude of , which suggest that another outburst may have occured around the time of our observations. On the other hand, the appearance of the light curve is very much like the quiescent lightcurves reported by Patterson et al. which suggests that our observations would need to be during the later phases of such an outburst. Given the faintess of IY UMa, normal outbursts are easily missed by the variable star networks and it it thus no surprise that not all brightenings are reported. This is precisely the reason why IY UMa, which reaches during super-outburst, was only recently discovered. The occurence of a normal outburst, rather than a super-outburst, in between our time of observations and that of Patterson et al. (2000) could explain the observed disc size. At the start of an outburst, the disc expands rapidly and then gradually shrinks back to its quiescent value. A large disc is thus a tell tale sign of enhanced mass accretion through the disc due to an outburst.
Having established the duration of white dwarf eclipse, we can then exploit the unique relation between , the binary inclination and the white dwarf eclipse duration and derive . Finally, if we assume that the white dwarf radius is given by Eggleton’s mass-radius relationship (Verbunt & Rappaport 1988), we can use the measured white dwarf ingress/egress duration and determine the masses of the stellar components. We then find for the masses of the white dwarf and mass donor star in IY UMa; and . These values are very similar to those of other short period systems such as Z Cha and HT Cas, and as such typical for a short period CV with a mid to late M-type secondary star (Smith & Dhillon 1998 ; Rolfe, Abbott & Haswell 2002).
3.4 The rising eclipse feature

We remarked earlier that the end of white dwarf ingress is followed by a short (s) rise in the lightcurve before the hot spot is eclipsed. This is surprising since more and more of the accretion flow is falling into the shadow of the secondary star which should result in a monotonically decreasing eclipse lightcurve. In order to understand the nature of this lightcurve feature, we illustrate its properties in more detail in Figure 4. The feature is visible in all three observed eclipses and is always most pronounced in the blue band, and weakest in the red lightcurves. This suggests that the source responsible for this feature is compact and hot, with similar colours to the hot spot. Its timing lies exactly between the end of white dwarf ingress () and hot spot ingress (). However, no similar feature is visible between white dwarf and hot spot egress, implying that the source of this additional light is not visible when observed from the opposite direction. This suggests that some feature rotates into view just after the white dwarf is eclipsed, while it is not visible at most other orbital phases. In order to facilitate the interpretation, we modeled the contribution of the white dwarf for each color band and subtracted its light from the orbital lightcurve. To WD flux was assumed to be constant before ingress and after egress and zero during white dwarf eclipse. The lightcurve was then completed by integrating the numerical derivative of the filtered lightcurve during white dwarf ingress and egress (ala Wood et al. 1986). In Figure 5, we plot the mean white dwarf subtracted lightcurves for all colours. The rising feature reveals itself again most notably in the blue band, with an even higher blue-to-green ratio than the bright spot. Its surface brightness needs to be larger than that of the hot inner disc regions since the count rate increases while the inner disc falls in the shadow of the secondary star.

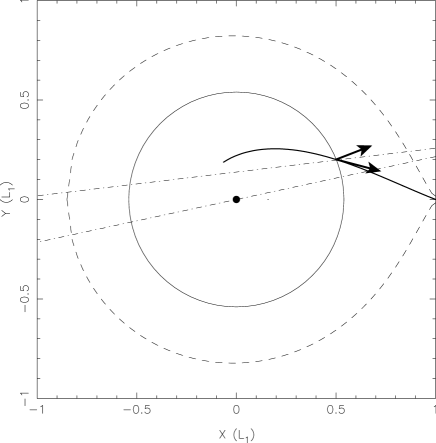
To illustrate the geometry in IY UMa near these orbital phases, we plot in Figure 6 the Roche geometry for the system parameters of IY UMa. The inferred disc size is indicated by the solid circle, and the canonical location of the hot spot is the intersection of the ballistic gas stream trajectory with the disc edge. The path of the secondary star’s shadow is also indicated as it advances between white dwarf ingress and hot spot ingress.
A likely possibility is that the gas stream on impact buries itself (partly) into the disc, creating a narrow, hot impact cavity. If emission is beamed preferentially along the direction of the stream near impact rather than perpendicular to the disc edge, this buried part of the stream would then make a growing contribution to the lightcurve after white dwarf egress as the angle between the stream trajectory and the line of sight continues to decrease (arrows in Fig. 6). The resulting rise in the lightcurve is cut short when the shadow of the secondary covers the stream impact region and the hot spot ingress takes place, explaining the short duration of the feature. This hot cavity along the stream trajectory is also consistent with its blue colour. Since the cavity is buried in the disc, it would only be visible when the line of sight looks into the cavity, and not at opposite orbital phases. This qualitative model can thus explain all the observed features.
No similar feature has been observed in other eclipsing CVs, but the very high binary inclination of IY UMa may be a prerequisite for such line of sight effects to occur. The observable properties of this stream cavity effect depend mainly on how tightly and in what direction the light is beamed. The detailed geometry of the stream impact region is notoriously complex with possible other complications such as stream overflow and a vertically and azimuthally extended hot spot down-stream along the disc edge. Our data suggest that the location of highest dissipation may not be at the disc edge, the classical location of the bright spot, but further into the disc. With more good quality high-speed observations of eclipsing CVs, such models can be more thoroughly tested.
4 Conclusions
We presented high-time resolution photometry of IY UMa covering three of its deep eclipses. The data were obtained months after the January 2000 super-outburst using the S-Cam2 STJ-based detector array. Using the well defined white-dwarf eclipse features, and our high time resolution, we derived an updated orbital ephemeris for this eclipsing dwarf nova system. In conjunction with measurements of the hot spot eclipse phases, we were able to derive accurate system parameters for IY UMa. We found and , corresponding to a mass ratio of . The white dwarf eclipse width of then implies .
The measured disc radius ( ) was considerably larger than the values reported towards the end of the January 2000 super-outburst. This is most likely due to the occurence of a normal outburst just before our observations. The observed count-rates suggest that IY UMa was slightly brighter than its nominal quiescent magnitude, supporting the occurence of a mass accretion rate increase.
A curious short-lived rise in the orbital lightcurve was observed during all three eclipses. It occurs between the end of white dwarf ingress and hot spot ingress and has a blue colour. We suggested that the source of this light lies in the buried part of the gas stream, resulting in a compact, hot impact cavity. The curious line-of-sight effects leading to this lightcurve feature are the result of the very high binary inclination of IY UMa, making it a wonderful system for exploring the complex geometry of the accretion flow in dwarf novae.
Given sufficient time resolution and signal to noise, lightcurve analysis of high inclination systems such as IY UMa are thus an invaluable tool. The future looks bright with the energy resolution of STJ devices significantly improving, and large-aperture telescopes providing sufficient photons to perform high-time resolution spectroscopy.
Acknowledgments
DS is supported by a PPARC Fellowship. The William Herschel telescope is operated on the island of La Palma by the Isaac Newton Group in the Spanish Observatorio del Roque de los Muchachos of the Instituto de Astrofisica de Canarias.
References
- [Kato et al.(2001)] Kato, T., Stubbings, R., Nelson, P., Pearce, A., Garradd, G., & Kiyota, S. 2001, Informational Bulletin on Variable Stars, 5159, 1
- [Lasota(2001)] Lasota, J.-P. 2001, New Astronomy Review, 45, 449
- [Patterson(2001)] Patterson, J. 2001, PASP, 113, 736
- [Patterson et al.(2000)] Patterson, J., Kemp, J., Jensen, L., Vanmunster, T., Skillman, D. R., Martin, B., Fried, R., & Thorstensen, J. R. 2000, PASP, 112, 1567
- [Perryman et al.(2001)] Perryman, M. A. C., Cropper, M., Ramsay, G., Favata, F., Peacock, A., Rando, N., & Reynolds, A. 2001, MNRAS, 324, 899
- [Rando et al.] Rando, N., Verveer J., Verhoeve P., et al. 2000 in Proc. SPIE 4008, Optical and IR Telescope Instrumentation and Detectors, ed. M. Iye & A.F. Moorwood, 4008, 646
- [Rolfe, Abbott, & Haswell(2002)] Rolfe, D. J., Abbott, T. M. C., & Haswell, C. A. 2002, MNRAS, 334, 699
- [Rolfe, Haswell, & Patterson(2001)] Rolfe, D. J., Haswell, C. A., & Patterson, J. 2001, MNRAS, 324, 529
- [Smith & Dhillon(1998)] Smith, D. A. & Dhillon, V. S. 1998, MNRAS, 301, 767
- [Stanishev, Kraicheva, Boffin, & Genkov(2001)] Stanishev, V., Kraicheva, Z., Boffin, H. M. J., & Genkov, V. 2001, A&A, 367, 273
- [Steeghs et al.(2001)] Steeghs, D., O’Brien, K., Horne, K., Gomer, R., & Oke, J. B. 2001, MNRAS, 323, 484
- [tak88] Takamizawa, F., VSNET-OBS circular 18078, Variable Star NETwork, http://www.kuastro.kyoto-u.ac.jp/vsnet
- [Verbunt & Rappaport(1988)] Verbunt, F. & Rappaport, S. 1988, ApJ, 332, 193
- [] Wallace, P.T., 2001, SLALIB Positional Astronomy Library, Starlink User Note 67, Starlink project, Rutherford Appleton Laboratory
- [woodhorne] Wood, J., Horne, K., MNRAS, 242, 606
- [Wood et al.(1986)] Wood, J., Horne, K., Berriman, G., Wade, R., O’Donoghue, D., & Warner, B. 1986, MNRAS, 219, 629
- [Wu, Li, Gao, & Leung(2001)] Wu, X., Li, Z., Gao, W., & Leung, K. 2001, ApJL, 549, L81
- [Uemura et al.(2000)] Uemura, M. et al. 2000, PASJ, 52, L9