Stellar population gradients in Seyfert 2 galaxies. Northern sample
Abstract
We use high signal-to-noise ratio long-slit spectra in the 3600-4700 Å range of the twenty brightest northern Seyfert 2 galaxies to study the variation of the stellar population properties as a function of distance from the nucleus. In order to characterize the stellar population and other continuum sources (e.g. featureless continuum FC) we have measured equivalent widths Ws of six absorption features, four continuum colours and their radial variations, and performed spectral population synthesis as a function of distance from the nucleus. About half the sample has CaIIK and G-band W values smaller at the nucleus than at 1 kpc from it, due to a younger population and/or FC. The stellar population synthesis shows that, while at the nucleus, 75 per cent of the galaxies present contribution 20 per cent of ages 100 Myr and/or of a FC, this proportion decreases to 45 per cent at 3 kpc. In particular, 55 per cent of the galaxies have contribution 10 per cent of the 3 Myr/FC component (a degenerate component in which one cannot separate what is due to a FC or to a 3 Myr stellar population) at the nucleus, but only 25 per cent of them have this contribution at 3 kpc. As reference, the stellar population of 10 non-Seyfert galaxies, spanning the Hubble types of the Seyfert (from S0 to Sc) was also studied. A comparison between the stellar population of the Seyferts and that of the non-Seyferts shows systematic differences: the contribution of ages younger than 1 Gyr is in most cases larger in the Seyfert galaxies than in non-Seyferts, not only at the nucleus but up to 1 kpc from it.
keywords:
galaxies: stellar content – galaxies: active – galaxies: SeyfertStellar population gradients in Seyfert 2 galaxies
1 Introduction
The relation between recent star-formation and nuclear activity in galaxies has been the subject of a number of recent studies. Cid Fernandes & Terlevich (1995) were the first to argue that the blue continuum in Seyfert 2 galaxies was rather mostly due to the contribution of young stars than to a scattered featureless continuum (FC), if the hypotheses of Unified Models for Seyfert galaxies were correct (Antonucci 1993). Heckman et al. (1995) reached similar conclusions using a different method. Heckman et al. (1997) and González Delgado et al. (1998) have proved this to be the case for a few Seyfert 2 galaxies with available UV spectra with enough signal-to-noise ratio to show the wind lines of young O and B stars. González Delgado et al. (1998) have also shown that, in these cases, high-order Balmer lines in absorption, characteristic of young and intermediate age stars ( 100 Myr), were also present in the spectra. As optical spectra are more easily available, the high-order Balmer lines could thus be used as unambiguous signatures of the presence of young to intermediate age stars.
In Cid Fernandes, Storchi-Bergmann & Schmitt (1998), Storchi-Bergmann, Cid Fernandes & Schmitt (1998) and Schmitt, Storchi-Bergmann & Cid Fernandes (1999), we used long-slit spectra of about 40 AGNs to measure absorption line and continuum spectral features within a few kiloparsecs from the nucleus, to characterize the stellar population. For the 20 Seyfert 2 galaxies of the sample, we have then performed spectral synthesis of the nuclear spectra, having concluded that the main common characteristic was an excess of an intermediate age stellar population (100 Myr) when compared to early-type non-Seyfert galaxies.
Storchi-Bergmann et al. (2000) used stellar population templates to investigate the effect of combining an old bulge population (present in most Seyferts) with a younger one, in particular to investigate the detectability of the high-order Balmer lines as signatures of the young and intermediate age stars. By comparing the models with the data, we concluded that unambiguous signatures of such stars were present in only 30 per cent of the sample. We have also concluded that is not possible to distinguish a stellar population younger than 10 Myr from a power-law continuum, when these components contribute with less than 40 per cent of the light at 4020Å.
Combining the above results with the stellar population analysis performed by González Delgado et al. (2001) for a northern sample of 20 Seyfert 2 galaxies, we conclude that 40 per cent of nearby Seyfert 2 galaxies present unambiguous signatures of recent episodes of star-formation in the nuclear region. In another 30 per cent, a blue component is also necessary to reproduce the near-UV continuum, but its faintness precludes a firm identification, and this component can either be due to a FC or a stellar population younger than 10 Myr, or both. Joguet et al. (2001), studying the circumnuclear stellar population of the host galaxies of 79 Seyfert 2 nuclei also found high-order Balmer lines seen in absorption in many cases, concluding that young stellar populations are present in around 50 per cent of Seyfert 2 nuclei, a rate similar to that found by us.
In Cid Fernandes et al. (2001b) and Storchi-Bergmann et al. (2001) we have looked for relations between the age of the stellar population in the nuclear region and the host galaxy properties and environment. We have found that the AGNs with largest contributions of recent star-formation occur in galaxies with the largest IR luminosities; these galaxies are frequently in interactions and present distorted inner morphologies. An evolutionary scenario was suggested, in which the interactions trigger both the nuclear activity and bursts of star formation. The bursts then fade before the nuclear activity, which is thus found also in galaxies with old stellar populations.
In the near-IR, Oliva et al. (1999) studied stellar absorption lines in 13 obscured AGNs and 8 genuine Seyfert 1’s and found that the presence of powerful starbursts in obscured AGNs is relatively common while they are not present in Seyfert 1’s.
In more luminous objects, Aretxaga et al. (2000) found young stellar populations in the nuclear regions of some nearby radio-galaxies, as well as Tadhunter et al. (2002) for intermediate redshift ones. Canalizo & Stockton (2001) studied a sample of low-redshift QSOs that may be in a transitionary stage between ULIGs and QSOs and found that every object shows strong recent star-forming activity (younger than 300 Myr) and in many cases this activity is closely related to tidal interactions.
A number of questions are nevertheless still open regarding the hosts of AGNs, and one of fundamental nature is if there are any systematic differences between the hosts of AGNs and non-active galaxies of the same Hubble type. In other words: does the onset of nuclear activity relate to large-scale properties of the host galaxies? In the evolutionary scenario described above, for example, if interactions are responsible for triggering the activity and circumnuclear bursts of star formation, wouldn’t the more external regions also be affected?
In order to answer the above questions we now extend the study of the stellar population to the extranuclear regions of Seyfert galaxies. As a first step towards this goal, in Raimann et al. (2001, hereafter R01) we have analysed the nuclear and extranuclear stellar population of 3 early-type (Hubble type S0) non-Seyfert, 2 LINER and 3 Seyfert 2 galaxies as a function of distance from the nucleus. While we found a common behaviour for non-Seyfert galaxies and LINERs, this is not true for the 3 Seyferts, and a larger sample is needed to characterize the stellar population gradients in Seyferts. We have thus decided to extend this study to the samples of Storchi-Bergmann et al. (2000, called southern sample) and González Delgado et al. (2001, called northern sample), which comprise 25 Seyfert 2 galaxies with plus 10 with . This sample can be considered as representative of nearby Seyfert 2 galaxies. The common selection criterion for all the galaxies is a lower limit for the luminosity of the central source, such that the luminosity in the [OIII]5007 line is L ergs s-1. As it was not selected by any property related to the stellar population, it is suitable to explore this property.
As the spectra of the northern and southern samples cover distinct wavelength ranges, we have performed the two studies separately. In this work we analyse the northern sample and in a future work the southern one. We first quantify the radial variations of the equivalent widths and continuum fluxes as a function of distance from the nucleus, used to measure the dilution of the bulge absorption lines by an FC or young stellar population at the nucleus. Then we use these measurements to perform spectral synthesis and derive the stellar population properties and gradients.
This paper is organized as follows. In Section 2 we describe the sample galaxies and the observations. In Section 3 we discuss the spatial variation of the equivalent widths and continuum. We present the spectral synthesis results in Section 4 and, in Section 5, the discussion and in Section 6 the conclusions of this work.
2 Sample and Observations
| Name | Type | v (km/s) | 1 arcsec (pc) | E(B-V)G |
|---|---|---|---|---|
| Mrk1 | S | 4780 | 310 | 0.060 |
| Mrk3 | S0: | 4050 | 260 | 0.188 |
| Mrk34 | S: | 15150 | 980 | 0.009 |
| Mrk78 | SB | 11145 | 720 | 0.035 |
| Mrk273 | Ring. Gal pec | 11334 | 730 | 0.008 |
| Mrk348 | SA(s)0/a: | 4540 | 290 | 0.067 |
| Mrk463E | S pec | 14904 | 960 | 0.030 |
| Mrk477 | S | 11340 | 730 | 0.011 |
| Mrk533 | SA(r)bc pec | 8713 | 563 | 0.059 |
| Mrk573 | SAB(rs)0+: | 5174 | 335 | 0.023 |
| Mrk1066 | SB(s)0+ | 3605 | 235 | 0.132 |
| Mrk1073 | SB(s)b | 6991 | 450 | 0.160 |
| NGC1068 | SA(rs)b | 1136 | 75 | 0.034 |
| NGC1386 | SB(s)0+ | 924 | 60 | 0.012 |
| NGC2110 | SAB0- | 2284 | 150 | 0.375 |
| NGC5135 | SBab | 4112 | 270 | 0.060 |
| NGC5929 | Sab:pec | 2753 | 180 | 0.024 |
| NGC7130 | Sa pec | 4842 | 310 | 0.029 |
| NGC7212 | S | 7994 | 515 | 0.072 |
| IC3639 | SBbc | 3285 | 210 | 0.069 |
| Name | Type | v (km/s) | 1 arcsec (pc) | E(B-V)G |
|---|---|---|---|---|
| NGC1232 | SAB(rs)c | 1500 | 97 | 0.026 |
| NGC1367 | (R’)SAB(r’l)a | 1500 | 97 | 0.024 |
| NGC1425 | SA(rs)b | 1500 | 97 | 0.013 |
| NGC1637 | SAB(rs)c | 600 | 39 | 0.040 |
| NGC3054 | SAB(r)bc | 2400 | 155 | 0.074 |
| NGC3223 | SA(r)bc | 3000 | 194 | 0.108 |
| NGC3358 | (R’2)SAB(l)ab | 3000 | 194 | 0.055 |
| NGC7049a | SA(s)0 | 2231 | 116 | 0.007 |
a Observed by Raimann et al. (2001).
Detailed information about the observations and reductions of the long-slit spectra of the northern sample can be found in González Delgado et al. (2001). It comprises the brightest 20 Seyfert 2 galaxies from the compilation of Whittle (1992a,b). The radial velocities range from 1000 km/s to 15000 km/s but only five objects have radial velocities 9000 km/s. The value mean is 4811 km/s, what gives a mean spatial scale of 310 pc/arcsec. In Table 1 we list the morphological type, radial velocity, spatial scale (using H0 = 75 km s-1 Mpc-1) and foreground galactic E(B-V)G values. The data were extracted from the NASA/IPAC Extragalactic Database (NED)111The NASA/IPAC Extragalactic Database (NED) is operated by the Jet Propulsion Laboratory, California Institute of Technology, under contract with the National Aeronautics and Space Administration..
Long-slit spectra of these galaxies have been obtained using the Richey-Chrétien spectrograph at the 4m Mayall telescope of Kitt Peak National Observatory in February and Ocotber 1996. The long-slit spectra used in this work cover the wavelength range 3600 – 4700 Å, at a resolution of 3 Å. Each pixel at the detector corresponds to 0.7 arcsec in the sky. A slit width corresponding to 1.5 arcsec on the sky was oriented along the parallactic angle except for NGC1068 on which it was oriented at P.A.=123∘. For two galaxies, NGC5929 and Mrk477, we have two position angles, P.A.=60,80 and P.A.=44,158 respectively.
One-dimensional spectra were extracted in windows of 2.1 arcsec in the bright nuclear regions and progressively larger windows towards the fainter outer regions. The spectra were dereddened according to foreground galactic E(B-V)G. The spatial coverage ranged between 3 (for Mrk34) and 50 arcsec (NGC1068) from the nucleus. The signal-to-noise (S/N) ratio of the extracted spectra ranges between 10 and 40.
In order to compare the stellar population of these active galaxies with that of non-active ones of the same Hubble type, we have also obtained long-slit spectra of nearby non-Seyfert galaxies with morphological types between Sa and Sc. We used the R-C Cassegrain Spectrograph at the 1.5m telescope of Cerro Tololo Interamerican Observatory in January 2002 (Table 2). Due to the proximity of these galaxies the nuclear spectrum was extracted in a window of 3 arcsec, in order to allow a similar sampling at the galaxy to that of the Seyferts. Extranuclear spectra were extracted up to about 8 arcsec from the nucleus. The spectra were dereddened according to foreground galactic E(B-V)G. In addition, to represent the S0 Hubble type, we use the data from the S0 non-Seyfert galaxy NGC7049 (see bottom of Table 2), already presented in R01, which is representative of the 3 S0 galaxies studied in that paper.
Because the number of non-Seyfert galaxies is still small, we use as additional reference the study of Bica (1988, hereafter B88), in which he performed stellar population synthesis for about 100 non-Seyfert galaxies, using integrated spectra from regions of about 1 kpc 1 kpc. B88 grouped the galaxies spectra in six templates, called S1 to S6. The templates S1 and S2 are dominated by galaxies with Hubble types Sa, the templates S3 and S4 by Sb’s and the templates S5 and S6 by Sc’s.
3 Radial variation of the equivalent widths and continuum colours
The variation of the equivalent widths (Ws) of absorption lines and the continuum colours as a function of distance from the nucleus allows the study of stellar population gradients in the galaxy. Usually, in non-active galaxies, the Ws increase from the external regions towards the bulge, where they remain approximately constant. The presence of a burst of star-formation and/or a featureless AGN continuum will produce a “dilution” of the absorption lines, whose Ws will then decrease at the nucleus when compared to the values at adjacent locations (Cid Fernandes et al. 1998).
In order to study the run of the stellar absorption features with distance from the nucleus we determined a pseudo-continuum at selected pivot-points and measured the Ws of six absorption features as described in R01. Due to the shorter spectral range of the present work the pivot points used here for the continuum were 3660, 3780, 4020 and 4510 Å and the absorption features for which we measured the Ws were: Wwlb (a blend of weak lines in the near-UV, within the spectral window 3810-3822 Å), H9 (a blend of absorption lines which includes H9, 3822-3858 Å), CaIIK (3908-3952 Å), CaIIH+H (3952-3988 Å), CN-band (4150-4214 Å) and G-band (4284-4318 Å).


In Figs. 1-3 we present the above Ws, continuum colour F4510/F4020 (hereafter ) and surface brightness as a function of the angular distance from the nucleus for the Seyfert 2 galaxy sample. The typical errors are 0.5Å for Wwlb, H9, CaIIK, CaIIH+H and G-band, 1.0Å for the CN-band and 0.05 for the continuum ratio (Cid Fernandes et al. 1998). The dotted and dashed vertical lines mark distances at each galaxy of 1 kpc and 3 kpc from the nucleus, respectively. The measurements for Mrk463 are not presented here because this data is already shown in R01. We also do not show the data for Mrk78 because it has only one extranuclear spectrum to each side. We present data for just one position angle of Mrk477 and NGC5929 because the other p.a.’s show similar behavious. Measurements of CaIIK and G-band Ws for some of these objects were showed in González Delgado et al. (2001) but they are different from those showed here due to a different pseudo-continuum adopted. As five galaxies of the present sample are also in the sample of Cid Fernandes et al. (1998), we can compare our measurements with theirs in order to check the robustness of on method. We point out that the measurements in the above paper were obtained with a different instrument and along different position angles, although using the same technique. Nevertheless, a careful comparison shows that the W values for the same feature are remarkably similar, usually within the measurement errors.
In Fig. 4 we show the same quantities for the non-Seyfert S0 galaxy NGC7049, first presented in R01. For the non-Seyfert Sa to Sc galaxies, it was only possible to obtain signal-to-noise ratios high enough for reliable measurements for the nucleus and usually a couple of extractions to each side of the nucleus. The corresponding values are summarized below.
The range of nuclear Ws obtained for Seyfert 2 galaxies is 0W3.5Å, 0W11Å, 2W15.5Å, 0W9Å, 2.5W14Å and 1W9.5Å. While the nuclear values for the S0 are W6Å, W20Å, 18W20Å, 12W14Å, 17W19Å and W11Å, those of the Sa to Sc are 1W4Å, 6W15Å, 7W18Å, 8W13Å, 3W13Å and 4W10Å. The non-Seyfert Sa to Sc galaxies thus present nuclear W values considerably smaller than that of the non-Seyfert S0, but the radial variations show a similar trend.
Almost all Seyfert 2s have some gas emission in the nuclear lines H9 and CaIIH+H, and sometimes this emission is present in the extranuclear spectra too. Mrk463E and Mrk477 are examples of objects dominated by extended gas emission. Therefore, almost all Seyfert 2 galaxies have these lines with smaller Ws in and near the nucleus.
In non-Seyfert S0 galaxies most Ws have the largest values at the nucleus, decreasing outwards (e.g., Fig. 4). Two Seyferts, Mrk348 and IC3639, present a similar trend, with Ws increasing towards the nucleus, although at the nucleus proper they show a sudden decrease. If we focus our attention in the behaviour of WCaIIK and G-band, the lines with the smallest measurement errors, we realize that about half the sample (galaxies listed in Table 3) have these nuclear Ws smaller than the extranuclear ones. This behaviour is probably due to dilution of the bulge stellar population by a blue continuum which can either be due to a FC component or a young stellar population, or both.
We estimate the fraction of the continuum associated with the above blue component at the wavelength of an absorption line as:
| (1) |
where and are the Ws at the nucleus and outside, respectively (Cid Fernandes et al. 1998).
| Name | f() [per cent] | |
|---|---|---|
| CaIIK | G-band | |
| Mrk1 | 1313 | 1713 |
| Mrk3 | 106 | 181 |
| Mrk463E | 556 | 704 |
| Mrk477 | 4512 | 662 |
| Mrk533 | 551 | 545 |
| Mrk1066 | 403 | 411 |
| NGC1068a | 356 | 302 |
| NGC2110 | 53 | 124 |
| NGC5135 | 446 | 363 |
| NGC7130 | 464 | 366 |
| NGC7212 | 31 | 104 |
a Relative to 5 arcsec (375 pc) from the nucleus.
In Table 3 we show the dilutions of the nuclear CaIIK and G-band. These dilutions are measurements of the contribution of a FC or a younger population at the nucleus, as compared to that at 1 kpc. The uncertainties listed in the Table are measurements of the difference between the dilution factors obtained using the two extranuclear extractions at opposite sides of the nucleus. In the remaining Seyferts there is no obvious dilution, nor a systematic variation with the distance similar to that observed for the S0 galaxy.
Regarding the continuum, two galaxies (Mrk78 and IC3639) have the nuclear redder than the extranuclear ones similarly to those of the non-Seyfert early-type galaxies. Four others have the nuclear continuum bluer than that of the extranuclear region (Mrk1066, Mrk477, NGC5135 and NGC7130) and in the remainder (14 galaxies) the behaviour is not symmetrical relative to the nucleus. This is likely due to a non-uniform dust distribution, in agreement with HST images of the inner region of these galaxies, many of which were published by Malkan et al. (1998, their Fig. 2).
3.1 NGC1068
NGC1068 is considered the prototypical Seyfert 2 and it is the brightest galaxy of the sample, allowing a more detailed study of its stellar population, as high signal-to-noise ratio spectra could be extracted up to 50 arcsec (3.7 kpc) from the nucleus, at a spatial sampling of 200 pc.
Neff et al. (1994) showed that this galaxy contains multiple components at UV wavelengths: the central AGN, a population of very luminous starburst knots, a bright oval inner disk and a fainter, more circular halo. The knots are mostly located in two star-formation rings. One at 10 arcsec from the nucleus (750 pc at the galaxy) – the nuclear ring – that includes the most luminous knot and other at 28 arcsec from the nucleus (2.1 kpc) – the inner ring – that includes several luminous knots. Our slit was oriented to cover one luminous knot from each ring, labeled regions C and J by Neff and collaborators.
In Fig. 2 (bottom left panel) we show the Ws, and surface brightness as a function of the angular distance from the nucleus for NGC1068. All Ws show a dip at the nucleus relative to the extranuclear values at 5 arcsec, where the Ws reach the largest values (which are however still smaller than those of the non-Seyfert early-type galaxy at similar location). Beyond 5 arcsec, the Ws decrease, consistent with the presence of star-forming regions along the slit. In particular, at 10 arcsec NW on the nuclear ring, where knot J is located, the Ws decrease to values smaller than those at the nucleus, while to the other side of the ring the Ws are similar to the nuclear ones, suggesting that the stellar population is not as young as in knot J. At the inner ring, the smallest Ws occur at 28 arcsec SE, the location of knot C, and are similar to those of knot J, indicating that at the knots there are younger star-forming regions than at other locations along the ring.
The continuum ratio shows a behaviour consistent with that of the Ws, being bluest close to the regions where the Ws are smallest, except for the nucleus, which has a continuum redder than that at 2 arcsec NW but bluer than that at 2 arcsec SE.
In order to calculate the dilution of the Ws at the nucleus, we have compared the nuclear Ws with those from the region at 5 arcsec (375 pc at the galaxy) instead of using 1 kpc, because of the nuclear ring at this latter location. All nuclear Ws are diluted relative to the extranuclear values. H9 and CaIIH+H are contaminated by gas emission, while CaIIK and the G-band are diluted by about 30 per cent. This value is consistent with the known contribution of a FC component (Antonucci, Hurt & Miller 1994).
4 The spectral synthesis
The spectral synthesis was performed using the probabilistic formalism described in Cid Fernandes et al. (2001a). We reproduce the observed Ws and continuum ratios (Cs) using a base of star cluster spectra with different ages and metallicities (Bica & Alloin 1986). We use 12 components representing the age-metallicity plane plus a 13th component representing a cannonical AGN continuum F (Schmitt et al. 1999).
To synthesize the data of this work we have used the Cs 3660/4020 and 4510/4020, and the Ws Wwlb, WH9, WCaIIK, WCN-band and WG-band. The adopted errors were Å for Wwlb, WH9, WCaIIK and WG-band, 1.0Å for WCN-band and for continuum ratios (Cid Fernandes et al. 1998). In some cases the synthesis was performed with a smaller number of Ws, due to the contamination by emission lines.
It is important to keep in mind that in this spectral range is not possible to discriminate between the FC and 3 Myr components for flux contributions smaller than 40 per cent at 4020Å, because they have very similar continua (Storchi-Bergmann et al. 2000). Therefore, in the description and discussion of the synthesis results we combine the 3 Myr and FC components in one, the 3 Myr/FC component.
According to Cid Fernandes et al. (2001a), this method of spectral synthesis has also difficulty to accurately determine the contributions of all 12 components of Bica’s base for modest signal-to-noise ratio and/or reduced number of observables. These constraints act primarily in the sense of spreading a strong contribution in one component preferentially among base elements of same age. Thus, in order to produce more robust results we have grouped components of same age.
Due to the fact that the spectral resolution of the Bica & Alloin’s (1986) templates is lower than that of the present galaxy spectra we need to estimate the effect of this difference in the equivalent width measurements, and in the synthesis results. The equivalent widths are weaker in the lower resolution case. Therefore, when we use a base with lower resolution than the data, the contribution of the older and/or more metallic populations are overestimated and the contribution of younger and/or less metallic are underestimated. These effects are nevertheless small in our sample, as explained below.
Smoothing a few spectra down to the resolution of the Bica & Alloin’s templates we have estimated that the differences in the equivalent widths are, in most cases, within the measurement errors (see above). Performing the synthesis with the smoothed spectra, we realized that, on average, the percent contribution to the light at 4020Å of the oldest components 10 Gyr or 1 Gyr becomes 5 per cent smaller while the contribution of the youngest component 3 Myr/FC becomes 5 per cent larger, while E(B-V) becomes on average 0.06 larger. These differences do not affect the conclusions of our work, as can be seen in the following sections, and we thus have opted for keeping the full resolution of our data in the synthesis.
4.1 Synthesis results for the non-Seyfert galaxies
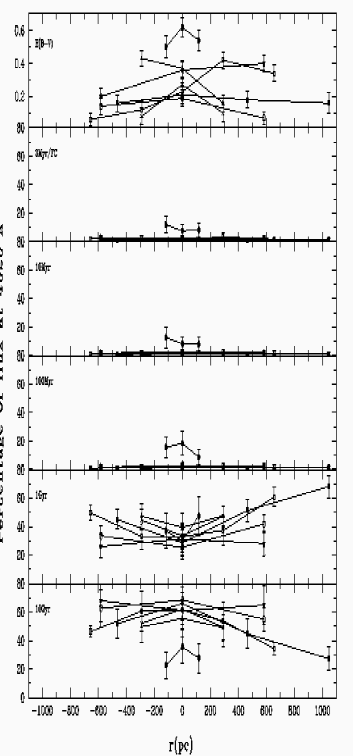
In order to compare our results with those for non-Seyfert galaxies we performed again the spectral synthesis for the non-Seyfert galaxy NGC7049, with the new input parameters specified above in order to verify if there is any change relative to results found in R01. There are no significant differences: the stellar population is dominated by the 10 Gyr metal rich component at the nucleus, with its contribution decreasing beyond 1 kpc, while the contribution of the 1 Gyr component increases outwards. In figure 5 we show the synthesis results for this galaxy. The results are presented as proportions of the flux contributed by each component at 4020 Å and the internal reddening E(B-V)i of the galaxy. The panels show from bottom to top the contribution from: the sum of the four 10 Gyr components; the sum of the three 1 Gyr components; the sum of two 100 Myr components; the sum of the two 10 Myr components; the sum of the 3 Myr component and FC (F). The top panel shows the internal reddening E(B-V)i obtained from the synthesis. At the bottom panel we also show separately, with open symbols, the sum of the two metal poor components. The vertical bars are the standard deviation of the results. The vertical lines crossing all panels mark distances of 1 kpc and 3 kpc from the nucleus.

The results of the synthesis for the Sa-Sc non-Seyfert galaxies are summarized in Fig. 6, where we show the values for all non-Seyferts together, due to the small number of points for each individual galaxy. In order to group the results, we had first to transform the angular distances to linear distances at each galaxy. For most galaxies, the stellar population in the nucleus is composed by 65 per cent of the 10 Gyr component and 30 per cent of the 1 Gyr component. The contribution of the other components are not significant. In six (of seven) galaxies the 10 Gyr component decreases while the 1 Gyr component increases outwards, similarly to the S0 non-Seyfert galaxies behaviour.
A distinct result is found for the Sc galaxy NGC1637 which has recent star formation: at the nucleus the component of 10 Gyr contributes with 35 per cent, that of 1 Gyr with 30 per cent and those younger than 1 Gyr contribute with the remaining 35 per cent of the flux at 4020Å (this galaxy has little information about the stellar population outside the nucleus – only up to 100 pc from the nucleus).
The E(B-V)i for these galaxies range from 0.1 to 0.6 and it is larger than those for S0 galaxies. The largest E(B-V)i is found for NGC1637, the galaxy with recent star formation.
4.2 Synthesis results for the Seyfert 2 galaxies
In order to describe the synthesis results for the Seyfert 2 galaxies, we have grouped the sample in four classes according to their most important nuclear stellar component and describe the main characteristics (or variations) in the populations at the nucleus and outside, using the 1 kpc and 3 kpc (when possible) locations as references. In the following discussion, we consider a population component significant when it contributes with at least 10 per cent of the total flux at 4020Å.
4.2.1 Dominant 10 Gyr metal rich stellar population
In this group are Mrk573, NGC5929, NGC2110, Mrk3, NGC7212, Mrk348 and Mrk34, whose nuclear stellar population is dominated by the 10 Gyr metal rich (with solar or above metalicity) component. The galaxies are sorted above according the importance of the rich component, whose contribution ranges from about 60 per cent of the total flux at 4020Å in Mrk573 to 30 per cent in Mrk34. At the nucleus all these galaxies have a contribution of the 1 Gyr component of at least 15 per cent of the total flux. Some of these objects also have significant nuclear contributions of younger components: Mrk3 with 20 per cent of 3 Myr/FC, Mrk34 with 10 per cent of 10 Myr old and 10 per cent of 3 Myr/FC and NGC7212 with 15 per cent of 3 Myr/FC.
In Figs. 7 and 8 we show the spatial variation of the spectral synthesis results for galaxies of this group. The extranuclear old metal rich component contribution is similar to that of the nucleus in Mrk 3, Mrk 34 and NGC2110, while in the other galaxies this component decreases outwards. The 1 Gyr component increases outwards in all galaxies. The younger components decrease outwards in the galaxies for which they are significant (10 per cent) at the nucleus.


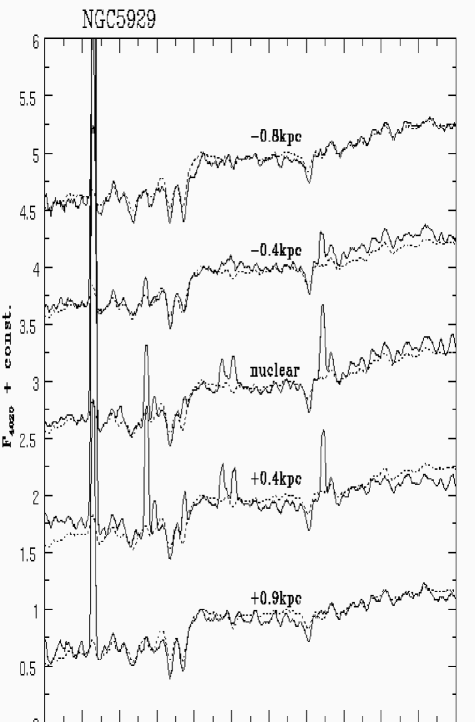
In Fig. 9 we compare the observed spectrum (solid-line) with the synthetic one (dashed-line) for one galaxy of this group (NGC5929) at the nuclear and off-nuclear regions. The synthetic spectra were constructed using the star cluster templates (Bica & Alloin 1986, 1987) combined in the proportions given by the synthesis. The synthetic spectra reproduce well the observed ones, considering the lower spectral resolution of the available templates ( 10-20Å) as compared to the observations ( 3Å).
4.2.2 Dominant 1 Gyr stellar population
The galaxies of this group are Mrk78, NGC1386, IC3639, Mrk1073, NGC1068, Mrk1 and Mrk1066, sorted according to the importance of the nuclear 1 Gyr component. In Mrk78 this component contributes with about 50 per cent of the total flux at 4020Å and in Mrk1066 with about 20 per cent. All of them have a significant nuclear contribution of the 10 Gyr component, and all but NGC1386 also have significant contribution of the components younger than 1 Gyr.


The synthesis results as a function of distance from the nucleus for these galaxies are shown in Figs. 10 and 11. Throughout the central 2 kpc the galaxies Mrk78 and NGC1386 have contributions of the 10 Gyr, 1 Gyr and 100 Myr components similar to those at the nucleus. NGC1386 also has significant contributions of the components 100 Myr old and younger outside the nucleus (at 300 and 660 pc), which is different from the nuclear one.
In Mrk1066 the components of 10 Gyr and 1 Gyr increase and those younger than 1 Gyr decrease outwards, while the population in IC3639 has a completely opposite behaviour.
The population outside the nucleus in Mrk1 has contributions of the 1 Gyr and 100 Myr components similar to those at the nucleus and the contribution of the 10 Gyr component increases while that of the components younger than 100 Myr decreases. In Mrk1073 the components of 10 Gyr and 1 Gyr have similar contributions to those at the nucleus and the contribution of the 100 Myr component increases while that of the components younger than 100 Myr decreases outwards.
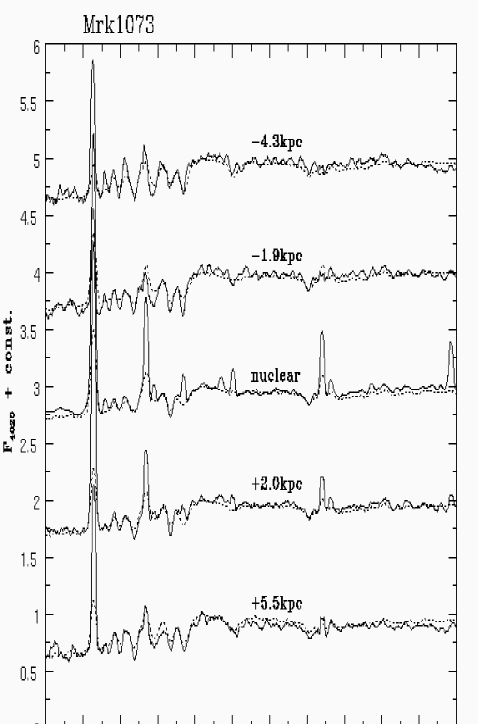
In Fig. 12 we compare the observed spectrum (solid-line) with the synthetic one (dashed-line) for one galaxy of this group (Mrk1073) at the nuclear and off-nuclear regions. All spectra present the high-order Balmer lines in absorption, characteristic of stellar populations younger than 1 Gyr.
4.2.2.1 NGC1068
At the nucleus of this galaxy all components are significant but we would like to highlight the importance of the 3 Myr/FC component. It contributes with about 17 per cent of the total light at 4020Å. This result is consistent with the contribution of polarized light from the hidden Seyfert 1 nucleus (e.g. Antonucci et al. 1994).
Outside the nucleus, all age components continue to be important, contributing with more than 10 per cent to the flux at 4020Å and indicating the presence of recent star-formation throughout the observed region. In particular at knot J (about 750 pc from the nucleus, NW – positive direction) and at knot C (about 2 kpc from the nucleus, SE – negative direction) the 3Myr/FC component is as important as in the nucleus, contributing about 20 and 25 per cent respectively. This result confirms that these are active star-forming regions. From the synthesis, knot C is younger than knot J. At 3 kpc from the the nucleus the 3 Myr/FC component is not significant.
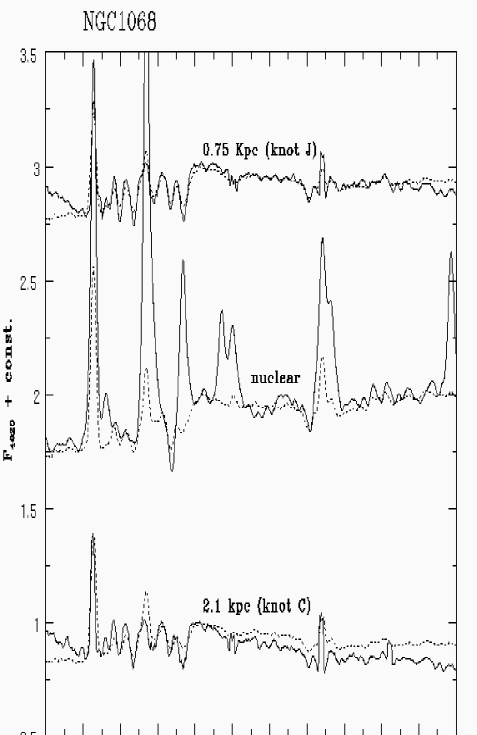
In Fig. 13 we compare the observed spectrum (solid-line) with the synthetic one (dashed-line) for the nucleus and knots C and J.
4.2.3 Dominant 100 Myr stellar population
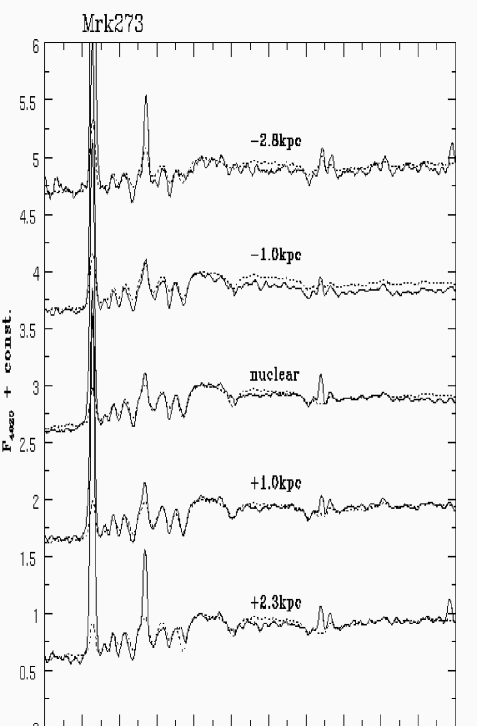
In this group are Mrk273, Mrk533 and NGC7130, for which the 100 Myr component contributes about 30 per cent to the nuclear flux at 4020 Å. The 10 Gyr component contributes with about 20 per cent. The other components also have significant contributions at the nucleus of these galaxies, except 3Myr/FC in Mrk273.


The results of the synthesis for galaxies of this group are shown in Fig.14. Outside the nucleus of NGC7130 the contribution of components with 10 Gyr and 1 Gyr increases while that of the components younger than 100 Myr decreases.
The population of Mrk533 shows large variations in the 10 Gyr, 100 Myr and 3 Myr/FC components in the central 2 kpc. In the central 6 kpc the global tendencies are that the component with 1 Gyr increases and the 100 Myr component decreases outwards, while the 10 Gyr component and the components younger than 100 Myr have contributions similar to those at the nucleus.
In Mrk273 the contributions do not vary significantly across the central 6 kpc.
In Fig. 15 we compare the observed spectrum (solid-line) with the synthetic one (dashed-line) for one galaxy of this group (Mrk273) at the nuclear and off-nuclear regions. All spectra present the high-order Balmer lines in absorption, characteristic of stellar populations younger than 1 Gyr.
4.2.4 Dominant 3 Myr/FC component
Here are Mrk463E, Mrk477 and NGC5135. The 3 Myr/FC component ranges from 40 per cent to 30 per cent contribution to the nuclear flux at 4020 Å. At the nucleus Mrk 463E and Mrk477 also have significant flux contributions of the 10 Gyr, 1 Gyr and 10 Myr populations, about 15 per cent each. Besides those, the 100 Myr component contributes about 15 per cent at the nucleus of the NGC5135.


In Fig. 16 we show the synthesis results for these galaxies as a function of distance from the nucleus. In Mrk477 the contribution of the 3 Myr/FC component decreases and that of the 100 Myr component increases outwards. The other components have contributions similar to those at the nucleus.
Outside the nucleus of Mrk463E the behaviour is not symmetric. At one side (positive direction) the 3 Myr/FC component decreases and the 10 Myr and 100 Myr components increase outwards. At the other side these components have the opposite behaviour.
The stellar population of the galaxy Mrk463E has been studied in R01 although with different spatial sampling, spectral range for the observations and normalization wavelength for the synthesis. It is intersting to compare the results of the present work with those of R01 in order to verify the robustness of our method. This comparison shows a general agreement in the sense that the stellar population is dominated by the young components (100 Myr old). Differences are found in the relative contribution of the 100 and 10 Myr components. Investigating the reason for this difference we conclude it is due to the fact that this galaxy has very small W values and the synthesis is strongly constrained by the continuum, which is affected by calibration uncertainties. Nevertheless, within the scape of the present paper, these differences do not alter our main conclusions.
In NGC5135 the contribution of the components of 10 Gyr and 1 Gyr increases and that of the components younger than 1 Gyr decreases outwards.
In Fig. 17 we compare the observed spectrum (solid-line) with the synthetic one (dashed-line) for one galaxy of this group (Mrk477) at the nuclear and off-nuclear regions. The nuclear spectrum is dominated by gas emission of the AGN narrow line region and the star-forming regions. Outside the emission decreases and we can see the high-order Balmer lines in absorption, characteristic of stellar populations younger than 1 Gyr.

We summarize the synthesis results discussed above in Table 4 which shows the contribution of four age bins: 10 Gyr, 1 Gyr, 100Myr+10Myr and 3Myr/FC to the nuclear and extranuclear spectra (at 1 kpc and 3 kpc from the nucleus) of the sample. The Seyfert 2 galaxies are grouped according to the Hubble type (from top to bottom) in the top part of table: the first group contains the S0 galaxies, the second the Sa-Sb’s, the third the Sbc’s and the fourth the galaxies with uncertain morphological type. In the bottom part of table are those for the non-Seyfert galaxies. For these galaxies, due to the smaller signal-to-noise ratio of the 1.5m observations, we could only reach distances at the galaxies somewhat smaller than 1 kpc. In order to allow a comparison with the Seyfert data we decided to show the results for the synthesis at 1 kpc from the nucleus, obtained by extrapolation from the extranuclear spectra. We did the extrapolation based on the hypothesis that the stellar population varies smoothly with the distance from the nucleus, like in the S0 non-Seyfert galaxies studied in R01. This seems to be a reasonable assumption, if one compares Fig.5 with Fig.6, which show similar behaviour of the stellar population gradients for the S0 and later Hubble types. The extrapolated values are shown between parenthesis in Table 4.
E(B-V)i values are found throughout the observed region in the range E(B-V). The large E(B-V)i variations present in almost all Seyfert 2 galaxies are likely due to a non-uniform dust distribution (Malkan et al. 1998).
| Name | 10 Gyr | 1 Gyr | 10010Myr | 3Myr/FC | ||||||||
|---|---|---|---|---|---|---|---|---|---|---|---|---|
| Nuclear | 1 kpc | 3 kpc | Nuclear | 1 kpc | 3 kpc | Nuclear | 1 kpc | 3 kpc | Nuclear | 1 kpc | 3 kpc | |
| S0 Seyfert 2 | ||||||||||||
| Mrk3 | 50 | 56 | – | 20 | 37 | – | 10 | 5 | – | 20 | 2 | – |
| Mrk348 | 60 | 49 | – | 20 | 35 | – | 12 | 10 | – | 8 | 6 | – |
| Mrk573 | 65 | 60 | – | 21 | 29 | – | 10 | 7 | – | 4 | 4 | – |
| Mrk1066 | 24 | 33 | – | 23 | 40 | – | 36 | 17 | – | 17 | 6 | – |
| NGC1386 | 48 | 50 | – | 42 | 38 | – | 7 | 4 | – | 3 | 8 | – |
| NGC2110 | 53 | 50 | – | 32 | 43 | – | 10 | 4 | – | 5 | 3 | – |
| Sa-Sb Seyfert 2 | ||||||||||||
| Mrk1073 | 21 | 39 | 26 | 31 | 25 | 30 | 32 | 22 | 36 | 16 | 14 | 8 |
| NGC1068 | 29 | 25 | 43 | 26 | 26 | 26 | 28 | 31 | 24 | 17 | 18 | 7 |
| NGC5135 | 16 | 24 | 45 | 20 | 29 | 31 | 34 | 31 | 18 | 30 | 16 | 6 |
| NGC5929 | 61 | 53 | – | 27 | 34 | – | 8 | 9 | – | 4 | 4 | – |
| NGC7130 | 19 | 29 | 25 | 14 | 23 | 26 | 48 | 36 | 38 | 19 | 12 | 11 |
| Sbc Seyfert 2 | ||||||||||||
| Mrk533 | 26 | 23 | 18 | 19 | 22 | 40 | 41 | 18 | 28 | 14 | 37 | 14 |
| IC3639 | 36 | 26 | 17 | 31 | 30 | 23 | 24 | 30 | 36 | 9 | 14 | 24 |
| S Seyfert 2 | ||||||||||||
| Mrk1 | 28 | 33 | 64 | 22 | 34 | 17 | 30 | 27 | 15 | 20 | 6 | 4 |
| Mrk34 | 45 | 40 | 37 | 29 | 37 | 45 | 16 | 12 | 12 | 10 | 11 | 6 |
| Mrk78 | 24 | 27 | – | 51 | 48 | – | 21 | 20 | – | 4 | 5 | – |
| Mrk273 | 19 | 18 | 23 | 29 | 33 | 38 | 44 | 41 | 32 | 8 | 8 | 7 |
| Mrk463E | 24 | 19 | 15 | 15 | 17 | 20 | 20 | 28 | 46 | 41 | 36 | 19 |
| Mrk477 | 17 | 15 | 18 | 16 | 16 | 29 | 26 | 36 | 36 | 41 | 33 | 17 |
| NGC7212 | 57 | 55 | 48 | 16 | 18 | 40 | 12 | 9 | 8 | 15 | 18 | 4 |
| Non-Seyfert Sa-Sb | ||||||||||||
| NGC1367 | 61 | (40) | – | 33 | (55) | – | 4 | (4) | – | 2 | (1) | – |
| NGC1425 | 62 | (25) | – | 34 | (75) | – | 3 | (0) | – | 1 | (0) | – |
| NGC3358 | 61 | (70) | – | 31 | (25) | – | 5 | (3) | – | 3 | (2) | – |
| Non-Seyfert Sbc | ||||||||||||
| NGC3054 | 66 | (30) | – | 29 | (70) | – | 3 | (0) | – | 2 | (0) | – |
| NGC3223 | 69 | (55) | – | 26 | (45) | – | 4 | (0) | – | 1 | (0) | – |
| Non-Seyfert Sc | ||||||||||||
| NGC1232 | 56 | (38) | – | 40 | (62) | – | 4 | (0) | – | 1 | (0) | – |
| NGC1637 | 35 | – | – | 30 | – | – | 27 | – | – | 8 | – | – |
5 Discussion
From the synthesis results, the main characteristics of the stellar population of the present Seyfert 2 sample are:
a) At the nucleus 75 per cent of the sample (15 galaxies) have contribution of ages 100 Myr (or/and FC) larger than 20 per cent. This result is in agreement with those of Schmitt et al. (1999), Storchi-Bergmann et al. (2000) and González Delgado et al. (2001), who found that in 40 per cent of nearby Seyfert 2 galaxies there are clear signatures of young stars and in another 30 per cent there is a blue continuum which can be either due to a FC or a stellar population younger than 10 Myr. 55 per cent (11 galaxies), have significant ( 10 per cent) 3 Myr/FC component at the nucleus.
b) At 1kpc from the nucleus, 70 per cent of the sample have contribution of ages 100 Myr (or/and FC) larger than 20 per cent and 50 per cent have a significant 3 Myr/FC component.
c) At 3 kpc, 45 per cent of the sample have contribution of ages 100 Myr (or/and FC) larger than 20 per cent and 25 per cent have a significant 3 Myr/FC population.
d) The contribution of the 1 Gyr component increases outwards from the nucleus in 13 galaxies while the old metal rich component decreases in 7 galaxies. This behaviour was also found in S0 non-Seyfert galaxies studied by R01.
e) The contribution of old metal poor component is significant in 17 galaxies of the sample.
The latter result was also found in R01 and in that work we hypothesized that this contribution, larger than that found in non-Seyfert S0 galaxies, could be an effect of degeneracy between the old metal poor component and the 3 Myr/FC component. In order to verify if this effect is important we repeated the spectral synthesis excluding the metal poor components. We show in Fig.18 the results of the synthesis without these components (crosses) as compared with the synthesis using all components (filled dots), for two extreme cases: Mrk348 and IC3639.
In Mrk348, in the new synthesis, the missing contribution of the metal poor components is shared among all other younger components and the only significant change is in the 10 Gyr population which decreases in about 15 per cent of the total flux at 4020Å. In the other extreme case of IC3639, while the old population decreases about 20 per cent, the 100 Myr component increases about 10 per cent in the new synthesis. The remaining 10 per cent is shared among the other components.
We thus conclude that such possible degeneracy effects are not large in the synthesis. In addition, although the 10 Gyr metal poor component presents a small contribution in S0’s, B88 shows that this component is larger in later-type galaxies, and we would thus need to compare the results for the Seyferts with those of non-Seyfert galaxies of the same Hubble type, considering that, besides 7 S0/Sa’s, the present sample comprises 4 Sab/Sb’s and 2 Sbc’s, and 7 galaxies with uncertain morphology.


5.1 Comparison with synthesis results for non-active galaxies
A comparison of the Seyfert 2 stellar population properties and their radial variations with those of non-active galaxies of the same Hubble type is necessary in order to search for systematic differences in the Seyfert sample, which could be related to the AGN phenomenon.
In Table 4 we summarize the individual synthesis results for the Seyfert 2 and non-Seyfert galaxies and in Table 5 we show the corresponding average results for each Hubble type, including also those for the three non-Seyfert S0 galaxies from R01 and the reference sample of B88 (in this latter case we show the integrated results from apertures of 1 kpc1 kpc).
Presently, we have three S0 non-Seyfert galaxies studied with the same method applied to the present Seyfert 2 sample, large spatial coverage (up to 3 kpc from the nucleus) and typical sampling regions at the galaxy of 200 pc. For Hubble types later than S0, we have the seven non-Seyfert galaxies studied in this work, with a more restrict spatial coverage and a similar typical sampling. In order to compare the results for these Sa to Sc galaxies with those for the active ones, we had to extrapolate the stellar population synthesis to 1 kpc using the nuclear and available extranuclear spectra.
Because the number of non-Seyfert galaxies is reduced we also use as reference the study of B88. We have performed the spectral synthesis of the templates using the same Ws and Cs used for our sample. The synthesis results were then averaged in order to obtain the “typical” population of each Hubble type Sa, Sb and Sc. As the dimensions of the regions studied by B88 are much larger than those corresponding to our nuclear extractions, we need to take into account both the nuclear and extranuclear synthesis results from our Seyfert 2 sample in the comparison with the non-Seyfert galaxies.
Comparing the synthesis results for the Seyferts with those for non-Seyferts of the same Hubble type we realize that, at the nucleus, the contribution of the 10 Gyr component is smaller in Seyfert 2 galaxies than in non-Seyfert galaxies in eleven (of the thirteen, which have Hubble types from S0 to Sbc) of them. The component with 1 Gyr is similar in Seyfert 2 and non-Seyfert galaxies in four objects, larger in five Sy2 and smaller in four. In terms of average values (for each Hubble type) the 1 Gyr contribution is larger for S0 Sy2, and comparable to that of non-Seyferts for Sa to Sbc Hubble type. The components younger than 1 Gyr and FC are larger in Sy2 than in non-Seyferts in eleven galaxies.
At 1 kpc from the nucleus we found for S0 galaxies the contribution of the 10 Gyr component is always smaller in Sy2 than in non-Seyferts, while the contribution of the 1 Gyr and younger components are normally larger. In the later Hubble type galaxies we have usually a smaller contribution of both the 10 Gyr and 1 Gyr components and a larger contribution of the youngest components in Sy2’s than in non-Seyferts.
There are 7 galaxies with uncertain morphology: Mrk1, Mrk34, Mrk78, Mrk273, Mrk463E, Mrk477 and NGC7212, all but Mrk34 and Mrk78 in clear interaction. At the nucleus all of them have significant contribution of components younger than 1 Gyr, while at 3 kpc from the nucleus only for two of them this does not happen. We do not have a reference study, similar to the one we have performed here, for the stellar population in non-active interacting galaxies, but it is a well known result that these galaxies frequently show recent episodes of star-formation, triggered by the interaction (Sanders & Mirabel 1996 and references therein). Thus the results we have obtained for these Seyfert 2 galaxies do not seem peculiar.
Regarding to E(B-V)i values, non-Seyferts S0 galaxies present small internal reddening throghout the central 6 kpc while Seyfert galaxies with same Hubble type have normally larger values and large variation. For later-type galaxies, we did not find significant differences between Seyfert and non-Seyfert galaxies. Both present large E(B-V)i variations (from 0 to 0.7), likely due to a non-uniform dust distribution.
| Hubble type | 10 Gyr | 1 Gyr | 10010Myr | 3Myr/FC | ||||||||
| Nuclear | 1 kpc | 3 kpc | Nuclear | 1 kpc | 3 kpc | Nuclear | 1 kpc | 3 kpc | Nuclear | 1 kpc | 3 kpc | |
| S0 Seyfert 2 | 50 | 50 | – | 26 | 37 | – | 14 | 8 | – | 10 | 5 | – |
| Non-Seyfert S0 | 86 | 77 | 50 | 6 | 15 | 36 | 9 | 8 | 12 | 0 | 0 | 1 |
| Sa-Sb Seyfert 2 | 29 | 34 | 35 | 24 | 27 | 28 | 30 | 26 | 29 | 17 | 13 | 8 |
| Non-Seyfert Sa-Sb | 61 | (45) | – | 33 | (52) | – | 4 | (2) | – | 2 | (1) | – |
| Bica’ Saa | 56 | – | – | 37 | – | – | 4 | – | – | 2 | – | – |
| Bica’ Sba | 53 | – | – | 35 | – | – | 7 | – | – | 5 | – | – |
| Sbc Seyfert 2 | 31 | 25 | 17 | 25 | 26 | 32 | 33 | 24 | 32 | 12 | 26 | 19 |
| Non-Seyfert Sbc | 68 | (43) | – | 27 | (57) | – | 3 | (0) | – | 2 | (0) | – |
| Non-Seyfert Sc | 46 | – | – | 35 | – | – | 15 | – | – | 4 | – | – |
| Bica’ Sca | 27 | – | – | 27 | – | – | 26 | – | – | 20 | – | – |
| S Seyfert 2 | 31 | 30 | 34 | 25 | 29 | 32 | 24 | 24 | 24 | 20 | 16 | 10 |
a Results for non-Seyfert galaxies from Bica (1988), in a region of 1 kpc 1 kpc.
6 Summary and Conclusions
In this paper we have analysed the stellar population of a sample of 20 Seyfert 2 galaxies as a function of distance from the nucleus, comparing the contribution of different age components with those for non-Seyfert galaxies of the same Hubble type.
The main conclusions can be summarized as follows.
1) The radial distribution of the CaIIK and G-band Ws show smaller values at the nucleus than that at 1 kpc from it for 11 of the 20 Seyfert 2 galaxies of the sample, suggesting dilution by a blue continuum from a FC or young stars; two present larger W values at the nucleus than outside, similar to non-Seyfert S0 galaxies, and in the remaining there is no obvious dilution, nor a systematic variation with the distance similar to that observed for the S0 galaxy.
2) Stellar population synthesis shows that, while at the nucleus, 75 per cent of the galaxies present contribution 20 per cent of ages 100 Myr (or/and FC), this proportion decreases to 45 per cent at 3 kpc. In particular, 55 per cent of the galaxies have contribution 10 per cent of the 3 Myr/FC component at the nucleus, but only 25 per cent of them have this component at 3 kpc.
3) Our results point to a systematic difference between the stellar population of Seyfert galaxies and those of non-Seyfert galaxies for the Hubble types from S0 to Sbc. At the nucleus and up to 1 kpc from it the contribution of ages younger than 1 Gyr is in most cases larger in the Seyferts than in non-Seyfert galaxies. Regarding the 1 Gyr component, at the nucleus its contribution is for the Seyferts, on average, larger for S0’s and similar to that of non-Seyfert for later type galaxies. Outside the nucleus it is again larger for the S0 Sy2s but smaller for the later type Seyfert when compared to the non-Seyferts. The 10 Gyr component shows a larger contribution in non-Seyferts than in Seyferts. Both the Seyferts and non-Seyferts show a decrease of the contribution of the 10 Gyr component and an increase of the 1 Gyr component with distance from the nucleus, although the gradient seems to be steeper for the non-Seyfert galaxies.
In the evolutionary scenario proposed by Storchi-Bergmann et al. (2001) and Cid Fernandes et al. (2001), the results above indicate that the interactions which trigger the AGN and circumnuclear bursts of star-formation, also trigger bursts along the body of the galaxy, at least within the inner 1 kpc.
Acknowledgments
D.R., T.S.B. and R.C.F. acknowledge support from the Brazilian Institutions CNPq, CAPES and FAPERGS. The National Radio Astronomy Observatory is a facility of the National Science Foundation operated under cooperative agreement by Associated Universities, Inc. We thank an anonymous referee for valuable suggestions which helped to improve the paper.
References
- [1] Antonucci, R., Hurt, T. & Miller, J. 1994, ApJ, 430, 210
- [2] Antonucci, R. 1993, ARA&A, 31, 473
- [3] Aretxaga, I., Terlevich, E., Terlevich, R.J., Cotter, G. & Díaz, Á.I. 2001, MNRAS, 325, 636
- [4] Bica, E. 1988, A&A, 195, 76
- [5] Bica, E. & Alloin, D. 1987, A&A, 186, 49
- [6] Bica, E. & Alloin, D. 1986, A&A, 162, 21
- [7] Canalizo, G. & Stockton, A. 2001, ApJ, 555, 719
- [8] Cid Fernandes, R., Sodré, L. Schmitt, H. & Leão, J.R. 2001a, MNRAS, 325, 60
- [9] Cid Fernandes, R., Heckman, T., Schmitt, H., González Delgado, R.M. & Storchi-Bergmann, T. 2001b, ApJ, 558, 81
- [10] Cid Fernandes Jr., R., Storchi-Bergmann, T. & Schmitt, H.R. 1998, MNRAS, 297, 579
- [11] Cid Fernandes, R. & Terlevich, R.1995, MNRAS, 272, 423
- [12] González Delgado, R., Heckman, T.M., Leitherer, C. 2001, ApJ, 546, 845
- [13] González Delgado, R., Leitherer, C. & Heckman, T.M. 1999, ApJS, 125, 489
- [14] González Delgado, R., Heckman, T.M., Leitherer, C., Meurer, G.R., Krolik, J., Wilson, A.S., Kinney, A. & Koratkar, A. 1998, ApJ, 505, 174
- [15] Heckman, T.M., González Delgado, R., Leitherer, C., Meurer, G.R., Krolik, J., Kinney, A., Koratkar, A. & Wilson, A.S. 1997, ApJ, 482, 114
- [16] Heckman, T.M., Krolik, J., Meurer, G.R., Calzetti, D., Kinney, A., Koratkar, A., Leitherer, C., Robert, C. & Wilson, A.S. 1995, ApJ, 452, 549
- [17] Joguet, B., Kunth, D., Melnick, J., Terlevich, R. & Terlevich, E. 2001, A&A, 380, 19
- [18] Malkan, M.A., Gorjian, V. & Tam, R. 1998, ApJSS, 117, 25
- [19] Neff, S.G., Fanelli, M.N., Roberts, L.J., O’Connell, R.W., Bohlin, R., Roberts, M.S., Smith, A.M. & Stecher, T.P. 1994, ApJ, 430, 545
- [20] Oliva, E., Origlia, L., Maiolino, R. & Moorwood, A.F.M., 1999, A&A, 350, 90
- [21] Raimann, D., Storchi-Bergmann, T., Bica, E. & Alloin, D., 2001, MNRAS, 324, 1087
- [22] Sanders, D.B. & Mirabel, F.I. 1996, ARA&A, 34, 749
- [23] Schmitt, H.R., Storchi-Bergmann, T. & Cid Fernandes, R. 1999, MNRAS, 303,173
- [24] Storchi-Bergmann, T., Bica, E. & Pastoriza, M.G. 1990, MNRAS, 245, 749
- [25] Storchi-Bergmann, T., Cid Fernandes, R. & Schmitt, H.R. 1998, ApJ, 501, 94
- [26] Storchi-Bergmann, T., Raimann, D., Bica, E. & Fraquelli, H. 2000, ApJ, 544, 747
- [27] Storchi-Bergmann, T., González Delgado, R., Schmitt, H.R., Cid Fernandes, R. & Heckman, T. 2001, ApJ, 559, 147
- [28] Tadhunter, C., Dickson, R., Morganti, R., Robinson, T.G., Wills, K., Villar-Martin, M. & Hughes, M. 2002, MNRAS, 330, 977
- [29] Whittle, M. 1992a, ApJ, 387, 121
- [30] Whittle, M. 1992b, ApJS, 79, 49