Comparing peanut–shaped ‘bulges’ to
N–body
simulations and orbital calculations
Abstract
We present a near-infrared –band photometric study of edge–on galaxies with a box/peanut–shaped ‘bulge’. The morphology of the galaxies is analysed using unsharp masking and fits to the vertical surface brightness profiles, and the results are compared to N–body simulations and orbital calculations of barred galaxies. Both theoretical approaches reproduce the main structures observed.
keywords:
galaxies: evolution — galaxies: structure — galaxies: photometry1 Introduction
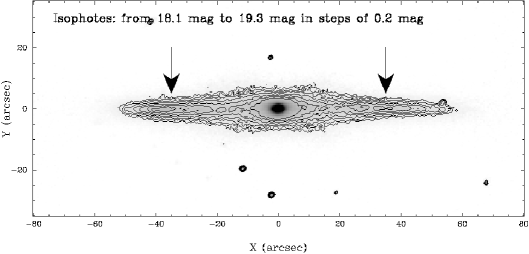
Box/peanut (b/p) shaped ‘bulges’ are frequently observed in edge–on galaxies (see Fig. 1; Lütticke, Dettmar, and Pohlen 2000a and references therein). They are also seen in many N–body simulations of barred disks which display a vertical thickening of the bar during its evolution, with a projected shape similar to the observed b/p structures (e.g. Combes, Debbasch, Friedli et al. 1990; Athanassoula and Misiriotis 2002, hereafter AM02). The works of \inlinecitemk99 and Bureau and Freeman (1999, hereafter BF99) support this view observationally. They analysed ionised gas position–velocity diagrams of edge–on spirals using the method described in \inlinecitekm95 and \inlineciteab99. Kinematic bar signatures were detected in essentially all the galaxies showing a b/p feature. In a large sample of galaxies (), the photometric link between bars and b/p ‘bulges’ was demonstrated reliably for the first time by Lütticke, Dettmar, and Pohlen (2000b).
2 Data
We analysed near-infrared –band photometry of a sample of edge–on galaxies, of which were studied kinematically by BF99. The objects are characterised by their bulge morphology, with galaxies showing a b/p structure and the remaining a more spheroidal shape.
We applied the technique of unsharp masking to our images to analyse their morphology. The results were then compared to edge–on projections of b/p structures obtained from orbital calculations and presented in Patsis, Skokos, and Athanassoula (2002, hereafter PSA02). In addition, to quantify the b/p structure in an objective manner, we studied our sample with the fitting method described by AM02, where generalised gaussians of the form are used to fit the vertical surface brightness profiles of the disk/bar components of the simulations. To minimise the influence of the bulge in our images (as the bulge was excluded from the N–body profiles), we apply a magnitude cut to the fit in the inner parts of the galaxies.
3 Results
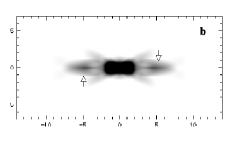
Most of the original (e.g. Fig. 1) and unsharp-masked (e.g. Fig. 2a) images show local surface brightness enhancements along the major axis on both sides of the central regions. The positions of these characteristic enhancements coincide with the ends of the bar (determined kinematically) and are observed in of the galaxies showing a b/p ‘bulge’, but in only of the remaining non–b/p galaxies. A possible explanation is an inner ring delineating the ends of the bar, since the edge–on projection would enhance the surface brightness at those positions (see AM02). A similar effect can also occur in the case of spiral arms starting at the bar’s ends, but an alternative explanation has been proposed by PSA02, who explain the enhancements by a combination of four different orbit families and the projection of material trapped around stable periodic orbits close to the bar’s ends (Fig. 2b).
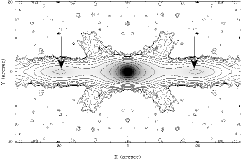
 a) Unsharp masking of ESO 597 -036.
b) Model A2 of PSA02.
a) Unsharp masking of ESO 597 -036.
b) Model A2 of PSA02.
In addition to the surface brightness maxima, the apparent X–shape of b/p ‘bulges’ is clearly seen in the unsharp–masked images of the sample galaxies (see, again, Fig. 2a). Two types of X–shapes are present in our sample. The first type is characterised by the fact that the ‘branches’ of the X–feature originate at the center of the galaxy. In the other cases, the branches seem to originate well outside of the central regions (e.g. Fig. 2a). PSA02 also find these two separate morphologies in their work. For example, their model A2, with a relatively slow pattern speed, reproduces an X–morphology with branches emerging from the centre of the galaxy (Fig. 2b), whereas their model D, characterised by a very strong bar, has an X–feature with branches starting away from the central bulge (as in Fig. 2.a). A comparison with unsharp–masked images is justified here because PSA02’s models include only periodic orbits, which are representative building blocks of the galaxies but not a self-consistent model.
The quantification of the peanut structure of ESO 443 -042 by vertical fits (Fig. 3a) shows a qualitative similarity with the fits of model MH in AM02 (massive halo, time ; Fig. 3b). In both cases the scaleheight and the shape parameter show a clear peak at or near the maximal extension of the b/p structure. But the two peaks are in fact at slightly different radii; in both the observations and the N–body simulations, we can observe that the peaks of the shape parameter are closer to the center than those of the scaleheight . The analysis of the fits for the entire sample is ongoing.
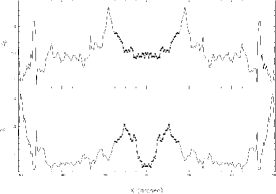
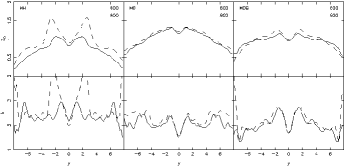 a) Vertical fits to ESO 443 -042.
b) Vertical fits to AM02’s models.
a) Vertical fits to ESO 443 -042.
b) Vertical fits to AM02’s models.
Acknowledgements.
GA thanks the Laboratoire d’Astrophysique de Marseille for support during visits when essential parts of this work were done and acknowledges financial support from the Deutscher Akademischer Austausch Dienst (grant D/02/02273). EA and AB would like to thank the IGRAP, the Region PACA, the INSU/CNRS, and the University of Aix–Marseille I for funds to develop the GRAPE and BEOWULF computing facilities used for the simulations. Support for this work was also provided by NASA through Hubble Fellowship grant HST-HF-01136.01 awarded by the Space Telescope Science Institute, which is operated by the Association of Universities for Research in Astronomy, Inc., for NASA, under contract NAS 5-26555.References
- Athanassoula and Bureau (1999) Athanassoula, E., and Bureau, M., 1999, ApJ, 522, 699
- AM02 (2002) Athanassoula, E., and Misiriotis, A., 2002, MNRAS, 330, 35 (AM02)
- BF99 (1999) Bureau, M., and Freeman, K. C., 1999, AJ, 118, 126 (BF99)
- Combes, Debbasch, Friedli et al. (1990) Combes, F., Debbasch, F., Friedli, D., and Pfenniger, D., 1990, A&A, 233, 82
- Kuijken and Merrifield (1995) Kuijken, K., and Merrifield, M. R., 1995, ApJL, 443, L13
- Lütticke, Dettmar, and Pohlen (2000a) Lütticke, R., Dettmar, R.–J., and Pohlen, M., 2000a, A&AS, 145, 405
- Lütticke, Dettmar, and Pohlen (2000b) Lütticke, R., Dettmar, R.–J., and Pohlen, M., 2000b, A&A, 362, 435
- Merrifield and Kuijken (1999) Merrifield, M. R., and Kuijken, K., 1999, A&A, 345, 47
- PSA02 (2002) Patsis, P. A., Skokos, Ch., and Athanassoula, E., 2002, MNRAS, in press (PSA02; astro-ph/0209024)