Discovery of a Population of H Clouds in the Galactic Halo
(Accepted for Publication in the Astrophysical Journal Letters)
(Preprint – October 14, 2002)
Abstract
A population of discrete H clouds in the halo of the inner Galaxy has been discovered in 21cm observations made with the Green Bank Telescope. The halo clouds are seen up to 1.5 kpc from the Galactic plane at tangent points throughout the first longitude quadrant and at several locations in the fourth quadrant. Their velocities follow Galactic rotation. A group of clouds more than 500 pc below the plane near was studied in detail. In the median, the 38 clouds have a peak of a few cm-2, a diameter of a few tens of pc, an H density of a few tenths cm-3, and an H mass of 50 , with a considerable range about the median. Some halo clouds have line widths so narrow that their temperature must be K. Some appear to have a core-halo velocity structure. As much as half the mass of the neutral halo may be in clouds.
1 Introduction
The Galactic H halo — the neutral gas layer which extends many scale heights above the disk — has been detected in 21cm emission, Ly absorption, and in other species (see the review by Savage (1995)). In the inner Galaxy, where tangent-point observations can locate the gas accurately, 21cm H emission has been found to pc from the Galactic plane (Lockman (1984); hereafter L84), and combined 21cm-Ly studies give similar results for gas near the Sun (Lockman, Hobbs, & Shull, 1986). The spatial structure of halo H has always been uncertain. A list of “halo clouds” was given in L84, but these clouds are quite large, possibly atypical, and not obviously related to the more pervasive halo medium which appears smooth, though lumpy, in the major 21cm surveys (Weaver & Williams, 1973; Hartmann & Burton,, 1997). A “patchiness factor” for halo gas was introduced by Savage and collaborators (Savage, Edgar & Diplas, 1990; Diplas & Savage, 1994) to account for the relatively large scatter in the absorption column densities from one direction to another, but targets for absorption studies are sparsely distributed across the sky, and give little information on the angular structure of the gas. When 21cm survey spectra are averaged over large areas to achieve the highest sensitivity, they show what appears to be very high velocity-dispersion wings, suggesting that the Galaxy has an H component with a scale-height of 4 kpc (Kalberla et al., 1998; Kalberla, Kerp, & Haud, 2002). However, the large areal averaging necessary to detect this emission removes most information on its angular structure.
This Letter reports results from the first observations with the Robert C. Byrd Green Bank Telescope (the GBT) of 21cm emission from the Galactic H halo at the tangent points in the inner Galaxy. The GBT has good angular resolution, excellent sensitivity, and high dynamic range for this work, and has revealed unexpected structure in the H far from the Galactic plane.
2 Observations
Observation were made in several sessions from April to July 2002 using the GBT at the NRAO in Green Bank, WV. The telescope’s 100 meter diameter, unblocked aperture gives it an exceptionally clean main beam with a half-power width at 21 cm of , and a first sidelobe 30 dB below the main beam (Lockman, 1998; Jewell, 2000; Prestage & Maddalena, 2003). The receiver system temperature on cold sky was about 20 K. The detector was the NRAO spectral processor, a Fourier Transform instrument with an efficiency near unity. The spectra have a velocity coverage of km s-1 around km s-1 LSR in 512 channels, each with a velocity width of 1.25 km s-1 and a spacing of 1.03 km s-1. Residual instrumental baselines are modeled adequately with a first or second order polynomial.
3 HI Clouds far from the Galactic Plane
At the tangent points in the inner Galaxy, Galactic rotation is projected entirely along the line of sight, so gas at the “terminal” velocity, , has a distance from the Sun, r, a distance from the Galactic center, , and a distance from the Galactic plane, z, which is known with uncommon accuracy, at least for kpc (L84, List, Burton, & Xiang (1984); Burton (1992); in this Letter the Sun-center distance kpc). In the halo, gas at the tangent point which corotates with gas in the disk will appear at for the latitudes studied here. The intrinsic velocity dispersion of the ISM will produce some emission at velocities beyond , but any material which lags significantly behind Galactic rotation will have . A lagging halo will be displaced away from the terminal velocity and will not be seen in this analysis.
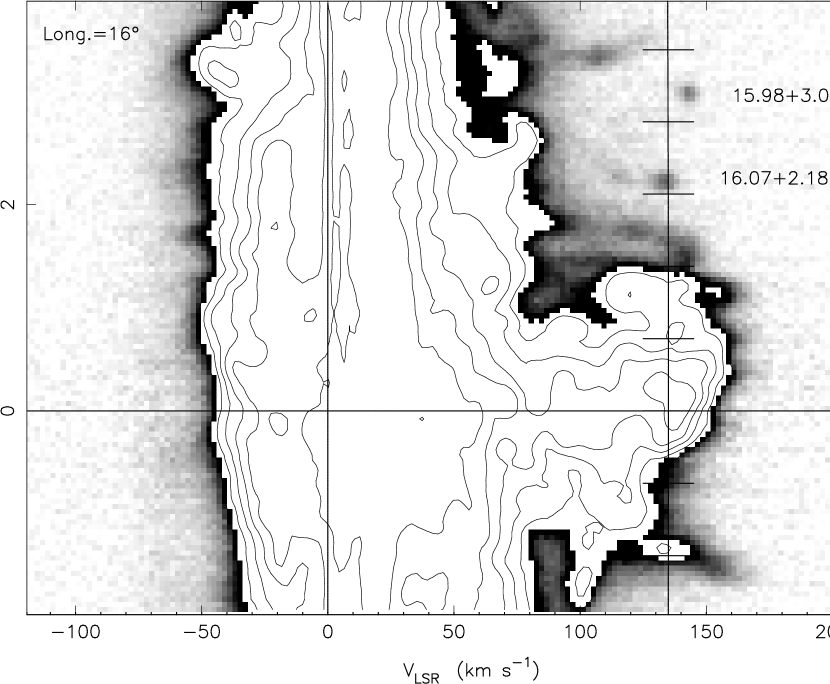
Figure 1 shows H emission observed with the GBT in a slice through the Galactic plane at longitude . The terminal velocity is marked with a vertical line at km s-1 (here is derived from the low-latitude studies of Burton & Gordon (1976), Clemens (1985), and Dame, Hartmann, & Thaddeus (2001)). Most of the H at the highest velocities is concentrated to , but near latitude , just beyond the terminal velocity, there is a narrow line component at km s-1 which lies quite a bit above the disk emission. Subsequent maps made around this feature show that it is a discrete H cloud which has an angular size and a peak cm-2. Its velocity places it at or near the tangent point, implying that it has pc, a linear extent of 36 pc, and an H mass . The 21cm line is narrow, with a km s-1 (FWHM). Another small cloud at and km s-1 has similar properties and is +310 pc above the plane.
H clouds like these have been detected with the GBT at longitudes and . Some of the brighter halo clouds can be recognized in low-resolution survey data (e.g., Hartmann & Burton, (1997)), but they usually appear there in only one or two pixels. These clouds constitute a previously undiscovered population. They are found many degrees and many hundreds of pc from the Galactic plane. They appear to share the same general rotation as gas in the disk — a Galactic rotation curve derived from the halo clouds alone would be quite similar to a rotation curve derived from the disk. Although the halo clouds contain only a minuscule fraction of the total in their direction (the total is dominated by the disk), they may contain a significant fraction of the mass of the neutral halo.
4 The H Halo at Longitude
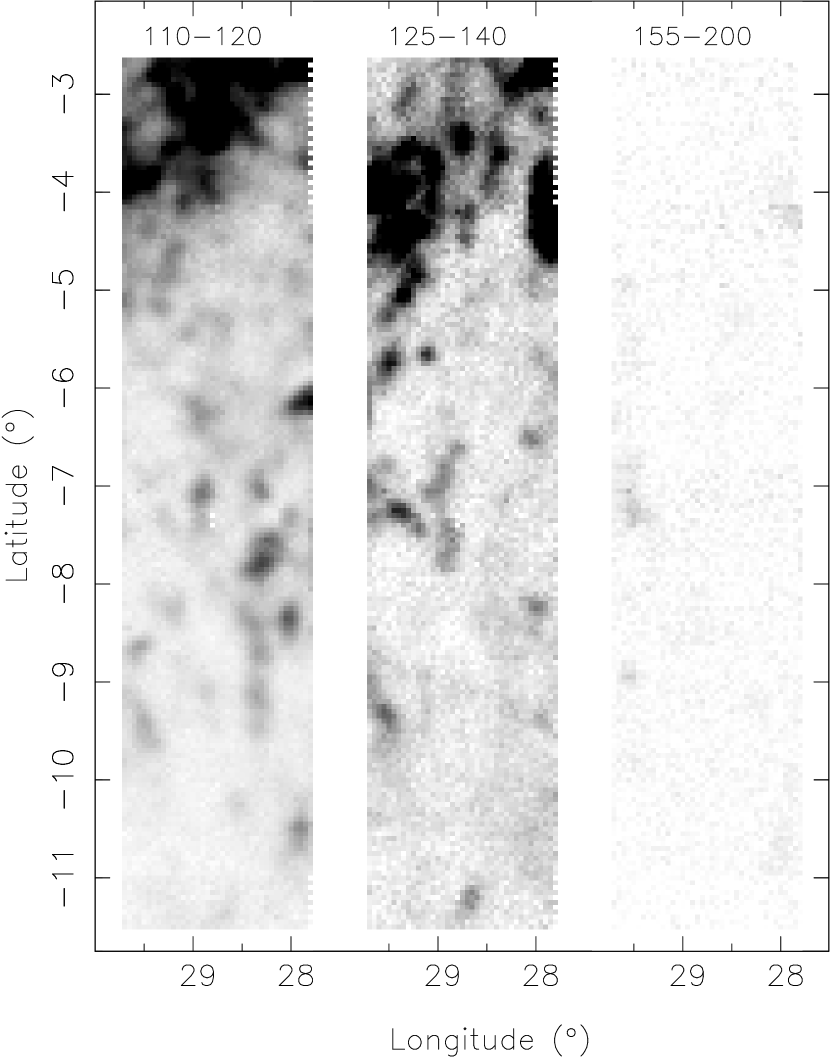
An area of the sky near was mapped with the GBT to provide information on a set of these objects at one location in the Galaxy ( kpc; kpc). This region was known from preliminary observations to have a number of tangent-point clouds, and it does not appear to have high optical extinction, so there is some hope that objects found in this field may be studied at other wavelengths. Figure 2 shows H maps averaged over several velocity intervals. The left panel covers emission km s-1 greater than , which is about 105 km s-1 at this longitude (Clemens, 1985). The map is dotted with clouds, so common near the plane that they blend into structures which are difficult to untangle. The central panel of Figure 2 shows the same area at higher velocities. There are additional clouds, though fewer than at the lower velocities. The right panel, covering very high velocities, shows mainly noise and the wings of lower-velocity clouds, but also a weak emission feature near , which arises in a small cloud at km s-1 that has a peak cm-2 at pc.
4.1 Observations of Individual Clouds
More sensitive spectra of several minutes duration were obtained toward the centers of 38 bright, unconfused clouds chosen from preliminary observations of the field. Gaussian components were fit to the spectra to determine the peak line intensity, , the line width (FWHM) , and the velocity of each cloud. The clouds all have and and are thus at least 500 pc from the plane. Their emission is typically five to ten times the background. Properties of the 38 clouds are summarized in Table 1 and representative spectra are shown in Figure 3.
In Table 1 the quantity is the column density at the cloud center, where cm-2. The diameter listed is the square root of the product of the diameters in longitude and latitude. About 25% of the clouds are unresolved to the beam of the GBT and most of the others are not greatly elongated. The average volume density, , is divided by the diameter, and thus a lower limit for unresolved clouds. Most of the clouds have cm-3, but some have up to three times this value. The total mass is for H only. The mass distribution is strongly skewed toward lower mass clouds: one-third have .
4.1.1 Velocity
The 38 clouds have velocities in the range km s-1, but the number per unit velocity decreases approximately linearly with : half of the clouds lie within 15 km s-1 of . The total in clouds also decreases with increasing velocity. The clouds are thus related to the disk dynamically. A simulation using a flat Galactic rotation curve suggests that a cloud population with a line-of-sight velocity dispersion km s-1 would be consistent with the distribution of cloud velocities at . There is no strong correlation of with : the highest velocity clouds are found near kpc.
4.1.2 Kinetic Temperature and Line Shape
Line widths are approximately uniformly distributed between 4.2 and 20 km s-1 with only a few higher values. About one-quarter of the lines are so narrow that the clouds must be rather cool, with K, and there are 4 clouds with K. Some halo clouds listed in L84 are also this cool. It may be significant that the narrowest lines, those with km s-1, are all found in the half of the sample closest to the Galactic plane. Virtually all of the lines from the clouds are superimposed on weak emission which often extends to higher velocity . Some clouds appear to have a core-halo structure with two spectral components, one broad and one narrow, at the same position and velocity. An example is 29.12-5.65 in Figure 3. The broad component is typically one-third as bright as the narrow component, and has at least three times the line width, but the Gaussian decomposition is often ambiguous and properties of the spectral “halos” are quite uncertain. In particular, the observations are not yet sensitive enough to determine if the apparent halos are conterminous with the cores.
4.1.3 Thermal Pressure
An estimate of a cloud’s thermal pressure is . In terms of observables, . Values of are almost certainly dominated by turbulence and thus give only an upper limit on . Also, most of the clouds are no more than a few beamwidths across, so there is significant uncertainty in their diameter. Estimates of from these data are thus highly uncertain, but for what it is worth, clouds closer to the Galactic plane have typically half that of those farther from the plane, and there are six clouds which appear to be resolved in angle and have K-cm-3. Two-thirds of the clouds with the lowest seem to have core-halo spectral structure, where refers to the line from the core. Given the size and H mass of the clouds, their pressures, whether thermal or turbulent, are orders of magnitude higher than the limit for gravitational binding, suggesting that the clouds, if they are stable, are confined by an external medium.
4.1.4 Correlations with Position and Velocity
Linewidth is the only property of the halo clouds seemingly correlated with distance from the Galactic plane: the narrower lines tend to lie closer to the plane than the broader ones. Cloud size, mass, and are all independent of .
There is a relationship between and in that the brightest lines come from clouds whose velocities are closest to . The median value of for clouds at km s-1 is more than twice that for clouds at km s-1. Line widths and cloud size have no strong relationship with , but the decline in mean with increasing produces a nearly linear decline in the average with from a value near 19.5 for clouds at km s-1 to 19.0 at km s-1. Cloud diameters are not dependent on , but from the trend, it follows that the most massive clouds (and those with the largest ) are found preferentially at the lowest velocities.
4.1.5 The Fraction of the H Halo Contained in Discrete Clouds
In addition to the clouds, there is a broader component of H emission on which the clouds are superimposed both in velocity (Fig. 3) and position (Fig. 2). This emission may be from faint, unresolved clouds, or a genuinely diffuse medium. The 38 clouds contain about 20% of the total at within , though the amount varies from zero at some latitudes to at others. Considering that the 38 clouds studied in detail are only a subset of all the clouds visible in this field, it is plausible that half of the H emission in the field might come from clouds. Because of velocity crowding, emission at a common may arise from unrelated material separated by as much as a few kpc along the line of sight around the tangent point. From the current data it is not possible to determine if the halo clouds are related to the diffuse emission, or even if they are located in the same region of space.
5 Summary Comments
Observations with the GBT show that the halo of the inner Galaxy contains a population of H clouds related dynamically to the disk. This gas was already known to be in the halo from low-resolution studies (L84, Dickey & Lockman (1990)); what was not known is that a significant fraction of it is organized into clouds. It is not yet possible to derive a scale height for the clouds, but by traditional standards some of them are extremely far from the Galactic plane. It is tempting to speculate that they are a distant analog to the intermediate velocity clouds seen in the vicinity of the Sun. Halo clouds are found in GBT data throughout the inner Galaxy except at a few directions at , but it is too early to draw conclusions about their overall distribution. These clouds are so ubiquitous that some are likely to occult extragalactic objects, allowing their abundances to be determined through optical or UV spectroscopy.
Several theoretical studies have addressed the issue of cloud formation in the Galactic halo, usually in the context of high-velocity clouds, not gas in normal Galactic rotation (Shapiro & Field, 1976; Bregman, 1980; Ferrara & Field, 1994; Wolfire et al., 1995). An exception is Houck and Bregman (1990), who explicitly studied the formation of corotating neutral clouds cooling from a low-temperature Galactic fountain. Some of their models produce clouds with a density and distance from the plane in the range of those found here, but with much smaller mass. If the clouds have formed in a fountain and are falling to the plane, some deviation from circular rotation might be observed, along with a projected component of the vertical velocity (Benjamin & Danly, 1997). There is no evidence of a decrease in the average LSR velocity of the clouds with to at least 1 kpc, but any clouds which lag behind Galactic rotation, and whose line-of-sight velocity is thus below , would not have been examined in this study. Global models of the disk and halo (e.g., Rosen & Bregman (1995); de Avillez (2000); de Avillez & Mac Low (2001)) may soon be refined enough to allow a detailed comparison with the data. Further observations, now in progress, should clarify the properties of the halo clouds, establish their distribution throughout the Galaxy and relationship to other species, and reveal their internal structure.
References
- Benjamin & Danly (1997) Benjamin, R.A., & Danly, L. 1997, ApJ, 481, 764
- Bregman (1980) Bregman, J.N. 1980, Ap.J., 236, 577
- Burton (1992) Burton, W.B. 1992, in The Galactic Interstellar Medium, Saas-Fee Advanced Course 21, ed. D. Pfenniger, & P. Bartholdi, (Springer-Verlag), p. 1
- Burton & Gordon (1976) Burton, W.B., & Gordon, M.A. 1976, A&A, 63, 7
- Clemens (1985) Clemens, D.P. 1985, ApJ, 295, 422
- Dickey & Lockman (1990) Dickey, J.M. & Lockman, F.J. 1990, ARA&A, 28, 215.
- Dame, Hartmann, & Thaddeus (2001) Dame, T.M., Hartmann, D., & Thaddeus, P. 2001, ApJS, 547, 792
- de Avillez (2000) de Avillez, M.A. 2000, MNRAS, 315, 497
- de Avillez & Mac Low (2001) de Avillez, M.A. 2001, & Mac Low, M.-M. 2001, BAAS, 33, 875
- Diplas & Savage (1994) Diplas, A., & Savage, B.D. 1994, ApJ, 427, 274
- Ferrara & Field (1994) Ferrara, A., & Field, G.B. 1994, ApJ, 423, 665
- Hartmann & Burton, (1997) Hartmann, D. & Burton, W.B., 1997, “Atlas of Galactic Neutral Hydrogen”, Cambridge University Press.
- Houck & Bregman (1990) Houck, J.C., & Bregman, J.N. 1990, ApJ, 506, 521
- Jewell (2000) Jewell, P.R. 2000, in Radio Telescopes, Proc. SPIE Vol. 4015, 136
- Kalberla et al. (1998) Kalberla, P.M.W., Westphalen, G., Mebold, U., Hartmann, D., & Burton, W.B. 1998, A&A, 332, L61
- Kalberla, Kerp, & Haud (2002) Kalberla, P.M.W., Kerp, J., & Haud, U. 2002, A&A, (in press)
- List, Burton, & Xiang (1984) Liszt, H.S., Burton, W.B., & Xiang, D.-L. 1984, A&A, 140, 303
- Lockman (1984) Lockman, F.J. 1984, ApJ, 283, 90 (L84)
- Lockman (1998) Lockman, F.J. 1998, in Advanced Technology MMW, Radio, and Terahertz Telescopes, SPIE Vol. 3357, 656
- Lockman, Hobbs, & Shull (1986) Lockman, F.J., Hobbs, L.M., & Shull, J.M. 1986, ApJ, 301, 380
- Prestage & Maddalena (2003) Prestage, R.M., & Maddalena, R.J. 2003, in Astronomical Telescopes and Instrumentation, SPIE Conf. Vol. (in press)
- Rosen & Bregman (1995) Rosen, A., & Bregman, J.N. 1995, ApJ, 440, 634
- Savage (1995) Savage, B.D. 1995, in The Physics of the Interstellar Medium and Intergalactic Medium, ed. A. Ferrara, C.F. McKee, C. Heiles, & P.R. Shapiro, ASP Conf. Ser. 80, p. 233
- Savage, Edgar & Diplas (1990) Savage, B.D., Edgar, R.J., & Diplas, A. 1990, ApJ, 314, 380
- Shapiro & Field (1976) Shapiro, P.R., & Field, G.B. 1976, Ap.J., 205, 762
- Weaver & Williams (1973) Weaver, H. & Williams, D.R.W. 1973, A&AS, 8, 1
- Wolfire et al. (1995) Wolfire, M.G., McKee, C.F., Hollenbach, D., & Tielens, A.G.G.M. 1995, ApJ, 453, 673
| Property | Median | 90% Range |
|---|---|---|
| (1) | (2) | (3) |
| (pc) | ||
| (K) | 1.0 | |
| (km s-1) | 12.2 | |
| ( cm-2) | ||
| Diameter (pc) | 24 | |
| (cm | 0.25 | |
| () | 50 |