X-Ray Emission from the Jets of XTE J1550–564
Abstract
We report on X-ray observations of the the large-scale jets recently discovered in the radio and detected in X-rays from the black hole candidate X-ray transient and microquasar XTE J1550–564. On 11 March 2002, X-ray emission was detected to the West of the black hole candidate and was extended along the jet axis with a full width at half maximum of and a full width at 10% of maximum intensity of . The morphology of the X-ray emission matched well to that of the radio emission at the same epoch. The jet moved by between 11 March and 19 June 2002. The apparent speed during that interval was . This is significantly less than the average apparent speed of from 1998 to 2002, assuming that the jet was ejected in September 1998, and indicates that the jet has decelerated. The X-ray spectrum is adequately described by a powerlaw with a photon index near 1.8 subject to interstellar absorption. The unabsorbed X-ray flux was in the 0.3-8 keV band in March 2002, and decreased to in June. We also detect X-rays from the eastern jet in March 2002 and show that it has decelerated and dimmed since the previous detections in 2000.
1 Introduction
Jets are a ubiquitous facet of accretion in systems ranging from young stellar objects, to Galactic X-ray binaries, to active galactic nuclei. Many important questions regarding jet formation and propagation remain unanswered and new data will likely be required to resolve them. Observations of systems within the Galaxy hold the great advantage that their evolution is rapid. Processes requiring millions of years in AGN can unfold in a few years for stellar-mass scale systems, so that the dynamics can be studied directly.
Corbel et al. (2002a, b) recently discovered a large-scale, relativistic radio and X-ray emitting jet from the X-ray transient XTE J1550–564. The source is a Galactic black hole candidate and the mass of the compact object is constrained to be (Orosz et al., 2002). A superluminal jet ejection event had been previously observed from this source in the radio in September 1998 (Hannikainen et al., 2001) during a very bright X-ray outburst (Sobczak et al., 1999). Detection of the large-scale radio jet to the west of XTE J1550–564 led to a re-analysis of archival Chandra data and discovery of an X-ray jet to the east of XTE J1550–564 (Corbel et al., 2002b; Tomsick et al., 2002). This X-ray jet exhibits proper motion directly away from XTE J1550–564. Based on the angular separations and the measured proper motion, the most likely epoch of origin of these large-scale jets is near the major X-ray outburst which peaked on 20 Sept 1998 (Sobczak et al., 1999) and we adopt this date as the origin of the currently observed jets (Corbel et al., 2002b).
Discovery of the large-scale radio jet also led to new observations of XTE J1550–564 made with the Chandra X-Ray Observatory (Weisskopf et al., 2002) which are described here. The sub-arcsecond resolution of Chandra delivered by the High-Resolution Mirror Assembly (van Speybroeck et al., 1997) has allowed us to detect and resolve X-ray emission from the western jet. In addition, we have again detected the eastern jet. In the following, §2 presents the new observation and source detections, §3 contains our results on the spectrum, morphology, motion, and variability of the eastern jet, §4 describes our new data on the western jet, and §5 includes a few comments on the implications of these results.
| Date | RA | DEC | S/N | Counts | Flux | Comment | |
|---|---|---|---|---|---|---|---|
| 1 | March | 15 50 58.66 | -56 28 35.2 | 334.3 | 1163.4 | 4.64 | XTE J1550–564 |
| June | 15 50 58.66 | -56 28 35.2 | 26.3 | 54.5 | 0.31 | ||
| 2 | March | 15 50 55.97 | -56 28 33.6 | 122.5 | 409.1 | 1.64 | Western Jet |
| June | 15 50 55.90 | -56 28 33.6 | 87.4 | 238.2 | 1.36 | ||
| 3 | March | 15 51 02.16 | -56 28 37.7 | 4.9 | 18.4 | 0.08 | Eastern Jet |
| June | Not detected |
Note. — Table 1 includes for each source: RA and DEC – the position of the source in J2000 coordinates; S/N – the significance of the source detection as calculated by wavdetect; Counts - the net counts in the 0.3–7 keV band; Flux – the observed (absorbed) source flux in units of in the 0.3–7 keV band calculated assuming a power law spectrum with photon index of 1.8 and Galactic absorption. There are two rows for each source: one for the March observation and one for the June observation.
2 Observations and Source Detection
XTE J1550–564 was observed on 11 March 2002 and on 19 June 2002 with the Chandra X-Ray Observatory (CXO; Weisskopf et al. 2002) using the the Advanced CCD Imaging Spectrometer spectroscopy array (ACIS-S; Bautz et al. 1998) using Director’s Discretionary Time in response to a Target of Opportunity request based on the discovery of the western radio jet (Corbel et al., 2002a) and a follow-up request made after discovery of X-ray emission from the western jet. For the March observation (ObsID 3448), a total of 26118 s of useful exposure were obtained with the ACIS-S operated in a 1/4 subarray mode with only the S3 chip read out to minimize pile-up for XTE J1550–564 which was in the decay phase of a recent X-ray outburst and expected to be relatively bright during the observation. The roll angle of placed the short axis of the field of view in the subarray mode nearly along the jet axis, but the useful field of view along that axis, , was still adequate to image both jets. For the June observation (ObsID 3672), a total exposure of 18025 s was obtained with the ACIS-S operated in the full array mode with 6 ACIS chips read out.
The data were subjected to the standard data processing (ASCDS version 6.6.0 using CALDB version 2.12) and then customary event processing and filtering procedures, from the Chandra Interactive Analysis of Observations software package (CIAO) v2.2.1, were applied to produce a level-2 event list. Light curves including all valid events on the S3 chip were constructed to search for times of high background. In both observations, the count rate appears uniform with no obvious flares.
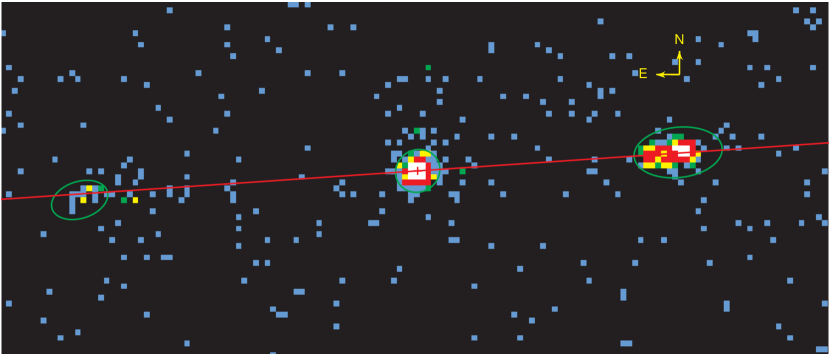
Images of the region around XTE J1550–564 extended along the jet axis and perpendicular to the jet axis were constructed using photons in the energy band 0.3–7 keV. We searched for sources using wavdetect (Freeman et al., 2002), the wavelet-based source detection routine in CIAO. Four sources were detected at significances greater than . One source is coincident with XTE J1550–564 and two others lie along the jet axis. The western jet was detected in both March and June, while the eastern jet was detected only in March. The fourth source, at RA = 15h50m53.05, DEC = -562902.0 (J2000), does not lie along the jet axis and is identified with a relatively nearby K/M dwarf present in optical images of the field. A portion of the March image along the jet axis and containing XTE J1550–564 and its two jets is shown in Fig. 1.
We adjusted the astrometry of each image so that the position of the source coincident with XTE J1550–564 matches the accurately measured radio position. A shift of was required for the March observation and a shift of for June. Both shifts are within the absolute astrometric accuracy of Chandra. The statistical error on the source positions is less than () in all cases and less than for XTE J1550–564. However, care must be taken in comparing positions of the jet sources due to their finite extent as discussed below.
We defined source regions using ellipses with radii 4 times the radius of 50% encircled energy calculated from the observed photons for each source by wavdetect. The diameter of the ellipse for XTE J1550–564 is which is consistent with that expected for an on-axis point source (8 times the half power radius for ACIS-I). We extracted counts for each source region and a corresponding background region. The exposure was calculated for a monochromatic beam of 1.5 keV. The exposure over the regions including XTE J1550–564 and the western jet is uniform to within 2%. The region including the eastern jet lies over a CCD node boundary and the exposure is up to 15% lower. We translated the count rates to photon fluxes using the exposure, then to energy fluxes in the 0.3-7 keV band assuming a powerlaw spectrum with a photon index of 1.8 and a column density equal to the total Galactic column in the direction of XTE J1550–564 which we take to be based on radio measurements of the Hi column density (Dickey & Lockman, 1990) along the line of sight. This value is consistent with the one measured by high-resolution X-ray spectroscopy of XTE J1550–564 by Miller et al. (2002). The properties of the three sources along the jet axis are listed in Table 1.
Below, we also include results from archival Chandra data. Observations with two dimensional imaging are available for June 9, August 21, and September 11 of 2000. These data and the analysis of the eastern jet are described in Tomsick et al. (2002). Each observation is brief with an exposure of no more than 5200 s. The June 2000 observation had a grating in place, while the others did not.

3 Western Jet
3.1 Spectrum
We extracted a spectrum for the western jet from the March observation using CIAO tools and applied the recent correction for the low energy quantum efficiency degradation of the ACIS. We fitted the spectrum using XSPEC, see Fig. 2. The spectrum is adequately fit with a powerlaw model with absorption by material with solar abundances. With the equivalent Hydrogen absorption column density fixed to , the best fit photon index is and the allowed range at 90% confidence is 1.61 to 1.93 ( for one parameter). The absorbed flux is in the 0.3-8 keV band and unabsorbed flux would then be in the same band.
Allowing the absorption column density to vary leads to an allowed range of at 90% confidence ( for two parameters) and a corresponding range of 1.58–2.37 for the photon index. The best fit values are and . The allowed range includes the Galactic Hi value. We cannot exclude extra absorption using the X-ray data.
For the June observation, the spectrum is, again, adequately fit with a powerlaw model with absorption. With , the best fit photon index is and the allowed range at 90% confidence is 1.52 to 2.02. The spectrum in June appears consistent with that measured in March. The absorbed flux is in the 0.3-8 keV band and the unabsorbed flux is in the same band.
Since there is no evidence of spectral variability, we fitted the two data sets simultaneously to obtain better constraints on the fit parameters. With , the best fit photon index is and the allowed range at 90% confidence is 1.64 to 1.90. Allowing the absorption column density to vary leads to and at 90% confidence ( for two parameters).
In addition to the non-thermal powerlaw model, we also fit the combined data with the mekal model which is appropriate for thermal emission from hot diffuse gas. With fixed to the Galactic value, an adequate fit was obtained with . A simple thermal bremsstrahlung model gives a similar temperature range, . No prominent line emission is observed. However, the limits on the equivalent width are not strongly constraining (varying from 100 eV to 1.3 keV at 90% confidence () for a narrow line with energy in the range 3–7 keV).

3.2 Morphology and Motion
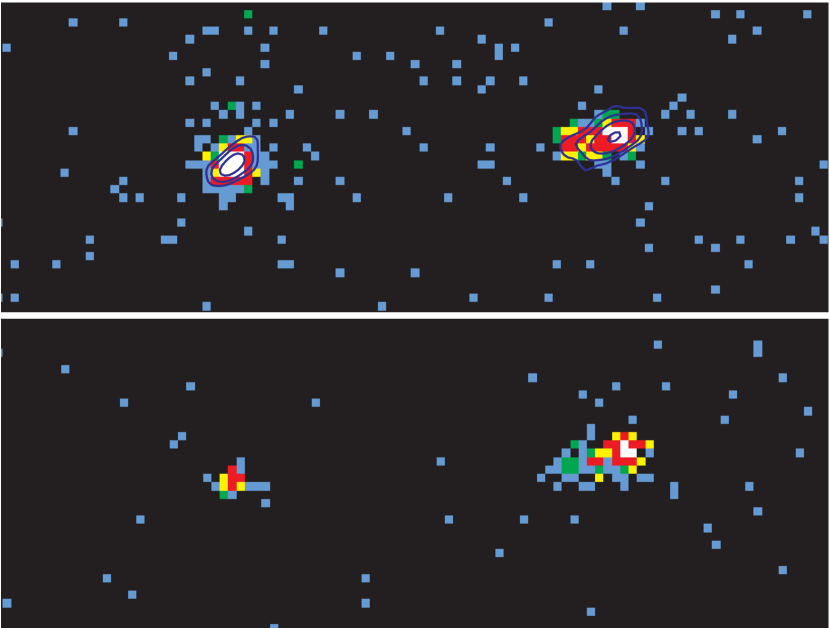
The X-ray counterpart of the western jet appears extended. Fig. 3 shows the X-ray images from both Chandra observations with radio contours obtained from observations made on 29 January 2002 using the Australian Telescope Compact Array (ATCA) (Corbel et al., 2002b) superimposed on the 11 March 2002 Chandra data. The ATCA image of the compact source XTE J1550–564 appears extended along a NW-SE axis due to partial synthesis caused by the limited parallactic angle coverage with the linear ATCA array. However, in addition to the extent caused by partial synthesis, there is a true, physical extent to the western radio jet. The peak of the jet emission is towards the west (away from XTE J1550–564) and there is lower intensity emission extending to the east, back towards XTE J1550–564. The morphology of the X-ray source closely matches that of the radio source.
We define the jet axis using the positions of the X-ray sources corresponding to XTE J1550–564 and the western jet, as reported in Table 1. The resulting position angle is in good agreement with the position angle of reported for the superluminal jets (D. Hannikainen, private communication) and with the position angle of reported for the radio western jet (Corbel et al., 2002b). To determine if the jet tails lie along the jet axis, we calculated the average azimuthal angle for events between and from the western jet position and within in azimuth of a vector pointing back to XTE J1550–564. The average azimuthal angle is for the March data and for the June data. The tail of the western jet appears aligned with the jet axis in the March data, but may be slightly skewed to the South in the June data. However, the skew is only marginally statistically significant and may be affected by uncertainty in the true position of the jet peak, discussed below.
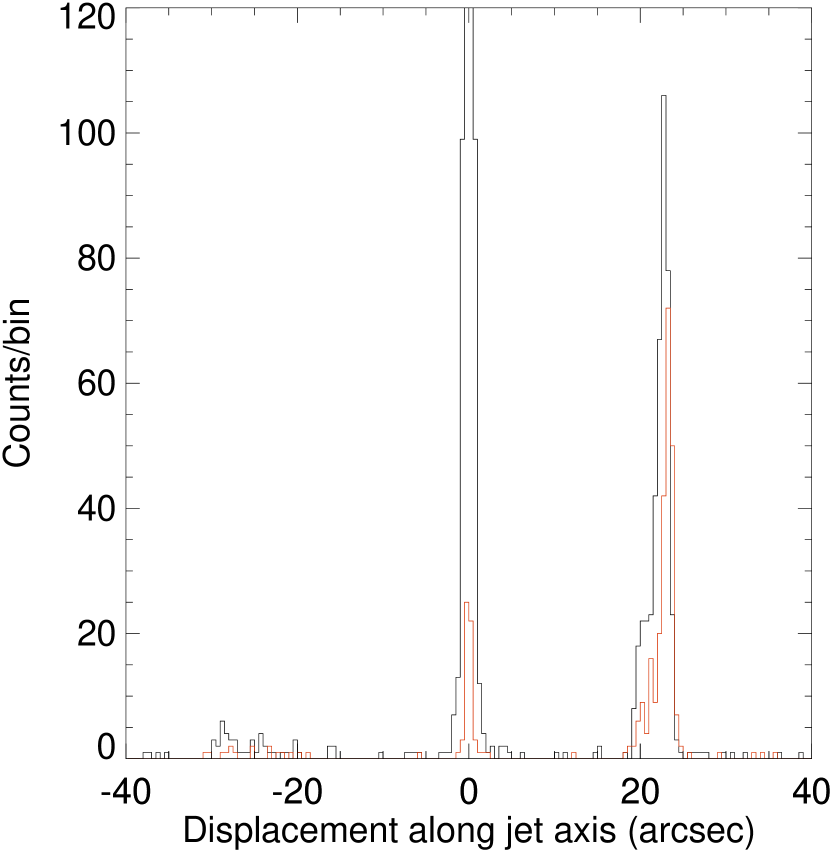
To study the morphology and motion of the X-ray jet, we decomposed the image along axes parallel and perpendicular to the jet axis (as defined above). We calculated the displacement of each X-ray event parallel and perpendicular to this axis. Fig. 4 shows the profile of X-ray counts along the jet axis from the two observations. All photons with energies in the range 0.3–7 keV and within of the jet axis in the perpendicular direction are included. In the March data, both jets are clearly present. In the June data, there is no strong source at the location of the eastern jet, but there may be some diffuse emission above the background level. The western jet appears to have moved away from XTE J1550–564.
For the March observation, the peak of the X-ray emission of the western jet is displaced by (along the jet axis and away from XTE J1550–564) from the position reported in Table 1 which is the centroid over the region containing 50% of the encircled energy (Freeman et al., 2002). Hence, caution is warranted when comparing the jet position to positions found in other observations.
To measure the relative position of the western jet in the March and June observations, we used a Kolmogorov-Smirnov (KS) test to permit comparison of unbinned position data. We used the position along the jet axis for each event calculated above. We added an offset, in the range to , to the June event positions and then compared the offset positions with the March event positions within of the western jet peak. The best match occurred for an offset of . Given this offset, the KS test gives a 61% probability that the two samples are drawn from the same parent distribution. To evaluate the uncertainty in the offset, we integrated the KS-test probability distribution as a function of offset and found the offsets corresponding to 5% and 95% of the full integral (i.e. the 90% confidence interval). These are and . The hypothesis that the two distributions are the same with zero offset is rejected at the level of . The western jet moved by between the March and June observations.
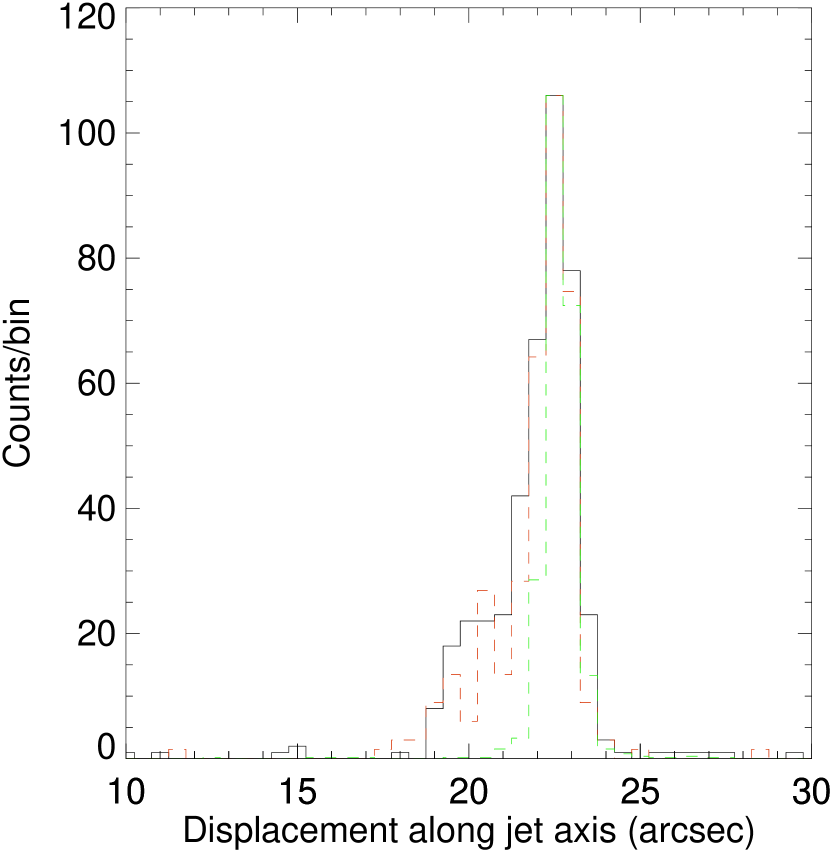
The morphology of the western jet does not appear to have changed, even though it moved. Fig. 5 shows the western jet profiles along the jet axis from the March and June observations, with the June data shifted by and scaled so that the peaks match. As noted above, a KS test is consistent with the two profiles being the same.
The figure also shows the data for XTE J1550–564 itself from the March observation, rescaled and displaced to match the peak at western jet. From its time variability, we know that the X-ray emission from XTE J1550–564 must arise from what is effectively a point source for the angular resolution of Chandra. Hence, we use XTE J1550–564 as a calibration of the point spread function for the observation to determine the spatial extent of the emission from the western jet. This procedure accounts for any aspect jitter during the observation and also for any source extent induced by scattering of the X-rays in the interstellar medium between us and the source. The spectrum of XTE J1550–564 during the March observation is quite similar to that found for the western jet, so effects due to the energy dependence of the Chandra point spread function should be negligible. Both sources are sufficiently close to the aimpoint so that the degradation of the Chandra point spread function off axis should also be negligible.
Comparison of the rescaled profile of XTE J1550–564 with the profile of the X-ray emission from the western jet in the March observation shows that the western jet is extended. The leading edge of the X-ray source (the edge away from XTE J1550–564) is approximately consistent with the profile of a point source. The trailing edge is clearly extended. The full width of the source at half maximum is and the full width at 10% of maximum intensity is .
Fig. 6 shows the distribution of X-ray counts perpendicular to the displacement axis for the western jet and XTE J1550–564 in the March data. We used X-rays with energies in the range 0.3–7 keV and with displacements along the jet axis of up to from the respective source position as reported in Table 1. A Kolmogorov-Smirnov (KS) test shows that the two distributions are inconsistent at the 97% confidence level (). The western jet may be slightly extended perpendicular to the jet axis, but the evidence is weak. Deconvolving, assuming that the physical width adds in quadrature with the instrumental width, we place an upper limit of (FWHM) on the extent of the X-ray western jet perpendicular to the jet axis. The perpendicular distribution of the western jet found from the June data is consistent with that in the March data. The X-ray western jet is clearly much more extended along the jet axis than perpendicular to it.
3.3 Variability
To investigate the variability of the X-ray western jet, we examined archival Chandra data on XTE J1550–564 from June, August, and September 2000. Using a large region extending perpendicular to the jet axis and covering the full extent of the western jet beginning from XTE J1550–564 and extending beyond its position in 2002, we find no evidence for X-ray emission from the western jet in any of the archival observations with upper limits () on the ACIS counting rate which are fractions of 0.10-0.16 of the counting rate in our March 2002 data. Combining the August and September 2000 observations, in which the ACIS was not partially blocked by a grating, we find 6 counts in a total exposure of 9557 s. Given a mean of 6, the 90% confidence upper bound from a Poisson distribution is 9 counts leading to a 90% confidence upper bound on the count rate from the western jet of 0.00094 c/s. This is 6% of the rate in the March 2002 observation, corresponding to an upper bound on the absorbed flux (assuming identical spectral parameters) of in the 0.3–8 keV band. This analysis assumes that none of the counts are due to background. Performing a background subtraction would reduce this limit.
During 2002, the flux decayed between March and June. Using the two flux measurements to calculate the -folding time for an exponential decay, we find . However, two data points are insufficient to determine the shape of light curve decay.

4 Eastern Jet
The new Chandra observations add one additional detection to the results presented in Tomsick et al. (2002). The source contains far fewer counts than the western jet and so we concentrate on the position and flux of the source.
The proper motion of the eastern jet is shown in Fig. 7. The figure includes the three data points from Tomsick et al. (2002) and our new data point for 11 March 2002. Tomsick et al. (2002) showed that the apparent velocity of the eastern jet in 2000 was lower than the minimum velocity allowed during the superluminal ejection (Hannikainen et al., 2001), thus indicating that the eastern jet has decelerated. The March 2002 point is inconsistent with an extrapolation of the velocity measured from the 2000 data and indicates that this deceleration has continued.
We fit the proper motion data with a model in which the jet has a deceleration proportional to its velocity relative to the X-ray binary (which we assume to be roughly at rest relative to the interstellar medium). The velocity profile is then a decaying exponential and the observed position evolution is modified by light travel delays. Our model has three fitted parameters: the initial jet speed divided by the speed of light , the time scale (-folding time) for the velocity decay , and the jet angle relative to the line of sight . The assumed source distance affects the fitted parameters. For a source distance of 4 kpc, we find an adequate fit (shown in Fig. 7) with , , and . For source distances larger than 5.1 kpc, the best fit initial speed is larger than the speed of light. However, we do not consider this a constraint on the distance as the model is rather ad hoc. For a distance of 3 kpc, the best fit is , , and . Both of these fits are consistent with the lower bound on the initial jet speed from the VLBI observations (Hannikainen et al., 2001).

Fig. 8 shows the time variation of the X-ray flux of the eastern jet. The first three points are from Tomsick et al. (2002). For consistency with that analysis, we found the fluxes for the March 2002 data using a circular extraction region of radius centered on the wavdetect position and with an annulus with an inner radius of and an outer radius of for background estimation. We used a powerlaw model with photon index fixed to 1.8 and an absorption column density fixed to and corrected for the degradation in the low energy quantum efficiency of the ACIS. The absorbed flux in the 0.3-8 keV band was . For June, no source was detected by wavdetect at the location of the western jet. We extracted counts from a circular region radius centered at the position found in March. This region is sufficiently large to include most of the diffuse emission apparent in Fig. 4. With spectral parameters fixed as above, the absorbed flux in the 0.3-8 keV band is . We interpret this number as an upper limit on the jet flux in June.
We fit both an exponential decay and a powerlaw decay to the flux data. The powerlaw decay provides a slightly better fit, but both fits are acceptable. The index of the powerlaw decay is . The -folding time of the exponential decay is . The extrapolated flux at the origin of the jet for the exponential decay would be in the 0.3-8 keV band. This is a small fraction of the X-ray fluxes measured during the 1998 outburst. Hence, the available X-ray data are not inconsistent with an exponential decline of flux since the origin of the eastern X-ray jet.
5 Discussion
The discovery of extended radio and X-ray emission from XTE J1550–564 (Corbel et al. 2002b, Tomsick et al. 2002, and the results reported here) represents the first detection of large scale relativistic jets from a Galactic black hole candidate in both radio and X-rays. These large scale jets appear to arise from a relatively brief jet injection episode (Corbel et al., 2002b) and, therefore, offer a unique opportunity to study the large-scale evolution of an impulsive jet event.
In the following, we assume that both jets were created in a single injection episode in September 1998. The assumption is motivated by the detection of superluminal jets (Hannikainen et al., 2001) following an extremely large X-ray flare in September 1998 and the absence of any other X-ray flare of similar magnitude in continual X-ray monitoring from 1996 to 2002 (Corbel et al., 2002b). The eastern jet appears to be the approaching jet based on its larger current separation from XTE J1550–564 (Corbel et al., 2002b). The distance to XTE J1550–564 is constrained from optical observations to be in the range 2.8–7.6 kpc with a favored value of 5.3 kpc (Orosz et al., 2002).
We detected X-ray emission from the western jet on 11 March 2002 (MJD 52344) at a separation of from the black hole candidate implying a projected physical separation of and a mean projected speed of or . From the motion of the jet between 11 March and 19 June, we calculate an average speed at that epoch of or . This is significantly less than the average speed from 1998 to 2002 and indicates that the jet has decelerated. Our detection of motion in the western jet argues against it having reached a termination. The jet appear to have a relativistic bulk velocity.
The angular size of the X-ray emission perpendicular to the jet axis in the western jet is quite small, (FWHM), placing an upper bound on the jet half opening angle of . The opening angle is small, similar to the half opening angles of Fanaroff-Riley class II (FR-II; Fanaroff & Riley 1974) sources which are less than (Muxlow & Garrington, 1991). The angular size of the western X-ray jet perpendicular to the jet axis limits the expansion velocity to less than . At the same epoch, the eastern jet has a projected physical separation of .
For comparison with the properties of the western jet, we review the properties of the eastern jet at the same angular separation. From the linear fit in Tomsick et al. (2002), we find that the eastern jet passed through a separation of on MJD . Fortuitously, this is consistent with the times of the 21 August 2000, and 11 September 2000 Chandra observations (the separations from both of those observations are consistent with ). As discussed in Tomsick et al. (2002), the high proper motion of the eastern jet when at a separation of argues strongly against it having reached a termination at that point. The continued motion of the eastern jet to larger separations demonstrated here reinforces this argument. At a separation of , the apparent speed of the eastern jet was and the absorbed flux was in the 0.3-8 keV band. The western (receding) jet flux at the same separation was a factor of higher than the eastern (approaching) jet flux.
The X-ray data provide measurements of the local apparent speed at equal angular separations from the origin for the approaching and receding jets. If the jets are symmetric, in terms of their velocity profiles, then it would be possible to use relativistic kinematics (Mirabel & Rodríguez, 1999) to constrain the jet true speed , inclination to the line of sight , and distance . We find that and that under the assumption that the jet propagation is symmetric. This would imply that the inclination angle and that the jet speed (allowing for the uncertainty in ).
However, the fact that the western (receding) jet is brighter than the eastern (approaching) jet argues against symmetric jet propagation. For symmetric jet propagation, the ratio of observed flux densities measured at equal separations from the core for a twin pair of optically-thin isotropically emitting jets is
| (1) |
where is the approaching flux density, is the receding flux density, is the jet speed divided by the speed of light, is jet inclination angle, is the spectral index of the emission defined so , and is a parameter which is 2 for a continuous jet and 3 for discrete condensations (Mirabel & Rodríguez, 1999). If the exponent , then the approaching jet must be always be brighter than the receding jet measured at the same angular separation from the core. Given the photon index quoted above (allowing the absorption to vary) and allowing a continuous jet, the minimum allowed value for the exponent is 2.6 which is well above zero. Hence, the observed brightness ratio is inconsistent with symmetric jet propagation. However, because the X-ray jet detections occurred well after the initial jet ejection, we cannot independently constrain the jet ejection, which may have been symmetric.
Large intrinsic asymmetries have been observed in the radio for the jets from the microquasar GRO J1655–40 (Hjellming & Rupen, 1995). Which of the two jets was brighter differed from day to day, while the kinematics of the jet propagation appeared symmetric. Asymmetries of similar magnitude could explain the ratio of X-ray fluxes from the jets of XTE J1550–564 if the jet inclination angle is high. In this case, the X-ray emissivity of the western jet would need to be low early on, to be consistent with the non-detection in 2000, and then increase sharply at later times, to be consistent with the flux measured in 2002. Such an X-ray emissivity profile could be produced by, e.g., internal shocks produced by a faster plasmon overtaking a slower one. This would require re-acceleration of particles in the jet long after its initial ejection.
Alternatively, the emission from the jets could be produced by shocks arising from interactions of the jets with the interstellar medium (ISM). The jets appear to be moving with speeds much greater than the sound speed of the ISM. In this case, the supersonic motion of the jet should produce a shock wave. The shock will be strongest at the head of the head and weaken around the sides of the jet (De Young, 2002). This morphology matches that observed for the eastern jet. In this case, the asymmetry between the two jets may reflect non-uniformity in the ISM. If the western jet is propagating into a denser medium, it would be brighter and would have decelerated more than the eastern jet. Interaction of a relativistic plasmon with the ISM appears to consistently describe all of the available data on the large scale jets of XTE J1550–564.
Continued observation of the jets of XTE J1550–564 offers an exciting opportunity to study the dynamics of relativistic jets on time scales inaccessible for AGN jets. New, deep observations of XTE J1550–564 will allow us to study the deceleration and evolution of the morphology, flux, and spectrum of the western jet. This may help determine whether the observed jets are due to the internal interactions of relativistic plasmons or due to external interactions with the ISM. A deep observation may also permit a new detection of the eastern jet which would further constraint its deceleration and decay. Finally, continued monitoring may eventually show the termination of the jets.
References
- Bautz et al. (1998) Bautz M.W. et al. 1998, Proc. SPIE, 3444, 210
- Corbel et al. (2002a) Corbel, S. Fender, R., & Tzioumis, A. 2002a, IAU Circ. 7795
- Corbel et al. (2002b) Corbel, S., Fender, R.P., Tzioumis, T., Tomsick, J.A., Orosz, J.A., Miller, J.M., Wijnands, R., & Kaaret, P. 2002b, Science, to appear
- De Young (2002) De Young, D.S. 2002, The Physics of Extragalactic Radio Sources (Chicago, University of Chicago Press)
- Dickey & Lockman (1990) Dickey, J.M. & Lockman, F.J. ARA&A, 28, 215
- Fanaroff & Riley (1974) Fanaroff, B.L. & Riley, J.M. 1974, MNRAS, 167, 31
- Freeman et al. (2002) Freeman, P.E., Kashyap, V., Rosner, R., & Lamb, D.Q. 2002, ApJS, in press
- Hannikainen et al. (2001) Hannikainen, D. et al. 2001, Ap&SSS, 276, 45
- Hjellming & Rupen (1995) Hjellming, R.M. & Rupen, M.P. 1995, Nature, 375, 464
- Miller et al. (2002) Miller, J.M. et al. 2002, MNRAS, to appear, astro-ph/0103215
- Mirabel & Rodríguez (1999) Mirabel, I.F. & Rodríguez, L.F. 1999, ARA&A, 37, 409
- Muxlow & Garrington (1991) Muxlow, T.W.B. & Garrington, S.T. 1991, in Beams and Jets in Astrophysics, P.A. Hughes ed., Cambridge Univ. Press, Cambridge, p. 52
- Orosz et al. (2002) Orosz, J.A. et al. 2002, ApJ, 568, 845
- Tomsick et al. (2002) Tomsick, J.A., Corbel, S., Fender, R.P., Miller, J.M., Orosz, J.A., Tzioumis, T., Wijnands, R., & Kaaret, P. 2002, ApJ, submitted
- Sobczak et al. (1999) Sobczak, G.J., McClintock, J.E., Remillard, R.A., Levine, A.M., Morgan, E.H., Bailyn, C.D., & Orosz, J.A. 1999, ApJ, 517, L121
- van Speybroeck et al. (1997) van Speybroeck, L.P. et al. 1997, Proc. SPIE, 3113, 89
- Weisskopf et al. (2002) Weisskopf, M.C., Brinkman, B., Canizares, C., Garmire, G., Murray, S., & Van Speybroeck, L.P. 2002, PASP, 114, 1