2Institut d’ Astrophysique de Paris, 98bis Bd Arago, F-75014 Paris, France
3Johns Hopkins University, Department of Physics and Astronomy, Baltimore, USA
4University of Maryland, Baltimore County, 1000 Hilltop Circle Baltimore, MD 21250, USA
5University of Crete, IESL, FORTH-hellas, 711 10, Heraklion, Crete, Greece
6University of Washington, Dept. of Astronomy, BOX 351580, Seattle, WA 98195, USA
1ES 1927+654: Persistent and rapid X-ray variability in an AGN with low intrinsic neutral X-ray absorption and narrow optical emission lines
Abstract
We present X-ray and optical observations of the X-ray bright AGN 1ES 1927+654. The X-ray observations obtained with ROSAT and Chandra reveal persistent, rapid and large scale variations, as well as steep 0.1-2.4 keV () and 0.3-7.0 keV () spectra. The measured intrinsic neutral X-ray column density is approximately . The X-ray timing properties indicate that the strong variations originate from a region, a few hundred light seconds from the central black hole, typical for type 1 AGN.
High quality optical spectroscopy reveals a typical Seyfert 2 spectrum with some host galaxy contamination and no evidence of Fe II multiplets or broad hydrogen Balmer wings. The intrinsic optical extinction derived from the BLR and NLR are and , respectively. The X-ray observations give an value of less than 0.58, in contrast to the optical extinction values.
We discuss several ideas to explain this apparent difference in classification including partial covering, an underluminous BLR or a high dust to gas ratio.
Key Words.:
galaxies: active - galaxies: Seyfert - galaxies: individual: 1ES 1927+654 - X-rays: galaxies1 Introduction
1ES 1927+654 was first detected as a X-ray source during the Einstein Slew Survey observations with a cumulative 38 s exposure and a count rate of 0.93 s-1 (Elvis et al. 1992). Perlman et al. (1996) have measured a redshift of 0.017 for 1ES 1927+654. They have also demonstrated that the object was not a BL-Lac as previously classified, but a narrow-line radio galaxy. Bauer et al. (2000) have confirmed this and further classified 1ES 1927+654 as a Seyfert 2. The 6-cm radio flux density of 1ES 1927+654 is 16.03 mJy (Perlman et al. 1996) and the optical B magnitude is 15.37. Although the radio to optical flux density ratio is R = 3.3 (c.f. Kellermann et al. 1989), the low radio power of W Hz-1 at 5 GHz confirms its radio-quiet nature. The probability of a relativistic jet causing the extreme X-ray flux variations is very unlikely.
In this paper we report on the X-ray spectra of 1ES 1927+654 obtained with ROSAT and recently with Chandra, as well as on the results of an optical follow-up observation in October 2001. 1ES 1927+654 was detected as a X-ray bright source with extremely rapid and strong X-ray variability in the ROSAT All-Sky Survey (Voges et al. 1999) by a systematic analysis of the X-ray timing properties of All-Sky Survey sources. Additionally, a PSPC pointed observation, during the final days of the ROSAT satellite in December 1998, revealed a strong X-ray flare.
The detection of giant X-ray flares on short time scale of less than about one day is of great importance for the study of the innermost regions of active galactic nuclei. Models for explaining the presence of giant X-ray flares include Doppler boosting effects of X-ray hot spots on the accretion disk (Sunyaev 1973, Guilbert et al. 1983), X-ray flares above the accretion disk (e.g Reynolds et al. 1999) or partial obscuration of Compton thick matter close to the central black hole (Brandt et al. 1999, Boller et al. 1997, Boller et al. 2002). Giant X-ray flares are therefore thought to give independent evidence for the presence of relativistic motions close to the central black hole, similar to the conclusions drawn from the asymmetric Fe line (Tanaka et al. 1995).
Persistent, strong and rapid variability seems to be a rare phenomenon among radio-quiet AGN and has previously been detected only in the narrow-line Seyfert 1 galaxy IRAS 13224–3809 (Boller et al. 1997). The object shows amplitude X-ray variability of a factor greater than 10, on time scales less than about 1 day. The physical origin of giant and rapid X-ray flares is most probably different from the X-ray variability occuring on much longer time scales of years, or longer, in active and non-active galaxies.
A value of the Hubble constant of and a cosmological deceleration parameter of have been adopted throughout.
2 The X-ray properties of 1ES 1927+654
The X-ray properties of 1ES 1927+654 discussed below were obtained with the ROSAT and Chandra satellites. The ROSAT data cover the survey observations carried out between July 1990 and July 1991 as well as a ROSAT pointed observation obtained in December 1998.
For the ROSAT All-Sky Survey observations the source counts were obtained using a circular source cell with a radius of 11.1 arcmin. The number of source plus background counts within this cell was 4255 65. The background was determined from a source-free cell with a radius of 11.5 arcmin, located in the scan direction through the centroid position of the source and centered at R.A.(2000) = , Dec.(2000) = . The number of background counts normalized to the source cell size was 338 18. The net counts are therefore 3917 62, resulting in a mean count rate of 1.22 . For each path of the source through the ROSAT PSPC detector the corresponding background was subtracted.
1ES 1927+654 was again observed during the final observation period of the ROSAT satellite in 1998 December 8 between 18:17:21 UT and 18:41:01 UT with the PSPC detector. The total exposure time was 1338 seconds. This observation was affected by some anomalies (cf. Sect. 2.1 of Boller et al. 2000) and we have performed a careful data quality check to ensure that our results were not affected.
In addition, 1ES 1927+654 was observed with Chandra during the guaranteed time programme. The Chandra observation was performed using the low energy transmission grating spectrograph (LETGS, see Brinkman et al. 2000), which comprises the low energy transmission grating (LETG) and the high resolution camera microchannel plate detector for spectroscopy (HRC-S). 1ES1927+654 was observed from March 20, 2001 at 13:20 UT until March 21, 2001 at 06:58 UT. The total exposure obtained from all good time intervals, corrected for deadtime is 63110 sec. During the whole observation no times with high background were detected. The raw data was reprocessed and the spectrum extracted using CIAO version 2.2.1 and CALDB release 2.15 following the corresponding science threads available at the Chandra X-ray Center111http://cxc.harvard.edu.
The overlapping higher spectral orders were taken into account
by using the LETGS grating response matrices (version July, 2002)
which include 1st to 6th order. Separate files are provided
for the negative and positive
orders222see http://cxc.harvard.edu/cal/Links/Letg/User/Hrc_QE/
ea_index.html.
The fits with the same parameters were performed simultaneously
with the extracted negative and positive orders.
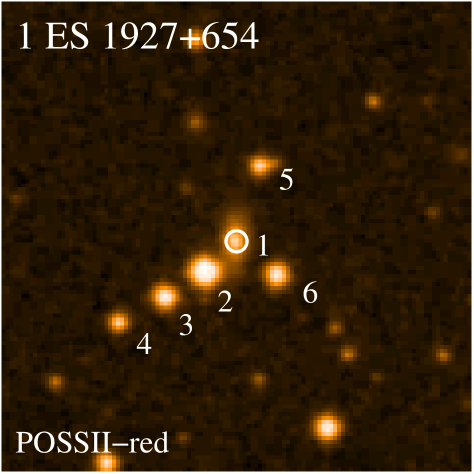
The Chandra X-ray centroid position of 1ES 1927+654 is , which is in excellent agreement with the optical position (c.f. Fig. 9). The positional accuracy is about one arcsec. The unprecedented positional accuracy of Chandra confirms the identification of the strongly variable X-ray source with the distant galaxy. All optically bright objects in Fig. 9 (labeled as 2-6) have been spectroscopically identified as late G or early K stars. This rules out any significant contribution of them to the X-ray flux of 1ES 1927+654. The positional accuracy of ROSAT is less sensitive than Chandra, however, the centroid position of 1ES 1927+654 in the ROSAT All-Sky Survey of R.A.(2000) = , Dec.(2000) = is consistent with the Chandra position.
2.1 The strong, persistent and rapid X-ray variability of 1ES 1927+654
In the following we constrain the timing properties obtained from the ROSAT All-Sky Survey, ROSAT pointed and Chandra observations. The plotted error bars in the light curves correspond to 1 in the Poisson regime (c.f. Gehrels 1986). As a conservative approach we have calculated the total errors of the counts using the relation: .
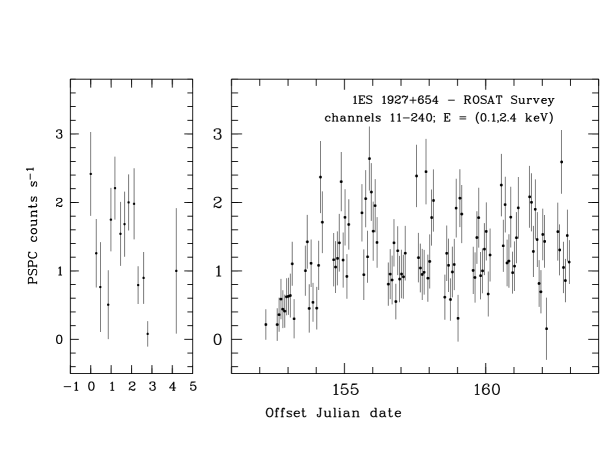
1ES 1927+654 was observed during the ROSAT ‘mini-survey’ for about 5 days between 1990 July 11 and 16 with a total exposure time of 254 seconds. During the normal survey scan operations, 1ES 1927+654 was observed for about 11 days between 1990 December 11 and 21. Fig. 1 shows the ROSAT PSPC survey light curve of 1ES 1927+654. The left panel refers to the ‘mini-survey’ observations in July 1990 and the right panel gives the count rate variations during the survey scan observations in December 1990. During the mini-survey the paths of 1ES 1927+654 through the PSPC detector lasted only between 5.6 and 7.8 seconds and the source passed the PSPC detector 49 times. During the December observations the source passed the PSPC detector 143 times and the exposure times of the individual scans range between 5.6 and 26.1 seconds.
Summing up all paths of 1ES 1927+654 through the PSPC detector during all survey observations, results in a total exposure time of 3200 seconds. Most interestingly are the unusually large amplitude and persistent variability, making this object the second radio-quiet AGN showing this type of behavior, the first being IRAS 13224–3809 (Boller et al. 1997). As the exposure time per path during the ‘mini-survey’ is only about 1/3 of the December 1990 observations, we have rebinned the light curve shown in the left panel of Fig. 1 by summing up three paths of the source through the PSPC detector, resulting in comparable exposure times per data point between the two surveys. The mean separation between the data points is 4.8 hours in the left panel and 1.6 hours in the right panel. Averaging the four data points with count rates below 0.3 , gives a mean number of counts of 3.76 3.12, collected within 22.93 s. The four data points above 2.4 result in a mean number of counts of 60.18 8.80, obtained within a 23.74 s exposure interval. The resulting count rates are 0.164 0.136 and 2.534 0.370 , for the low and high states, respectively. The maximum amplitude variability is of a factor of 15, at a significance level greater than 6 .
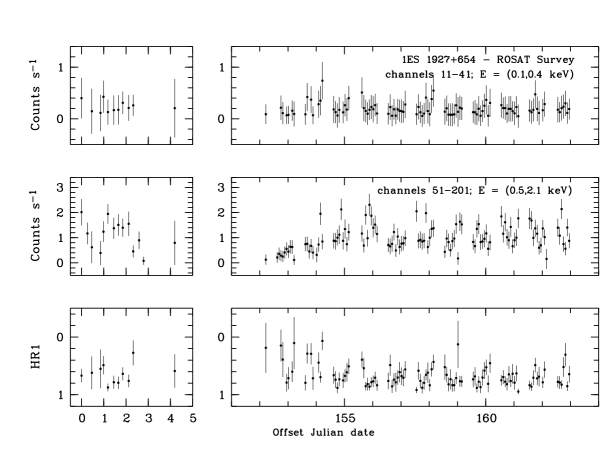
In the following we constrain the spectral variability of 1ES 1927+654 based on the examination of appropriate hardness ratios. In Fig. 2 we show the light curve of 1ES 1927+654 during the 1990–1991 All-Sky Survey observations in the soft (channels 11–41; 0.1–0.4 keV) and hard (channels 51–201; 0.5–2.0 keV) ROSAT energy bands, as well as the resulting hardness ratio light curve. A constant model fit to the data points in the top panel ( = 55.2 for 10 d.o.f) and the middle panel of Fig. 2 ( = 180 for 70 d.o.f) can be rejected with 99.9 per cent confidence. Significant spectral variability is detected during the ROSAT All-Sky Survey observations of 1ES 1927+654. The variations in the soft and hard ROSAT energy bands are not correlated with the variations of the hardness ratio, making it difficult to draw further conclusions of the underlying physical emission mechanism causing the strong X-ray variability. This is confirmed by performing simple power law fits to different count rate intervals (e.g. from 0–1.5 and 1.5–3 ) and finding no significant differences in the photon index. Simple relations as found in other variable AGN, e.g. the source becomes steeper when the flux increases, do not seem to occur in 1ES 1927+654.
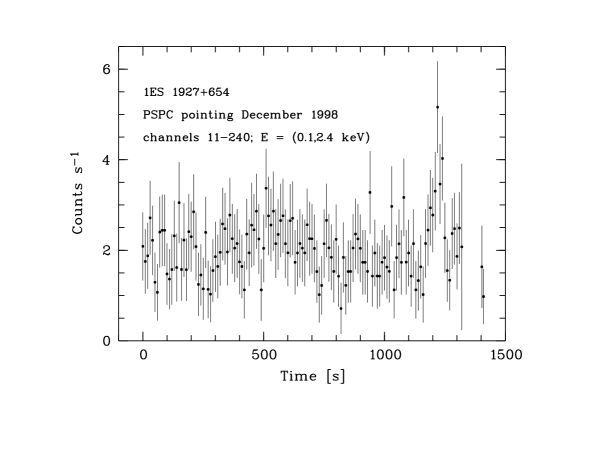
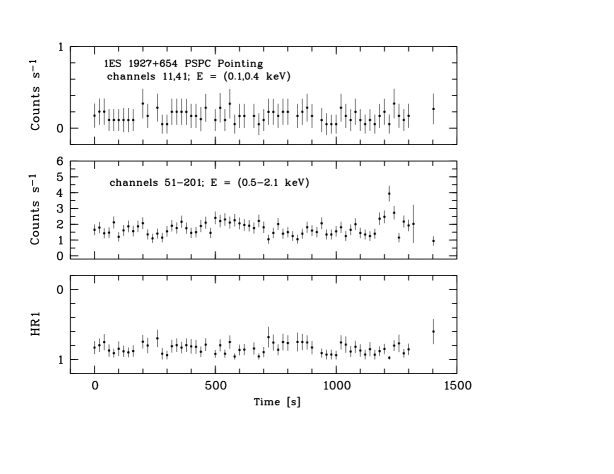
In Fig. 3 we present the ROSAT PSPC light curve on 1ES 1927+654. Using a bin size of 10 seconds, a strong X-ray flare becomes apparent between 1110 and 1280 seconds after the beginning of the observations. The count rate fluctuations significantly exceed that of the variations caused by the ROSAT wobble. We have searched for associated spectral variability during the flaring event. In Fig. 4 we demonstrate that the strong flux variability is not correlated with significant spectral changes, however, the hardness ratio light curve is still significantly variable (a constant model fit can be rejected with 99.9 per cent confidence).
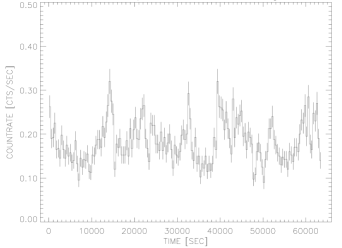
The Chandra light curve (Fig. 5) indicates rapid count rate variations with doubling time scales down to about 400 seconds. The Chandra timing properties further support the interpretation that the variable X-ray emission arises within a few Schwarzschild radii from the central black hole.
2.2 Spectral properties
As described in the previous Section, significant spectral variations are present, however, the count rate changes do not seem to be correlated with the variations in the hardness ratio. The spectral fitting results given below, represent the time-averaged spectra from each dataset in the 0.1–2.4 keV energy band for the ROSAT observations and in the 0.3–7.0 keV band for the Chandra LETG observations, respectively.
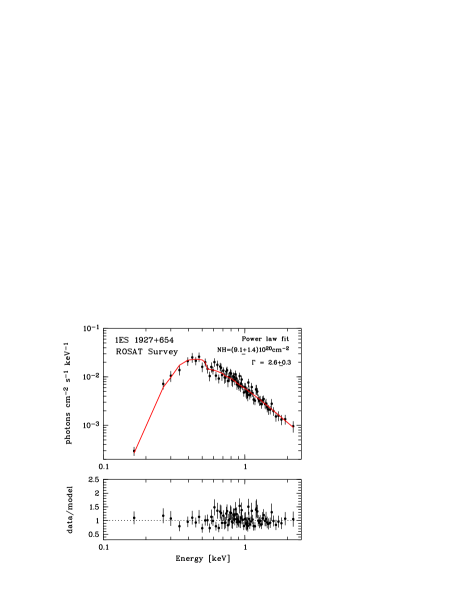
A simple power-law fit, where the absorption column density and the photon index are allowed to be free parameters, provides an acceptable fit to the ROSAT All-Sky Survey PSPC data ( = 66 for 82 d.o.f; cf. Fig. 6). The soft X-ray absorption of is larger than the Galatic column towards 1ES 1927+654 of (Dickey & Lockman 1990; Elvis et al. 1994) at the 3 level. The photon index is 2.6 0.3. These results are robust to changes in the number of data points included in the fit. Using the spectral parameters for 1ES 1927+654, as displayed in Fig. 6, results in a mean 0.1–2.4 keV flux of erg cm-2 s-1, corresponding to an isotropic luminosity of erg s-1.
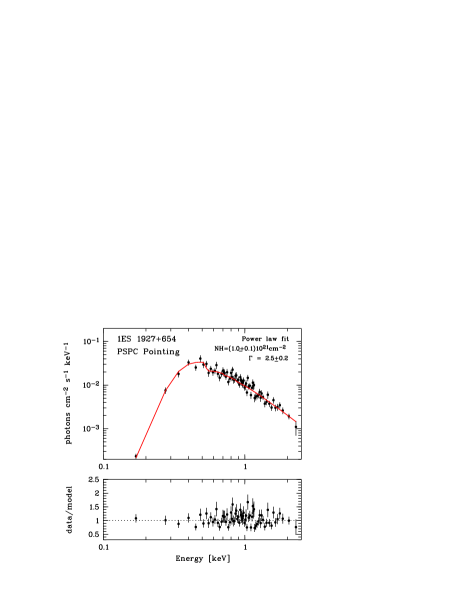
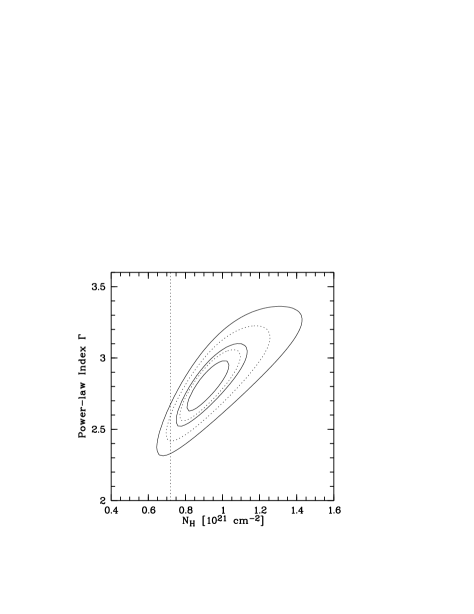
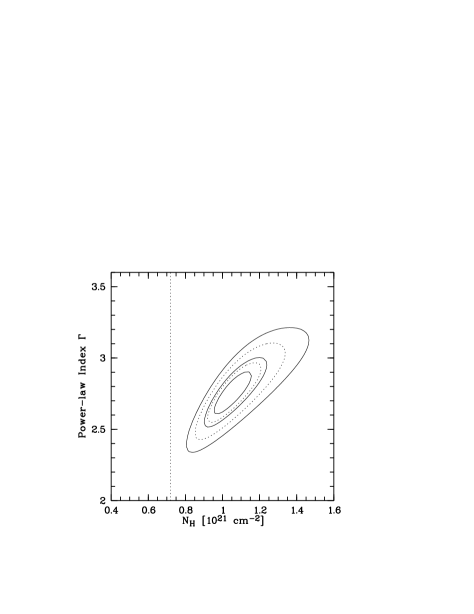
A simple power-law fit to the PSPC pointed observation is shown in Fig. 6 (lower panel). The absorbing column during the pointed observation is in excess of the Galactic column above the 5 limit (Fig. 7). No significant changes in the photon index are detected, however, the mean count rate during the pointed observation is 2.03 , a factor of 2 larger than the ROSAT All-Sky Survey observations in 1990. The isotropic 0.1–2.4 keV energy emitted in the strong X-ray flaring events (c.f. Fig. 3) is .
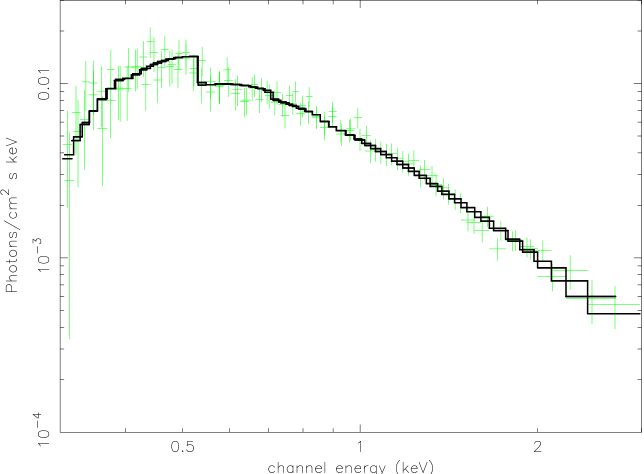
The spectral energy distribution of 1ES 1927+654 as obtained with Chandra can be fitted with a weak black body (accounting for the soft X-ray excess emission) with kT = 0.01 keV and a power law with a photon index of . However, the black body temperature remains unconstrained. A simple power-law model also provides an acceptable fit. If we fix the Galactic absorption to cm-2, we find an intrinsic absorbing column density of cm-2, which is about a factor of 2 greater than that found during the ROSAT observation (however, the difference is less than 2 ). As the Chandra LETG observation gives the highest intrinsic soft X-ray absorption, we use that value for comparison with the extinction values derived from the optical observations. The photon index in the 0.3–7.0 keV band is . The isotropic luminosity in the 0.3 to 7.0 keV band is .
The strongest absorption edge from neutral oxygen at 0.537 keV is clearly visible in the LETG spectrum. To constrain the oxygen abundance relative to hydrogen, we have fitted the spectrum by leaving the oxygen abundance free. The spectral fit is still acceptable but does not significantly improve the spectral fitting results. The oxygen abundance is found to be consistent with solar values. Other element abundances can not be constrained with the present statistics of the Chandra LETG observation.
If we assume that (i) the empirical relation between interstellar X-ray absorption and optical extinction of (Gorenstein 1975) applies to 1ES 1927+654; (ii) that the dust grains are optically thin to X-rays, i.e. that the amount of X-ray absorption by the dust grains is not much different from that by an equivalent mass of material in gaseous form; (iii) that the X-ray and optical radiation travel through the same matter; (iv) that the obscuration is not a strong function of time and (v) a Galactic gas to dust ratio, then the neutral hydrogen column densities derived from the X-ray spectra can be converted into X-ray values. The maximum intrinsic X-ray derived from the ROSAT and Chandra observations is 0.33 (following Gorenstein 1975) or 0.58 (following Predehl and Schmitt 1995).
3 Optical spectral properties of 1ES 1927+654
The optical spectrum of 1ES 1927+654 was taken in June 2001 using the Carelec spectrograph with the 1.93m telescope at the Haute-Provence observatory. The spectral resolution is 6 Å (3 pixels) and the signal-to-noise ratio is about 30.
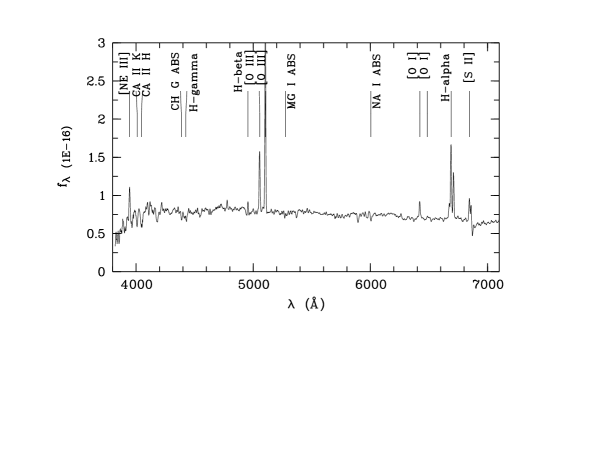
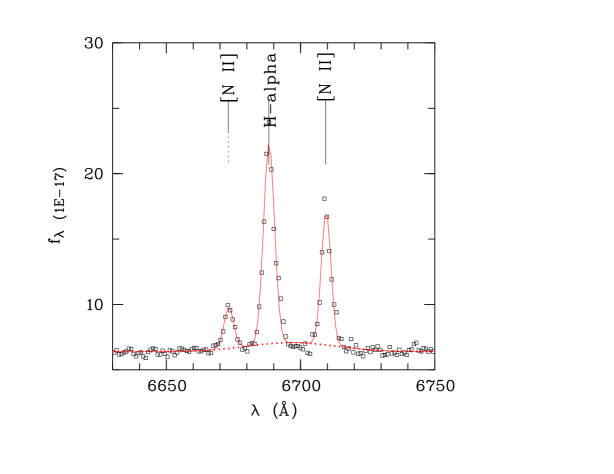
The optical spectrum in Fig. 10 shows narrow emission lines and several galaxy absorption line features of Ca HK , CH G , Mg I , and Na I indicating the presence of a host galaxy continuum. The observed FWHM of most emission lines is about 330 km s-1, which corresponds to the instrumental resolution.
The lower FHWM value of km s-1 for the H line is probably due to the presence of an underlying absorption component, which can barely be seen when the spectrum is displayed at full resolution. The flux ratios of [O III]5007/H, [O I]6300/H, [N II]6584/H, and [S II]/H point to a Seyfert 2 classification using the standard diagnostics of Veilleux & Osterbrock (1987).
The rest frame equivalent widths of the absorption lines CH G and Mg I of Å and Å, respectively, have been used to decompose the spectrum into the power-law featureless continuum and the host galaxy contribution. Assuming an optical spectral index of for AGN and typical rest frame equivalent widths of 3.3 to 5.8 Å for CH G and of 2.4 to 4.8 Å for Mg I (see Goodrich & Osterbrock 1983) we have determined the fraction of the power-law featureless continuum to be between 92 and 97 % at 4800 Å. The optical continuum emission of 1 ES 1927+654 seems therefore to be dominated by the AGN.
From the H to H flux ratio we have determined the optical extinction AV=2.0 in the narrow line region, assuming Case B recombination (see Veilleux et al. 1997). The actual visible extinction may in fact be even lower by a few percent, baring in mind that the H emission line is affected by an underlying absorption, which can not be precisely measured here. While the the optical spectrum does not clearly indicate the presence of a significant broad H component, we have nevertheless tried to fit the H region with an additional component (see Fig. 10, lower panel), to estimate its possible strength. The addition of the broad component does not significantly improve the fit, indicating that the presence of a broad component is not required by the data. The line flux of any possible broad component, has to be lower than 5 per cent of the narrow H component. The equivalent width ofthe narrow H line is 2.4 Å. The central wavelength of this possible broad H emission component is also slightly shifted to the red. We note that the lower signal-to-noise spectrum of Perlman et al. (1996) also did not show a broad component.
Following Goodrich et al. (1994), the non-detection of a significant broad H emission line suggests an extinction value of the Broad Line Region (BLR) of at least = 3.7. Near-infrared spectra of 1ES 1927+654 are required to estimate the upper limit of the extinction of the BLR by the detection of broad emission line components at longer wavelength, e.g. at Br or Br.
The values discussed above refer to the sum of the Galactic and intrinsic extinction. The Galactic value in the direction of 1ES 1927+654 is 0.291 as found in NED. Therefore, the corrected for the Narrow Line Region in the distant AGN is at most 1.71 (or slightly lower if we could correct for the underlying absorption line at H).
4 Discussion
The rapid, giant and persistent X-ray variability of 1ES 1927+654 detected with ROSAT and confirmed by Chandra point to a type 1 AGN classification, i.e. we have a direct view to the central region. The optical spectra, however, give a Seyfert 2 classification with some contribution from the host galaxy. There seems to be a significant discrepancy (factor 6) between the lower limit of the value of 3.7 for the BLR, estimated from the optical spectrum, and the maximum of 0.58 determined from the X-ray spectrum. We note that if the dust is optically thin for X-rays the intrinsic X-ray can not greatly exceed the observed value of 0.58, otherwise we would observe much stronger absorption edges as well as a higher energy soft X-ray cutoff. In this section we will discuss the possible scenarios resulting in this unique combination of X-ray and optical properties.
4.1 An underluminous BLR
One possible explanation for the apparent disagreement in X-ray and optical properties is an extremely underluminous, or even absent, BLR. The luminosity derived for the putative broad H component (see Fig. 10) is about , whereas the total luminosity in the optical -band is about . The typical ratio of emission line to total B-band luminosity in Seyfert galaxies is approximately 1 to 5 per cent (Netzer, private communication), thus we would expect a line luminosity of about in 1ES 1927+654. This may be suggestive of an underluminous BLR.
4.2 An optically thick X-ray absorber and/or higher dust to gas ratios
The true optical extinction might be larger than that derived from the optical spectrum. It is possible that, for example, the dust grains in the absorbing matter could be individually thick to X-rays (cf. Fireman 1974). In this case, the soft X-ray spectrum cutoff does not change with increasing values, i.e. it remains constant in the X-ray observations. In addition, we could have a large self-blanketing factor, in which case the absorbed luminosity from the BLR might be even larger than the value derived in the case where the dust is optically thin to X-rays. We also can not exclude that 1ES 1927+654 exhibits a higher dust to gas ratio than that of about 0.01 derived from interstellar dust to gas ratios (Gorenstein 1975).
4.3 Partial covering phenomena
Partial covering phenomena have recently been detected with XMM-Newton in broad- and narrow-line AGN (1H 0707-495, Boller et al. 2002; IRAS 13224-3809, Boller et al. in preparation; PG 1211+654, Reeves, in preparation, and PDS 654, O’Brien, in preparation). Compton thick material partially covers the central source, resulting in strong neutral or partially ionised Fe K absorption edges, Fe K re-emission features with fluorescent yields below 0.33, and strong soft X-ray emission. However, the limited spectral coverage of the Chandra LETG spectrum does not allow us to constrain partial coverer spectral components. XMM-Newton is required to test this hypothesis. Most probably, the absorbing material has to be Compton thick for X-ray and optical light (cf. Boller et al. 2002), which would not be in disagreement with the optical extinction derived for 1ES 1927+654.
4.4 Non-simultaneous X-ray and optical observations
We note that the X-ray observations were not taken simultaneously with the optical observations and it is possible that the obscuration is a strong function of time. However, this possibility is not very likely as the X-ray observations are spread over a time scale of 12 years which also holds for the optical spectroscopic data (see e.g., Perlman et al. 1996). Whenever we observe 1ES 1927+654 at X-rays, it displays strong and rapid variability. The optical spectrum also shows consistency over time.
4.5 Future observations
Near-infrared spectroscopy is required to further constrain the optical extinction for the BLR in 1ES 1927+654, e.g. observations of Pa, Pa, Br and Br. Assuming that we will detect broad components in these lines, this will allow us to determine upper limits for the value up to about 68 (cf. Goodrich et al. 1994).
We have presented an extreme and unique combination of optical and X-ray properties in 1ES 1927654. Clearly it is crucial to search for similar features in other galaxies. If such features are common in other objects, this will further constrain the range of suitable models.
Acknowledgements.
We would like to thank the anonymous referee for many helpful and constructive comments. This research has made use of the NASA/IPAC Extragalactic Database (NED) which is operated by the Jet Propulsion Laboratory, California Institute of Technology, under contract with the National Aeronautics and Space Administration.References
- (1) Bauer F.E., Condon, J.J., Thuan T.X. & Broderick, J.J., 2000, ApJS 129, 547
- (2) Boller Th., Brandt W.N. & Fink H., 1996, A&A 305, 53
- (3) Boller Th., Brandt W.N., Fabian A.C. & Fink H., 1997, MNRAS 289, 393
- (4) Boller Th., Fabian A.C., Brandt W.N. & Freyberg M., 2000, MNRAS 315, 23
- (5) Boller Th., Fabian A.C., Sunyaev R., et al., 2002, MNRAS 329, 1
- (6) Brandt W.N., Boller Th., Fabian A.C. & Ruszkowski M., 1999, MNRAS 303, 53
- (7) Brinkman A.C., Gunsing C. J. T., Kaastra J. S., et al., 2000, AJ 530, L111
- (8) Dickey J.M. & Lockman F.J., 1990, ARA&A 28, 215
- (9) Elvis M., Plummer D., Schachter J. & Fabbiano G., 1992, ApJS 80, 257
- (10) Elvis M., Lockman F.J. & Fassnacht C., 1994, ApJS 95, 413
- (11) Fireman, E. L., 1974, ApJ 187, 57
- (12) Gehrels N., 1986, ApJ 303, 336
- (13) Goodrich R.W. & Osterbrock D.E., 1983, ApJ 269, 416
- (14) Goodrich R.W., Veilleux S. & Hill G.J., 1994, ApJ 422, 521
- (15) Gorenstein P., 1975, ApJ 198, 95
- (16) Guilbert P. W., Fabian A. C. & Rees M. J., 1983, MNRAS 205, 593
- (17) Kellermann K. I., Sramek R., Schmidt M., Shaffer D. B. & Green R., 1989, AJ 98, 1195
- (18) Perlman E.S., Stocke J.T., Schachter J.F., et al., 1996, ApJS 104, 251
- (19) Predehl P. & Schmitt J.H.M.M., 1995, A&A 293, 889
- (20) Reynolds C.S., Young A.J., Begelman M.C. & Fabian A.C., 1999, ApJ 514, 164
- (21) Sunyaev R.A., 1973, Soviet Astronomy 16, 941
- (22) Tanaka Y., Nandra K., Fabian A.C., et al., 1995, Nat 375, 659
- (23) Veilleux S. & Osterbrock D.E., 1987, ApJ Suppl. Ser. 63, 295
- (24) Veilleux S., Goodrich R.W. & Hill G.J., 1997, ApJ 477, 631
- (25) Voges W., Aschenbach B., Boller Th., et al., 1999, A&A 349, 389