1-2 \Year2003 \Month02 \Pagespan000000 \lhead[0]F.E. Bauer: Title \rhead[Astron. Nachr./AN 324 (2003) 1/2]0 \headnoteAstron. Nachr./AN 324 (2003) 1/2, 000–000
fbauer@astro.psu.edu
The AGN Source Population in the Chandra Deep Field-North Survey: Constraints from X-ray Spectroscopy and Variability
1 Introduction
With the 0.5-10.0 keV background nearly resolved (e.g., Giacconi et al. 2000; Cowie et al. 2002), the emphasis has shifted towards understanding the nature of the faint X-ray population — a clear necessity if we wish to understand the formation and evolution of active galactic nuclei (AGN). Here we report on preliminary spectral and temporal X-ray studies of AGN in the 2 Ms Chandra Deep Field-North Survey (CDF-N; D.M. Alexander et al. in prep). Our sample is comprised of 136 CDF-N sources with 200 net counts (30% of the total CDF-N sample), spanning – ergs cm-2 s-1; 72 sources have known redshifts.
2 Spectra
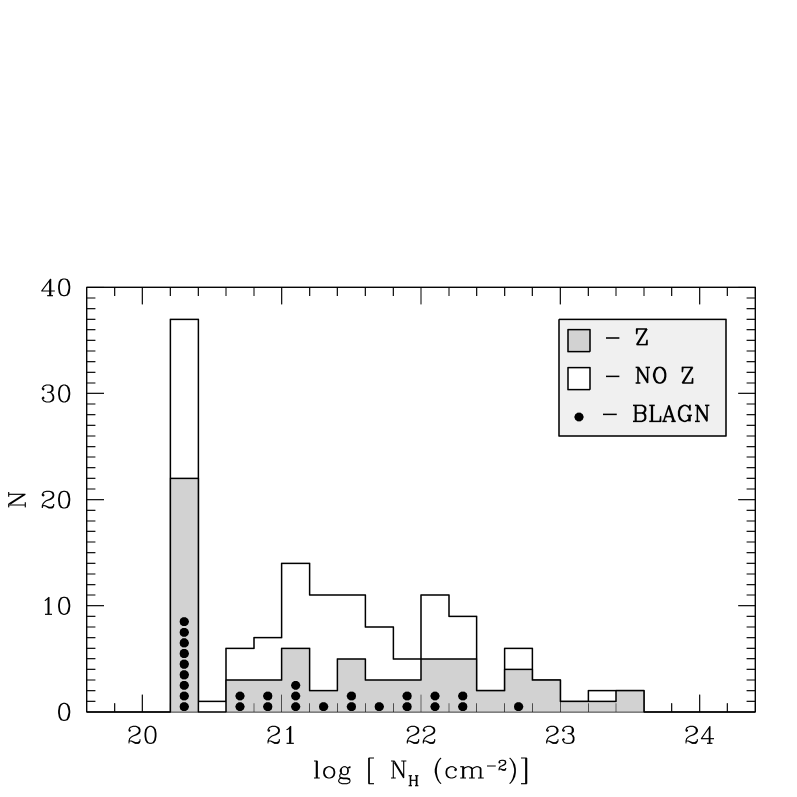
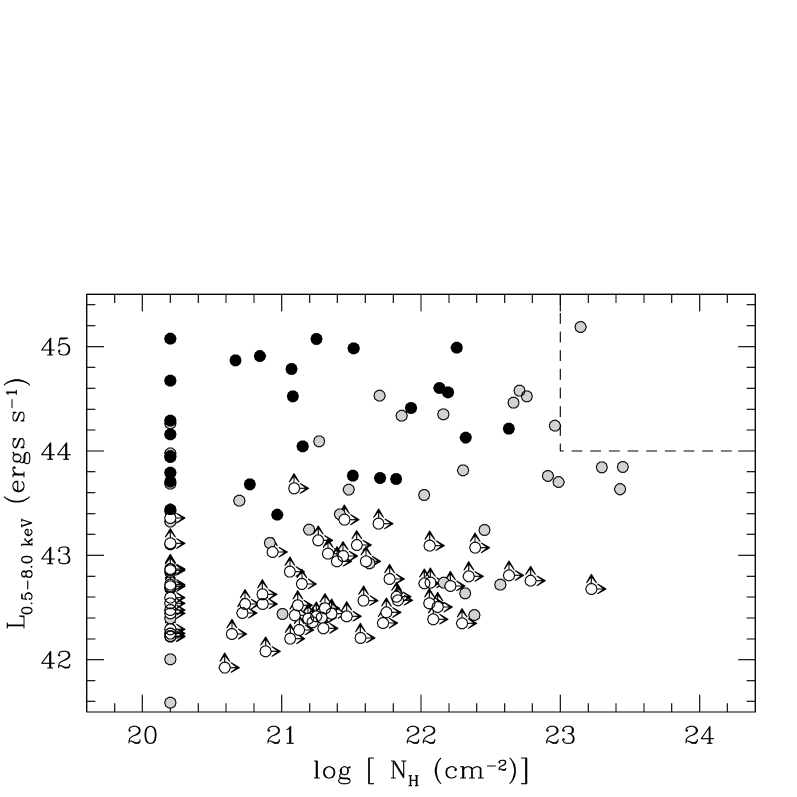
We initially fitted each source with a fixed Galactic ( cm-2; Stark et al. 1992), a variable intrinsic at the source redshift if known, and a simple powerlaw with variable photon index . Approximately 70% of the sources fitted by this model have , with the remaining sources often exhibiting soft excess residuals (i.e., due to a partial covering or thermal component). The median spectral parameters are and cm-2 for all 136 sources, or and cm-2 for the 61 sources with 500 counts. The intrinsic distribution for the sample and a comparison of vs. are shown in Fig. 1. The distribution is strongly skewed towards low/Galactic values with only a small fraction of sources lying above cm-2. The 27 optically identified broad-line AGN (BLAGN) trace the overall sample.
3 Emission Lines
Ten of the 136 AGN (7%) exhibit obvious Fe K emission-line features, with equivalent widths (EWs) of 0.1–1.3 keV. Two of the emission-line sources appear to be Compton thick AGN, displaying both large EWs and extremely flat spectral slopes characteristic of pure reflection (e.g., Maiolino et al. 1998). We have also constrained the number of potential Compton thick sources among the 72 sources with known redshifts. By adding a Gaussian component in the source spectrum ( keV, keV), we can place upper limits on the Fe K EWs. Only 8 of the 72 sources (11%) have 90% confidence EW upper limits above 1 keV, and, of these, none has a measured photon index . Since 50% of all known Compton thick sources have and large EWs can also arise from anisotropic ionizing radiation or variability lags between continuum and line emissions (e.g., Maiolino et al. 1998; Bassani et al. 1999), the true number of Compton thick sources among our spectroscopically identified sources may be even smaller.
4 Variability
The 20 individual CDF-N observations span approximately 27 months and offer an unprecedented probe of long-term X-ray variability in distant AGN. Using both Kolmogorov-Smirnov and statistics, we find that 94% of the BLAGN, 90% of the 500 count sources, and 60% of the overall sample show indications of variability.
Acknowledgments
We gratefully acknowledge the financial support of NSF CAREER award AST-9983783 (FEB, CV, DMA, WNB), NASA grant NAS 8-38252 (GPG, PI), NASA GSRP grant NGT5-50247 (AEH), and NSF grant AST-9900703 (DPS).
References
- [1] Bassani, L. et al. 1999, ApJS, 121, 473
- [2] Cowie, L.L. et al. 2002, ApJL, 566, 5
- [3] Giacconi, R. et al. 2001, ApJ, 551, 624
- [4] Maiolino, R. et al. 1998, A&A, 338, 781
- [5] Stark, A. et al. 1992, ApJS, 79, 77