Nova Populations
Abstract
In this article we review the current status of the stellar population assignment for novae. Observations in the Milky Way and in external galaxies point out the existence of two nova populations: fast and bright novae, mainly originated from massive white dwarfs and associated with the thin disk/spiral arm stellar population, and slow and faint novae, originated from lighter white dwarfs and associated with thick-disk/bulge population.
1 Introduction
Baade baa44 ,baa57 introduced the concept that different kinds of stellar populations have different spatial distribution within galaxies (see also Oort (Oort, )). We can take advantage of this notion to find out useful hints about the population assignments of the progenitors of novae. Due to their luminosity, M novae are particularly suited for this purpose because they can be easily identified both in the Milky Way and in external galaxies.
2 Nova Population in the Milky Way
Historical data on galactic novae (e.g. McLaughlin mcl42 ,mcl45 ,mcl46 and Payne-Gaposchkin gapo ) have received discrepant interpretations. Kukarkin kukas , Kopylov kopy and Plaut plaut pointed out the existence of a concentration of novae towards the galactic plane and the galactic center and classified them as belonging to the ‘disk population’. Minkowskiminko48 , minko50 and gapo showed that the galactic longitudes of novae and planetary nebulae (PNe) have similar distributions and therefore novae, like PNe, belong to Pop II stellar population. Baade baa58 assigned novae to Pop II stellar population because of the occurrence of a few ones (e.g. T Sco 1860) in very old stellar population systems, such as the Globular Clusters. Iwanowska and Burnicki iwa suggested that novae are a mixture of Pop I and Pop II objects, and Patterson pat proposed that novae belong to an ‘old disk’ population. Tomaney and Shafter tom found that novae belonging to the bulge of M31 are spectroscopically different from novae observed in the neighborhood of the Sun and deduced that galactic novae are mainly ‘disk’ objects. Different conclusions were drawn by Della Valle and Duerbeck dvdu who compared the cumulative distributions of the rates of decline for M31, LMC and Milky Way nova populations (see Fig. 1) and found that galactic and M31 distributions are indistinguishable, whereas M31 and LMC distributions are different at significance level. Since the speed class of a nova depends on the mass of the underlying white dwarf (e.g. shara81 ), systematic differences in the distributions of the rates of decline indicate the existence of physical differences between LMC and M31 nova populations. As most novae in M31 are produced in the bulge (Ciardullo et al. ciardu , Capaccioli et al.capa , Shafter and Irbyshaf01 ), one would argue that novae in the Milky Way are also mostly bulge objects.

2.1 Disk and Bulge Novae
The quantitative characterization of the concept of nova populations into two classes of objects, i.e. fast and bright ‘disk novae’ and slow and faint ‘bulge novae’, has been elaborated in the early 90’s by Duerbeck duer90 and Della Valle et al.dv92 ,dv94 , dv95 ,dv98 . The former demonstrated that nova counts in the Milky Way do not follow an unique distribution (Fig. 2), the latter authors showed that the rate of decline (which traces the mass of the WD associated with the nova system) correlates with the spatial distributions of the novae inside the Milky Way (Fig. 3 and 4). Fig. 2 shows that nova counts follow two different trends. Dashed and dotted lines are the predictions from simple disk, , and bulge () nova population models [with A, MV(max), pc-3 yr-1 and , see pat , dvdu , duer84 nay ].

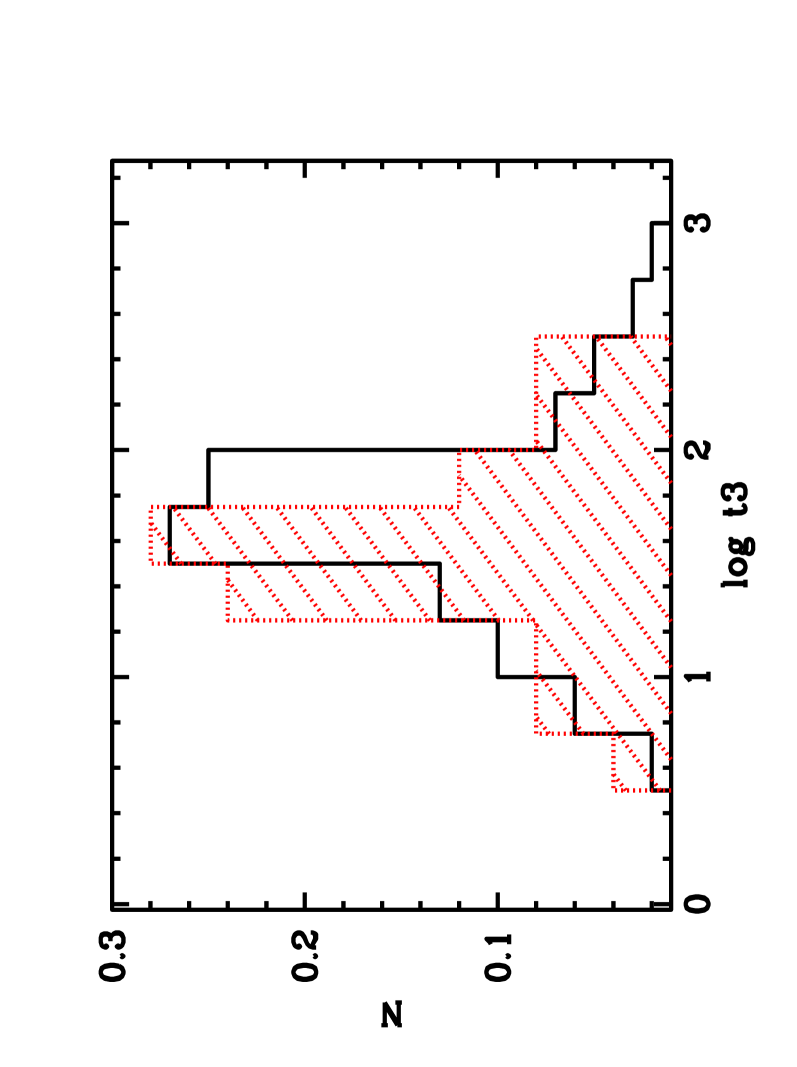
A simple consequence of two population distributions is that the rate of decline is expected to correlate with the galactic longitude. Fig. 3 compares the distributions of t3 for galactic novae in the direction of the galactic anti-center (, dotted region) and center (). The former distribution mainly formed by ‘disk’ novae, peaks at t3, while the latter one peaks at larger t3 because of the contribution of slow ‘bulge’ novae which are viewed in the direction of the galactic center.
2.2 The relationship between the rate of decline and height above the galactic plane for classical novae
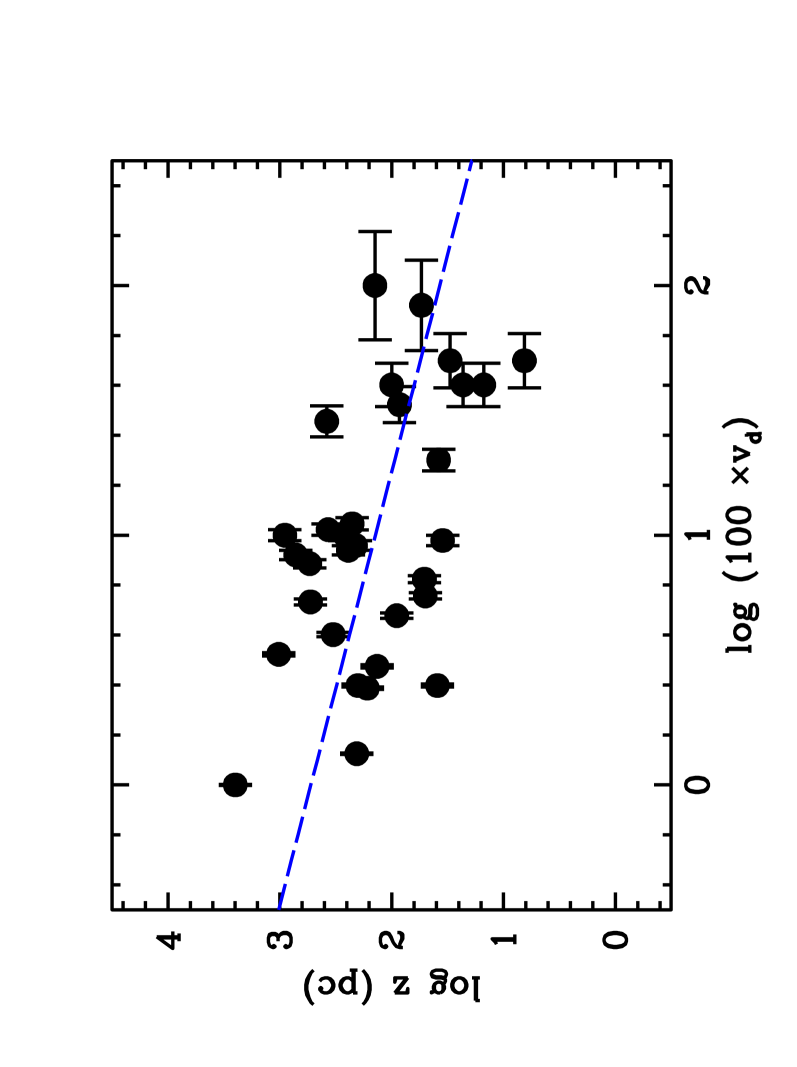
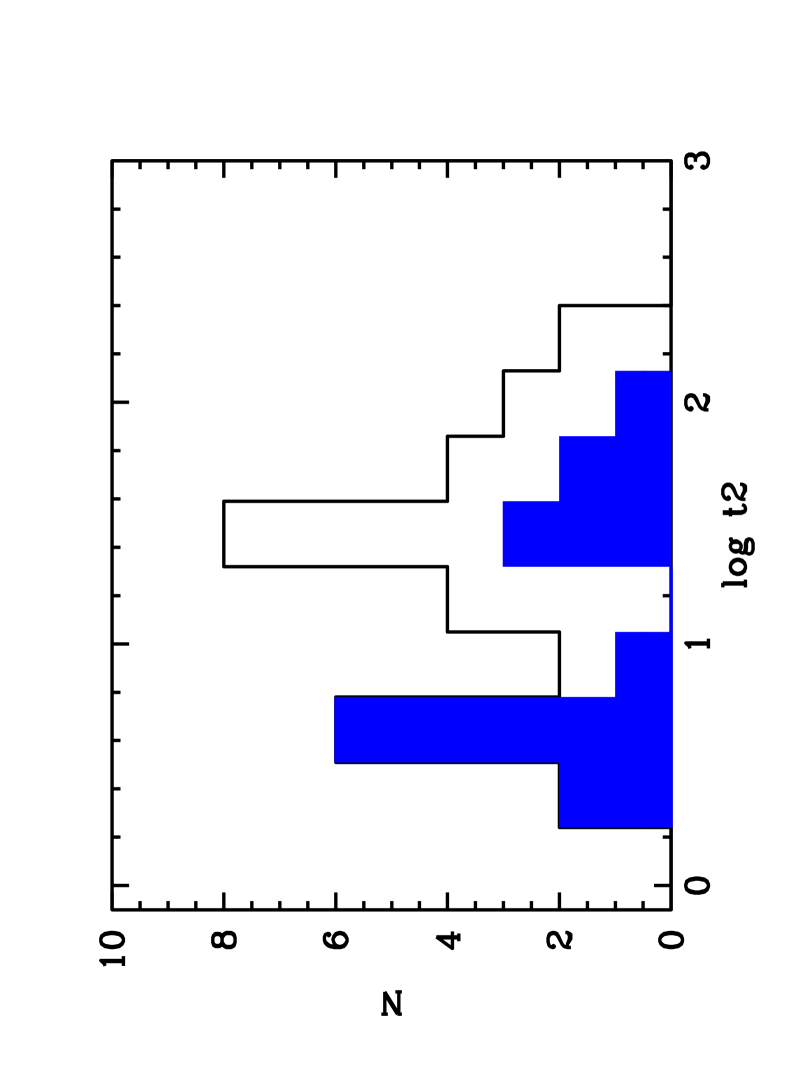
If galactic novae originate from both the bulge and thin disk of the Milky Way, then the masses of their WD progenitors are expected to have heights above the galactic plane systematically different because of the initial-mass/final-mass relationship for WDs (e.g.wei ). This fact can be verified in the following way. Theoretical calculations (star85 , kov , kato ) have established that the strength of the nova outburst is a strong function of the mass of the underlying WD. On the other hand, the luminosity of the nova at maximum (which is representative of the strength of the outburst) correlates with the rate of decline (zwi , mcl39 , dvli ). Thus, the distribution of the rates of decline traces the distribution of the masses of the WDs associated with the nova systems. We note that the distance moduli introduced into (where is the galactic latitude) are derived via expansion parallaxes rather than with the maximum magnitude vs. rate of decline (=MMRD) relationship to avoid circular arguments. For this reason Della Valle et al. dv92 restricted their analysis to a fiducial sample of only 19 objects coming from Cohen & Rosenthal co83 and Cohen co85 out of about a hundred novae for which the rates of decline have been measured with reasonable accuracy. In this presentation we were able to augment the original sample by 11 new objects from sla , dow and ring . Fig. 4 shows the existence (at a confidence level of ) of a relationship between the rate of decline and the height of the novae above the galactic plane, , which can be expressed as , after recalling that (from livio ) and (from dvli ). The trends illustrated in Fig. 4 and 5 indicate that the fastest nova systems, which contain the most massive WDs, are concentrated close to the galactic disk. It is difficult to understand how such distributions could be due to selection effects, since there is no obvious mechanism to prevent the discovery of fast/bright novae at high (although we cannot exclude that some slow/faint nova at small can be heavily absorbed and overlooked). Fig. 6 reports the frequency distribution of the rates of decline (in terms of log t2) for the fiducial sample of novae. The distribution is bimodal and shows that ‘disk’ novae, i.e. objects characterized by pc (shaded region), are mostly ‘fast’ whereas ‘bulge’ novae are mostly ‘slow’. The former distribution peaks at M and the latter at M. The existence of such a bimodality was pointed out by Arp arp also for M31 novae (see his Fig. 36), but this fact was neglected afterwards.

2.3 The spectroscopic differences between disk and thick-disk/bulge Novae
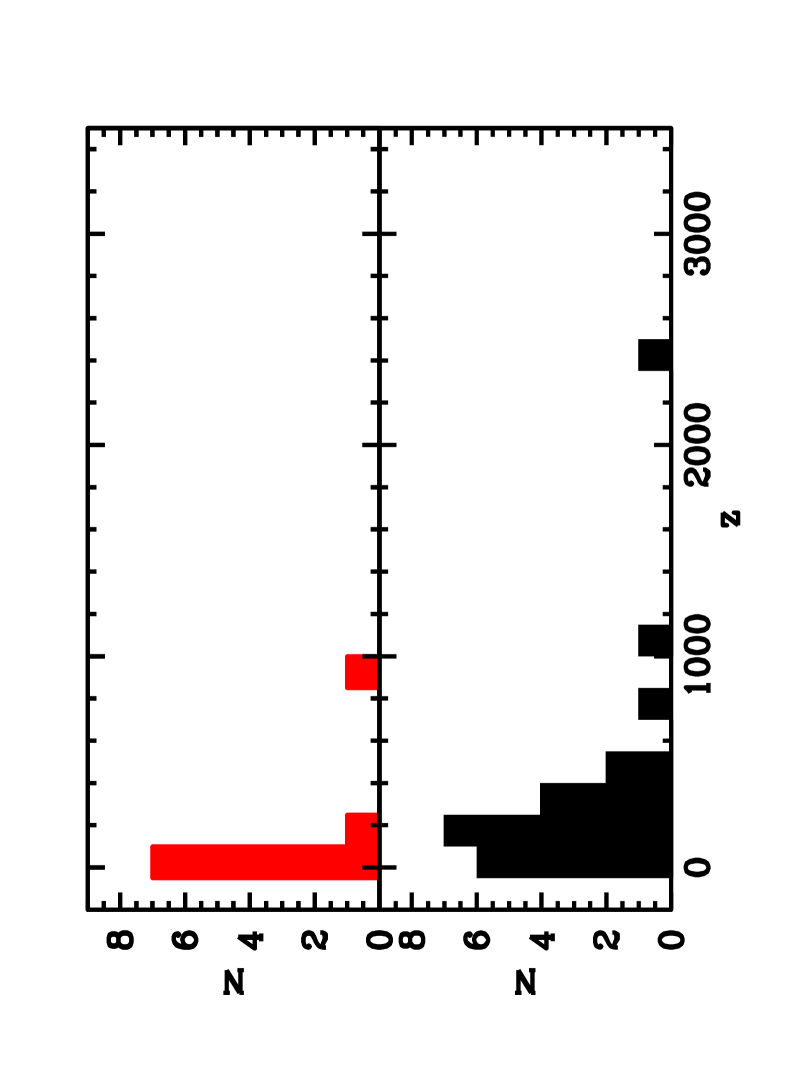
Williams bob after studying about two dozen of galactic novae (and a few objects belonging to the LMC) concluded that novae can be broadly divided into two spectroscopic classes of objects: the Fe II and He/N novae. The former are characterized by slow spectroscopic evolution with expansion velocities km/s (FWZI) and the Fe II lines as the strongest non-Balmer lines in the early emission spectrum. The latter are fast spectroscopically evolving novae, characterized by high expansion velocity ejecta km/s (FWZI) with He and N lines being the strongest non Balmer lines in the emission spectrum near maximum. Hybrid objects (e.g. V1500 Cyg) that evolve from Fe II to He/N are classified as FeII-b (b=broad) and are physically related to the He/N rather than to FeII class. In Fig. 7 we have plotted the frequency distribution of the heights above the galactic plane of the novae of the fiducial sample after being classified according the Williams’ criteria. The top and bottom panels give the distributions of novae which have been classified as He/N (+FeII-b) and Fe II. The histograms show that novae belonging to the He/N class tend to concentrate close to the Galactic plane with a typical scale height pc, whereas FeII novae are distributed more homogeneously up to pc and beyond. A K-S test on the data shows that the two distributions are different at % level. Fig. 7 indicates that the objects previously classified as ‘disk’ and ‘bulge/thick-disk’ novae tend to correspond to the spectroscopic classes introduced by Williams, indeed about 70% of fast and bright novae belong to the He/N (or FeII-b) class, while the slow and faint ones form the main bulk of Fe II class. To explain this behavior one should consider the following. The more massive the WD (for a given and TWD) the smaller is the mass of the accreted envelope (in view of ) the more violent is the outburst (i.e. shorter t3 and higher expansion velocities) and the larger the fraction where is the shell mass ejected at the maximum and is the fraction of the shell mass ejected in the subsequent continuous optically-thick wind phase. Since He/N spectra are formed in the shell ejected at the outburst maximum (as one can infer from the top-flatted profiles of the emission lines, for example) it is very likely that He/N novae are generally associated with massive WDs. If this interpretation is correct the distributions reported in Fig. 7 are simple consequences of the trends reported in Fig. 4 and 5.
3 Nova populations in external galaxies
The use of galactic data to establish the stellar population where novae originate has been often questioned because of observational bias, mainly due to both interstellar absorption in the galactic disk and our position within the Galaxy. These effects can be largely minimized by studying the nova populations in external galaxies, particularly: 1) their spatial distribution; b) the maximum magnitude vs. rate of decline relationship; c) differences (if any) in the nova rates exhibited by galaxies of different Hubble type. The available data are summarized in Table. 1. Col. 1 gives the galaxy identification; col. 2 the nova rate; col. 3 the total B mag of the galaxy corrected for background and foreground absorption; col. 4 the color (B–K); col. 5 the adopted distance modulus; col. 6 the normalized nova rate, i.e. the nova rate per year/; col. 7 the Hubble type. Data come from dv94 and sha00 . Note that to be consistent with the results of MACHOwel and EROSgli teams, who found 4 novae in the SMC after one year of monitoring to search for microlensing events, the nova rate in this system has been estimated, on the basis of simple statistical arguments, to be twice as large as quoted in sha00 .
| Galaxy | Novae/yr | Btot | (B–K) | (m–M) | T | |
| LMC | 0.57 | 2.74 | 9 | |||
| SMC | 2.28 | 2.71 | 9 | |||
| M33 | 5.75 | 2.87 | 6 | |||
| M101 | 8.26 | 3.24 | 6 | |||
| M51 | 8.41 | 3.43 | 4 | |||
| M31 | 3.51 | 3.85 | 3 | |||
| M81 | 7.39 | 3.99 | 2 | |||
| N5128 | 6.32 | 3.38 | –2 | |||
| N1316 | 9.20 | 4.15 | –2 | |||
| M87 | 9.49 | 4.17 | –4 | |||
| VirgoEs | 9.46 | 4.26 | –4 |
3.1 The Spatial Distribution
Due to its closeness, the M31 nova population has been the only one extensively studied. However a simple skimming through past literature reveals the existence of different ideas on its nova population assignment: disk populations (Arp arp , Rosino leo );halo population (Wenzel and Meinunger wenz ); mainly bulge population (Ciardullo et al. ciardu , Capaccioli et al. capa see their Fig. 7); mostly disk population (Hatano et al. hat ).
It is very likely that a fraction of M31 novae considered by ciardu and capa as belonging to the bulge are in fact (according to hat see their Fig. 1 and 4) physically related to the disk and their allotment to the bulge was a simple consequence of neglecting the geometrical projection effect. However Shafter & Irby shaf01 have reappraised the Hatano et al’s conclusions, after comparing the spatial distribution of novae with the background M31 light (see their Fig. 4). They confirm most M31 novae to be originated in the bulge (about up to a minimum of 50%). Concerning this last point a word of caution seems in order as long as the effects of extinction on nova detections in the M31 disk will be fully quantified.
M33 is an almost bulgeless galaxy bot and therefore its nova production necessarily originates in the disk. Particularly Fig. 2 of dv94 shows that most novae appear superimposed on the arms of the parent galaxy. Similar arguments hold for the LMC.
The analysis of 78 plates obtained in the 1950-55 Palomar campaign for the discovery of novae in M81 has been recently published by Shara, Sandage and Zurek mike . These authors find that the spatial distribution of novae in M81 is fully consistent with the two nova populations hypothesis (see their Fig. 1). Particularly they estimate that the fraction of novae belonging to the M81 bulge is not larger than .
3.2 The Maximum Magnitude vs. Rate of Decline Relationship
Fig.8 reports the maximum magnitude vs. rate of decline relationship for LMC, M31 and Virgo novae. A simple glance indicates that the nova production in the LMC is clearly biased towards fast and bright novae, whereas the M31 nova population exhibits a prominent ‘slow’ component. By the same token, admittedly on the basis of a scanty statistic, the trend exhibited by novae discovered in Virgo (Pritchet & van den Bergh vdb ). It is not obvious to explain this behavior in terms of an observational bias: indeed the brightest novae are detected in the nearest galaxy (LMC) and would be missed in the more distant ones (Virgo). On the other hand, the differences in the MMRDs find a simple explanation in the framework of the two nova populations scenario: nova systems in disk dominated galaxies are associated with more massive WDs, then resulting in faster and intrinsically brighter nova events.

3.3 Is the nova rate depending on the Hubble type of the parent galaxy?
Della Valle et al. dv94 suggested that there may exist a systematic difference in the nova rate per unit of K (and H) luminosity in galaxies of different Hubble types (see their Fig. 3 and 4). These authors found that galaxies of late Hubble types are more prolific nova producers than early-type ones by a factor . This overproduction of novae could be the consequence of “selection effects” on the nova frequency (Truran & Livio tru86 , Ritter et al. rit ). For example, if we use the results of rit , we obtain for the ratio of the nova outbursts density, in good agreement with the observations. A possible interpretation is that nova systems in disk dominated galaxies result in more frequent nova events due to the shorter nova recurrence time associated with massive WDs (see tru90 ). However this finding has been put into question by sha00 (see also sharov ) on the basis of nova rates on M51 and M101. Fig. 9 shows the trend of the normalized nova rate vs. (B–K) as derived from Tab. 1. With the exception of M101 and M51 (for which the nova rates reported by sha00 may be lower limits) the normalized nova rate increases from novae yr for early types to about for late types.

4 Conclusions
Both observations of galactic and extragalactic novae converge toward the idea that novae are drawn from two different stellar populations. In particular:
1) analysis of the nova counts and rates of decline inside the Milky Way has allowed to derive the notion of disk and bulge/thick disk nova populations. The typical disk nova is a fast evolving object whose lightcurve exhibits a bright peak at maximum M (t2 or t3) a smooth early decline and belongs to the He/N (or Fe IIb) spectroscopic class. The progenitor is preferentially located at small heights above the galactic plane (pc) and since it is related to (a relatively old) Pop I stellar population, the associate WD is rather massive, M M⊙. The typical bulge/thick disk nova is a slow evolving object whose lightcurve exhibits a fainter peak at maximum, M (t2 or t3), often double maxima, dust formation, maximum standstill and belongs to the Fe II spectroscopic class. The progenitors extend up to pc from the galactic plane and are likely to be related to a Pop II stellar population of the galactic thick-disk/bulge and are therefore associated (on average) with less massive WDs, MM⊙.
2) analysis of the MMRD relationship for LMC, M31 and Virgo novae confirm the existence of systematic differences in the distributions of the rates of decline of the respective nova populations. 80% of novae in the LMC are bright and fast and therefore associated (on average) with massive WDs while fast novae in M31 are %. The two distributions are significantly different (a K-S test gives %). The analysis of the spatial distributions suggests that nova populations in M31 and M81 are a mixture of disk and bulge novae ( and respectively). Novae in the LMC and M33 originate from disk population whereas novae in M87 and NGC 1316 are related ‘a fortiori’ to bulge population.
3) the previous results imply the existence of differences in the age of the progenitors of disk and bulge novae. This has been recently proven by Subramanian & Anupama anup . These authors have studied the star formation history of nearby regions around LMC novae and show that most of them occur in the bar or close to it. They conclude that the parent stellar population of the fast and slow novae are likely to be in the range and Gyr respectively.
4) some of the differences between disk and bulge novae, as described above, are expected on the basis of theoretical arguments (see Kolb kolb , Starrfield et al. star98 , Kato kato2 ).
5) Analysis of the distributions of the rates of decline as a function of the absolute magnitude at maximum of LMC, M31 and Virgo, reveals the existence of a scant group () of super-bright novae which deviate systematically from the MMRD relationship by more than one magnitude dv91 . One possible explanation is that a “super-nova” explosion might occur at the end of the life of a CV (iben , see alsoiben2 ). The recent study on Nova LMC 1991 (star01 ) suggests that the metallicity may be the driving parameter to account for this deviating behavior.
4.1 Future studies
Whether or not the nova rate depends on the Hubble type of parent galaxy is still an open question. If low nova rates for M51 and M101 will be confirmed a possible explanation for the trend reported in Fig. 9 has been pointed out by Yungelson, Livio and Tutukov lev (see also tut ). These authors noted that small are associated with high-mass spirals such as M51 and M101, while high values of are typical of low mass galaxies such as LMC and M33. If the presently observed rates of disk novae in late type galaxies are mainly determined by the current SFRs, one expects to observe differences in the normalized rates of high- and low-mass spirals. Indeed for the former the SFR in the past was several () times higher than the present one (Gallagher et al. gal ). For the latter the SFR was nearly constant over the galaxy lifetime (e.g. Gavazzi & Scodeggio gav ). Therefore high-mass spirals contain a higher fraction of old red stars than low-mass ones and consequently also their IR-luminosity is higher (this is actually observed, see col. 4 in Tab.1). As a consequence, since the K luminosity is proportional to the mass in old stars, one may expect in systems such as M33 or LMC to be higher than that in M51 or M101. It is apparent that this issue will be solved as soon as new nova rates in external galaxies will be made available. For example, preliminary results, based on HST observations (e.g. mike2 ), may suggest high values of nova rates also in elliptical galaxies. We note that nova survey in extragalactic systems, despite their scientific interest, have not been popular among astronomers (although ‘remarkable’ exceptions do exist, e.g. hub ). Probably the main reason for this is the unpredictable nature of nova events, which made nova surveys considerably (telescope) time consuming. However, the coming into operations of 8-10m class telescopes should change this bias. Della Valle and Gilmozzi dv02 have carried out with VLT a pilot programme to discover novae in NGC 1316. They found 4 novae with 3h of observing time (about per nova). A similar programme carried out by vdb with a 4m class telescope on Virgo galaxies (which should have comparable nova rates and distance than NGC 1316) discovered 9 novae in 56h ( per nova). This experiment teaches us that the 8-10m class telescopes equipped with larger and more efficient detectors are able to improve the payoff per night, in terms of nova detections in galaxies outside the Local Group, by on order of magnitude with respect to the previous generation of telescopes.
References
- (1) Baade, W. 1944, ApJ, 100, 137
- (2) Baade, W. 1957, Obs., 77, 164
- (3) Oort, J.H. 1926, Groningen Pub. n.40
- (4) McLaughlin, D.B. 1942, Popular Astr. 50, 233
- (5) McLaughlin, D.B. 1945, PASP 57, 69
- (6) McLaughlin, D.B. 1946, AJ, 51, 136
- (7) Payne-Gaposchkin, C. 1957, in The Galactic Novae, North-Holland publishing Company, Amsterdam, p. 44
- (8) Kukarkin, B.V. 1949, in The Investigation of Structure and Evolution of Stellar Systems on the basis of Variable Stars Study
- (9) Kopylov, I.M. 1955, Izv. Krymsk. Astrofiz. Obs. 13, 23
- (10) Plaut, L. 1965, in Stars and Stellar Systems V, A. Blaauw & M. Schmidt (eds.), University of Chicago Press, p. 311
- (11) Minkowski, R. 1948, ApJ, 107, 106
- (12) Minkowski, R. 1950, Publ. Mich. Obs., 10, 25
- (13) Baade, W. 1958, Ric. Astr. Specola Vaticana, 5, 165
- (14) Iwanowska, W., Burnicki, A. 1962, Bull. Acad. Pol. Sci. Math. Astron. Pys. 10, 537
- (15) Patterson, J. 1984, ApJS, 54, 443
- (16) Tomaney, A.B., Shafter, A.W. 1992, ApJS, 81, 683
- (17) Della Valle, M., Duerbeck, H. 1993, A&A, 271, 175
- (18) Shara, M.M. 1981, ApJ, 243, 926
- (19) Ciardullo, R., Ford, H., Neill, J.D., Jacoby, G.H., Shafter, A. 1987, ApJ, 318, 520
- (20) Capaccioli, M., Della Valle, M., D’Onofrio, M., Rosino, L. 1989, AJ, 97, 1622
- (21) Shafter, A.W., Irby, B.K. 2001, ApJ, 563, 749
- (22) Duerbeck, H. 1990, in IAU Coll. 122, Physics of Classical Novae, eds. A. Cassatella & R. Viotti (Springer Berlin), p. 34
- (23) Della Valle, M., Bianchini, A., Livio, M., Orio, M. 1992, A&A, 266, 232
- (24) Della Valle, M., Rosino, L., Bianchini, A., Livio, M. 1994, A&A, 287, 403
- (25) Della Valle, M. 1995, in Cataclysmic Variables, A. Bianchini, M. Della Valle, M. Orio (eds.), Kluwer Academic Publishers, p. 503
- (26) Della Valle, M., Livio, M. 1998, ApJ, 506, 818
- (27) Duerbeck, H. 1984, ApSS, 99, 363
- (28) Naylor, T., Charles, P.A., Mukai, K., Evans, A. 1992, MN, 258, 449
- (29) Weidemann, V. 1990, ARA&A, 28, 103
- (30) Starrfield, S., Sparks, W.M., Truran, J.W. 1985, ApJ, 291, 136
- (31) Kovetz, A., Prialnik, D. 1985, ApJ, 291, 812
- (32) Kato, M., Hachisu, I. 1989, ApJ, 340, 509
- (33) Zwicky, F. 1936, PASP, 48, 191
- (34) McLaughlin, D.B. 1945, PASP 57, 69
- (35) Della Valle, M., Livio, M. 1995, ApJ, 452, 704
- (36) Cohen, J., Rosenthal, A.J. 1983, ApJ, 268, 689
- (37) Cohen, J. 1985, ApJ, 292, 90
- (38) Slavin, A. J.; O’Brien, T. J.; Dunlop, J.S. 1995, MNRAS, 276, 353
- (39) Downes, R.A., Duerbeck, H. 2000, AJ, 120, 2007
- (40) Ringwald, F.A. 2002, this Conference
- (41) Livio, M. 1992, ApJ, 393, 516
- (42) Arp, H.C. 1956, AJ, 61, 15
- (43) Williams, R.E. 1992, AJ, 104, 725
- (44) Shafter, A.W., Ciardullo, R., Pritchet, C.J. 2000, ApJ, 530, 193
- (45) Welch, D.E. et al. 1999, IAUC, 7121, 7308
- (46) Glicenstein, J.F. et al. 1999, IAUC, 7239, 7286
- (47) Rosino, L. 1964, Ann. Astrophys., 27, 498
- (48) Wenzel, W.., Meinunger, I. 1978, AN, 299, 237
- (49) Hatano, K., Branch, D., Fisher, A., Starrfield, S. 1997, ApJ, 487, L45
- (50) Bothun, G.D. 1992, AJ, 103, 104
- (51) Shara, M.M., Sandage, A., Zurek, D. 1999, PASP, 111, 1367
- (52) Pritchet, C.J., van den Bergh, S. 1987, ApJ, 318, 507
- (53) Truran, J.W., Livio, M. 1986, ApJ, 308, 721
- (54) Ritter, H., Politano, M., Livio, M., Webbink, R. 1991, ApJ, 376, 177
- (55) Truran, J.W. 1990, in IAU Coll. 122, Physics of Classical Novae, eds. A. Cassatella & R. Viotti (Springer Berlin), p. 373
- (56) Sharov, A.S. 1993, AstL., 19, 147
- (57) Subramanian, A., Anupama, G.C. 2002, astro-ph/0203098
- (58) Kolb, U. 1995, in Cataclysmic Variables, A. Bianchini, M. Della Valle, M. Orio (eds.), Kluwer Academic Publishers, p. 511
- (59) Starrfield, S., Truran, J.W., Wiescher, M.C.,Sparks, W.M. 1998, MNRAS, 296, 502
- (60) Kato,M. 1997, ApJS, 113, 121
- (61) Della Valle, M. 1991, A&A, 252, L9
- (62) Iben, I.,Jr. & Tutukov, A.V. 1992, ApJ, 389, 369
- (63) Iben, I.Jr., Livio, M. 1993, PASP, 105, 1373
- (64) Schwartz, Greg J.; Shore, S. N.; Starrfield, S.; Hauschildt, Peter H.; Della Valle, M.; Baron, E. 2001, MNRAS, 320, 103
- (65) Yungelson, L.R., Livio, M., Tutukov, A.V. 1997, ApJ, 481, 127
- (66) Tutukov, A.V., Yungelson, L.R. 1995, in Cataclysmic Variables, A. Bianchini, M. Della Valle, M. Orio (eds.), Kluwer Academic Publishers, p. 495
- (67) Gallagher, J., Hunter, D., Tutukov, A.V.1984, ApJ, 284, 54
- (68) Gavazzi, G., Scodeggio, M. 1996, A&A, 312, L29
- (69) Shara et al. 2002, this Conference
- (70) Hubble, E. P. 1929, ApJ, 69, 103
- (71) Della Valle, M., Gilmozzi, R. 2002, Science, 296, 1275