An Intermediate Redshift Supernova Search
at ESO: Reduction Tools and Efficiency Tests
11institutetext: INAF - Astronomical Observatory of Padova, Vicolo dell’Osservatorio 5,
I-35122 Padova, Italy
22institutetext: Department of Astronomy, University of Padova,
Vicolo dell’Osservatorio 2,
I-35122 Padova, Italy
33institutetext: INAF - Astronomical Observatory of Capodimonte, Via Moiariello 16,
I-80131 Napoli, Italy
44institutetext: European Southern Observatory, Karl-Schwarzschild-Str. 2,
D-85748 Garching bei München, Germany
An Intermediate Redshift Supernova Search at
ESO: Reduction Tools and Efficiency Tests
Abstract
We present the reduction and archiving tools developed for our search for supernovae at intermediate redshifts at ESO as well as the efficiency tests performed. The data reduction recipes developed for the SN candidates selection are described. All the variable sources detected are stored using a MySQL database which enables the identification of previously detected variable sources during past observational runs. Finally, experiments performed with artificial stars have shown that seeing plays a crucial role for the limiting magnitude of detection. Crucial is also the detection threshold used by Sextractor.
1 Introduction
In the last couples of years we have carried out a SN search with the main scientific aim of determining the SN rate at intermediate redshift (for details see the contribution by Altavilla et al. in this volume). For the detection of SN candidates we use the Wide Field Imager at ESO/MPE 2.2m telescope (La Silla, Chile). Our strategy is to obtain deep images in the and bands of 21 different fields, covering a total useful area of square degrees. For the spectroscopic confirmation of the SN candidates we use FORS1/2 at ESO VLT. Due to the restriction of time allocation with the VLT only a subsample (the brightest candidates) could be spectroscopically confirmed.
2 Data Reduction
Pre-reduction.
For each search field we take three exposures of 900s with a dithering of few arcsec. This allows to remove cosmic rays, detector cosmetic defects and moving objects. The pre-reduction, bias and flat fielding, are performed using IRAF and MSCRED111MSCRED is an IRAF package designed to deal with mosaic images in multi-extension fits (MEF) format. See the manual by F. Valdes for further details.. Whenever it was possible, standard sky flats are improved by constructing a super flat using the science frames. To combine the dithered frames, these are mapped to a common geometrical grid, properly scaled in intensity and finally stacked. An accurate astrometric calibration (rms arcsec) is attached to the stacked image using the USNO2 catalogue. The astrometry is used to identify each object in the fields.
Image Subtraction.
Our SN search technique is based on the subtraction between the image of a given field and a template image obtained at a previous epoch. The frame to be searched and the template are first geometrically matched and trimmed to the overlapping area. To perform the image subtraction we make use of the ISIS 2.1 package Alard98 . First, ISIS computes the convolution kernel to match the image with the best seeing to the other, then the frames are photometrically scaled and subtracted. Our experience is that, in any case, the best results are obtained if the two images have similar seeing.
SNe Candidates Selection.
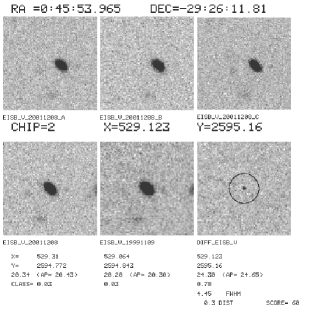
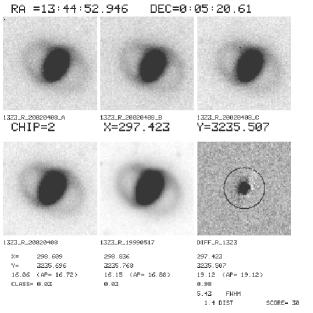
To search the difference image for residuals due to variable sources we use Sextractor sex . This produces a list which, in general, is heavily contaminated by spurious detections due to residuals of bright/saturated stars, poorly removed cosmic rays and detector cosmetic defects. In a typical field (eight frames) over a thousand detections are usually found. To clean as much as possible the spurious detections we have developed an automatic procedure which attributes a score to each detection based on several parameters (see the next section). After some experience with the WFI frames, the scores were calibrated through artificial star experiments. The aim is to drastically reduce the number of candidates which are finally verified by direct inspection. Eventually, after visual inspection we attach a provisional classification (supernovae, active galactic nuclei, variable stars and moving objects) to each reliable variable sources after considering all the available informations like the stellarity index or the distance from the host galaxy nucleus. Figure 1 shows our search software output for a confirmed SN (SN 2001io) and an AGN.
Scoring algorithm.
The scoring procedure takes into account several parameters measured by Sextractor in the new, template and subtracted images. Saturated objects produce many spurious residuals in the subtracted image so the first step is to purge the list from all detections which are located near bright sources. A rank list of the remaining detections is then created according to: the stellarity index measured by Sextractor, the FWHM of the object with respect to the mean, the distance of the residual with respect to the center of the associated object, if any (the host galaxy in the case of SN) and the difference between the object magnitudes measured with different prescriptions. After some tuning we were able to obtain that the scoring algorithm reduces the detection number of a factor 10 without significant loss of efficiency in the detection of good SN candidates.
3 Variable Sources and SN candidates Database.
Our search technique detects SN candidates but also other variable sources like AGN, QSO and variable stars. To reduce such contamination as much as possible we exploit the variability history of the fields: the fact that each of our monitored fields has been observed several times enables us to remove from the follow–up list the long term variable sources which are not SN.
To record all the detected variable sources and check their variability history, we developed a MySQL database with a web user interface. The database contains all informations for each field, the observed epochs and the complete list of the variable sources detected. During an observing run, with a simple database query from the web interface, it is possible to check if a given object has already been detected in the past. We found that this tool is very effective for the removal of AGNs, which are the only source of contamination we found. This translates into high efficiency in term of telescope time spent on targets of interest.
4 Artificial Star Experiments
In order to obtain an accurate estimate of the search efficiency control time, which is needed to derive SN rates (cf. by Altavilla et al. in this volume), we need to construct the completeness curve as a function of magnitude for any given observation. To build this curve we performed a number of artificial star experiments. Artificial stars with the proper PSF and with different magnitudes were added to a given image, which is then searched using the same recipe, as for the real search. These stars were added to each galaxy of the frame. The distances from the host galaxy nucleus are distributed randomly assuming a gaussian distribution with equal to the FWHM/2.36 of the galaxy profile. To test the dependence of the SN detection efficiency from the seeing we ran several artificial star experiments on images of the same field taken at seven different epochs and with seeing in the range 0.65–1.32 arcsec (left panel of Figure 2).
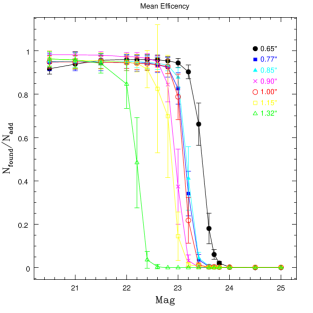
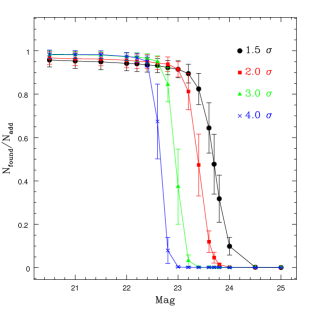
For a given seeing, the efficiency drops abruptly from 95 to 5 in less than mag: this helps defining a limiting magnitude for each observation because a variation of few tenths of the limiting magnitude has a negligible effect on the control time. We define as limiting magnitude the point where the detection efficiency is 90%. It turns out that an improvement of the seeing of a factor 2 arcsec increases of about 1.5 mag the magnitude corresponding to a given efficiency. Also, in order to check the dependence of the detection efficiency on the threshold adopted during the search we ran four experiments on the epoch with 0.90 arcsec seeing using different thresholds (in units of the background rms). The different detection efficiencies obtained are shown in the right panel of Figure 2. As expected, the limiting magnitude is fainter for a lower threshold, mag for compared with . However, using a lower threshold has the important drawback of increasing significantly the number of spurious detections. Usually a – threshold is a reasonable compromise. Further experiments will be performed to check for variations in efficiency between different fields.
References
- (1) C. Alard, R.H. Lupton: ApJ 503, 325 (1998)
- (2) E. Bertin, S. Arnouts: A&AS 117, 393 (1996)