11email: ettoref@oapa.astropa.unipa.it, giusi@oapa.astropa.unipa.it, sciorti@oapa.astropa.unipa.it
Observational clues for a role of circumstellar accretion in PMS X-ray activity
We revisit the published analyses of ROSAT X-ray observations of the star forming regions NGC 2264 and Chamaeleon I ( and Myr old respectively) in the light of newly published optical data. At odds with previous results on Chamaeleon I members, we find that low mass stars in both regions have near-saturated emission levels. Similarly to what previously found in the Orion Nebula Cluster, Weak Line T-Tauri Stars in NGC 2264 and in the Chamaeleon I cloud have higher X-ray activity levels respect to Classical T Tauri Stars, arguing in favor of a role of the disk and/or accretion in determining X-ray emission.
Key Words.:
Stars: pre-main sequence – X-rays: stars – Accretion, accretion disks – open clusters and associations: individual: Orion Nebula Cluster, NGC 2264, Chamaeleon I1 Introduction
The influence of accretion disks surrounding young PMS stars on their observed X-ray activity levels is presently debated. The topic has been investigated many times through imaging X-ray observations of star forming region but contradictory results are reported. Mentioning just a few recent examples, Feigelson et al. (2002) analyze Chandra ACIS-I data finding no indication that the presence of an accretion disk modifies activity levels of Orion Nebula Cluster (ONC) stars. The same negative result, although somewhat controversial, is reported for IC 348 members by Preibisch & Zinnecker (2001, 2002), also using Chandra ACIS-I observations; by Lawson et al. (1996) for the Chamaeleon I cloud using ROSAT PSPC data; by Flaccomio et al. (2000) for NGC 2264 using the ROSAT HRI; by Grosso et al. (2000) for Ophiuchi again with the ROSAT HRI; by Getman et al. (2002) for NGC 1333 (ACIS-I).
On the other hand, Classical T-Tauri Stars (CTTS) belonging to the Taurus-Aurigae association are found to be sub-luminous in the X-ray band respect to Weak Lined T-Tauri Stars (WTTS) by both Neuhäuser et al. (1995) and Stelzer & Neuhäuser (2001). Flaccomio et al. (2002b), using Chandra HRC-I data, report a similar result, with high statistical confidence and at odds with Feigelson et al. (2002), for the rich ONC population. Other indications of a difference between CTTS and WTTS have been found in X-ray band variability characteristics and spectra. Namely, Stelzer et al. (2000) in Taurus-Aurigae, Flaccomio et al. (2000) in NGC 2264 and Flaccomio et al. (in preparation) in the ONC, all find that CTTS are more variable than WTTS. Some studies have also indicated that CTTS may have different X-ray spectral characteristics respect to WTTS: Tsujimoto et al. (2002) find that the mean for CTTS is about 3 keV, compared to for WTTS. Such a large difference may in part be due to a selection effect: in the X-ray selected sample of Tsujimoto et al. (2002) class II sources (CTTS) are significantly more absorbed respect to class III-MS sources (WTTS) and it is therefore possible that only the hardest CTTS have been observed. Other contrasting indications have been also presented: Kastner et al. (2002), using high resolution X-ray spectra of the 10Myr old CTTS TW Hydrae, derive a differential emission measure distribution peaking at keV and propose that the emission mechanism is related to matter accretion. No systematic difference in between CTTS and WTTS is observed by Preibisch & Zinnecker (2002) in IC 348 members.
Are these contradictory results due to real differences between different star forming regions or to the different approaches used in analyzing and interpreting data? We will touch upon four important points that can affect the result: 1) accounting for the mass/ dependence of PMS activity; 2) choosing a relevant accretion/disk indicator; 3) avoiding selection effects in the reference stellar sample; 4) converting observed X-ray photon detection rates to X-ray luminosities.
Mass/ dependence.
It is possible that the failure to detect a difference in activity levels between stars with different circumstellar/accretion properties is due to the fact that the activity levels are also influenced by other stellar characteristics, and the various contributions have not been disentangled. In particular a dependence of mean on stellar mass (or bolometric luminosity) has been widely found for PMS stellar groups. Most of the studies mentioned above compare the X-ray Luminosity Function (XLF) of CTTS with that of WTTS, both XLFs being computed from stellar samples comprising a wide range of masses. Such a procedure tends to hide possible differences because: 1) the presence and/or magnitude of the effect sought might depend on stellar mass; 2) if a different mass- relation holds for these two classes, stars having the same , but different mass, will contribute to both XLFs. A more sensible approach, in order to eliminate this source of confusion (see e.g. Flaccomio et al. 2002b), is to compare XLFs of stars in restricted mass ranges; this however requires, for meaningful statistical comparisons, sufficiently large samples of well characterized members. To the same effect, considering that the ratio is, for low mass PMS stars (), on average much less dependent from mass than (e.g. Flaccomio et al. 2002b), it is also sensible to compare the distributions of this latter parameter for the two classes. As an added advantage, is arguably less sensitive to interstellar extinction corrections (although the newly introduced variable, , also carries non-negligible uncertainties). Both of these approaches were successfully followed by Flaccomio et al. (2002b) to establish the difference in activity levels between accreting and non-accreting ONC members.
Disk/accretion indicator.
There is no widespread consensus on which indicator of presence of disk or of accretion is to be used to search for effects on activity levels. Some studies have correlated X-ray data with accretion indicators, such as the or line emission. Others have instead employed circumstellar disk indicators such as near IR excesses (in K or L band). The relation between presence of disks and matter accretion phenomena is not yet fully understood. A statistical correlation between accretion and disk indicators is generally observed but it seems clear that not all IR detected disks are associated with accretion and it is also possible that the presence of accretion is not always related to a near-IR detectable disk (e.g. because of a large inner disk hole that suppress the K band excess or because of the disk view-angle). It is presently unclear whether X-ray emission levels are influenced by one (or both) of the two phenomena. It seems therefore reasonable to explicitly distinguish between the two. As a clarifying example, Preibisch & Zinnecker (2002) find statistically significant evidence that accreting stars in IC 348 have lower respect to non accreting ones, but no evidence of a difference between stars with and without color excess (a disk indicator). They consider these two results contradictory, maintain that the infrared excess gives a more realistic picture of the circumstellar properties of the T Tauri stars than the emission111The reason Preibisch & Zinnecker (2002) do not trust as an indicator are its time variability and the fact that part of the flux can be of chromospheric origin. However variability should if anything tend to lower the significance of the difference between CTTS and WTTS and the chromospheric origin of part of the flux should at most produce an effect opposite to that observed: the sample of strong stars, interpreted as accreting stars, will be indeed contaminated by chromospherically active stars, which are also likely to have high coronal activity and thus . and attribute the detected difference in X-ray luminosity functions to selection biases. An alternative point of view would be that accretion and not the presence of an IR-detectable disk influences X-ray activity and the two are not simply related. We note that in other cases in which a difference in activity levels is reported the distinction was performed on the basis of accretion indicators: in Taurus (e.g. Stelzer & Neuhäuser 2001) and in the ONC (Flaccomio et al., 2002b).
Parent sample selection.
Ideally, a complete and not-contaminated sample of members of a given SFR should be used to investigate the matter. However, this is in practice hardly possible. Understanding selection biases is therefore crucial: in the case of IC 348 discussed above, Preibisch & Zinnecker (2002) suspect that strong, easily detectable emission may favor the inclusion in the reference stellar sample of optically (and X-ray) faint accreting stars and therefore artificially depress the mean of CTTS. This, i.e. selecting members on the basis of their circumstellar/accretion properties, or in any other way that favors the selection of faint CTTS over that of WTTS, is indeed the main risk to be avoided, or accounted for, in such a study. Taking the approach of dividing the whole sample in narrow mass ranges (see above), this problem, usually worse for low mass, low stars, is reduced for the higher mass ranges. Other member selection methods, are not likely to result in spurious results: selection through sensitivity limited X-ray observations, for example, will sample to the same minimum both CTTS and WTTS (assuming similar X-ray spectra and absorptions), so that if the two underlying (i.e. complete) XLFs do not differ, the detection fraction of both classes will be the same and the two distributions of observed will not differ either. Inclusion in the reference sample of contaminating non-members, usually low stars, will depress the mean activity levels inferred for non accreting/disk-surrounded stars, therefore going in the direction of producing the opposite result respect to the observed one.
X-ray count-rate to conversion.
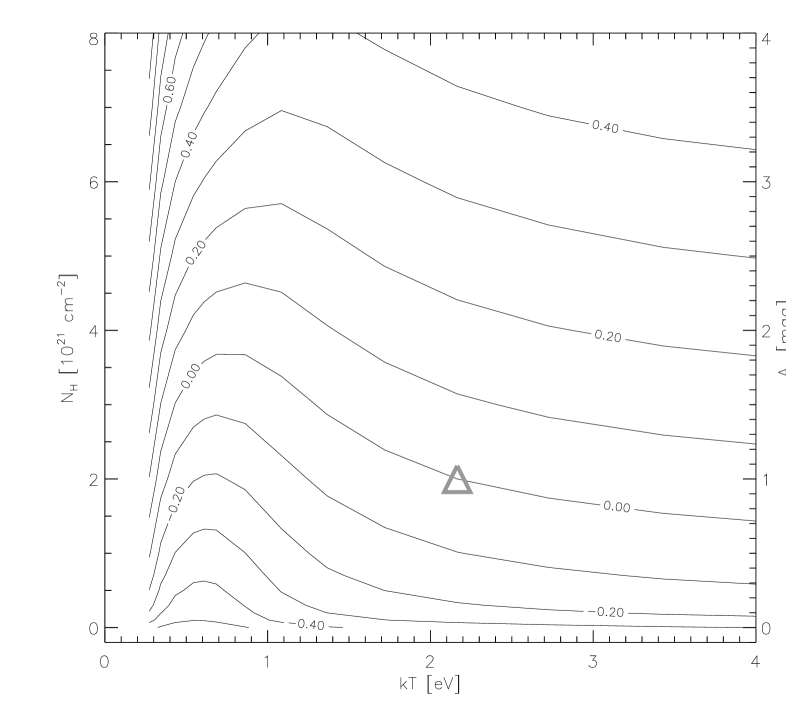
X-ray telescopes detect photons in wide energy ranges. The conversion between detected count-rate and X-ray luminosity depends therefore on the incoming spectra. Given the low statistic of most X-ray sources with present day instruments and/or the lack of spectral resolution of some X-ray detectors, it is necessary to assume a source spectrum.222Even in the case of detectors with intrinsic spectral resolution, the low source counts practically prevent in many cases the determination from the data of a reliable spectral model. For coronal sources this usually reduces to assuming the of a thermal emission spectrum and the hydrogen column density, , of the absorbing material between the source and the observer. Differences in the way these two parameters are estimated can lead to significantly different conversion factors and therefore affect the result of our search for a difference between CTTS and WTTS. On one hand, systematic differences in the X-ray spectra ( and ) of CTTS and WTTS might result, if not properly accounted for, in spurious results regarding the different X-ray luminosity of the two classes.333Differences in the intrinsic spectra would however be interesting ”per se” for the understanding of the physical mechanism that determines X-ray emission. On the other hand, significant random errors in the conversion could easily wash out an existing correlation between and accretion/disk indicators. In the works of Feigelson et al. (2002) and Getman et al. (2002), for example, the evidence presented against a difference of WTTS and CTTS is obtained using detector plane (non absorption-corrected) X-ray fluxes. Likewise Lawson et al. (1996) and Flaccomio et al. (2000), also obtaining a negative result, assume a single count-rate to flux conversion factor and therefore neglect any difference in absorption between sources. Flaccomio et al. (2002a, b) on the other hand, although assume a single for all sources, correct for individual absorption values (), finding a positive result. Stelzer & Neuhäuser (2001) also correct for absorption (through a low energy hardness ratio) and find a positive result. Is it possible that a peculiarity in the vs. relation or in the intrinsic spectra of CTTS and WTTS results in artificially lowering the luminosities derived for CTTS respect to those derived for WTTS? Regarding the relation between X-ray and optical extinction, recent studies correlating , derived from X-ray medium resolution spectra, and optically derived confirm the relation between the two and do not evidence any such difference (cf. Imanishi et al., 2001; Flaccomio et al., 2002a; Feigelson et al., 2002; Kohno et al., 2002). It is however possible, although presently not still fully established, that CTTS have harder X-ray spectra respect to WTTS (Tsujimoto et al., 2002). We may wonder how a different would affect the luminosities we derive. Figure 1 shows the value of the conversion factors for the ROSAT HRI, as a function of and . Qualitatively similar plots are obtained for the ROSAT PSPC and for the Chandra HRC-I, the two other instruments used for the observations discussed later in this paper. We observe that, for a given source , the difference in , if eventually confirmed, will indeed go in the direction of decreasing the inferred of lower sources respect to high ones, thus potentially accounting for part of the observed differences between CTTS and WTTS. However it is also clear that for typical the mistake committed in not accounting for individual source temperatures could be at most of the order of dex, smaller than the difference between CTTS and WTTS found by Flaccomio et al. (2002b) in the ONC. We stress however that even if this effect were to be confirmed, therefore reducing the actual difference in luminosities respect to that inferred assuming a single , the difference between the X-ray emission of CTTS and WTTS would be confirmed, and the spectral differences would provide additional clues for the understanding of its physical origin.
In this paper, keeping the above four points in mind, we further discuss and extend the evidence for a role of accretion and/or disk in determining the observed X-ray activity level of ONC members, as already reported by Flaccomio et al. (2002b). In the light of newly available optical/IR data we then critically reanalyze the results obtained by Flaccomio et al. (2000) and Lawson et al. (1996), both of which concluded that stars surrounded by disks, in NGC 2264 and Cha I respectively, have the same activity levels as those that do not have a disk. Here we derive the opposite result.
The structure of this paper is as follows: in Sect. 2 we discuss the new observational evidence for a difference in activity levels between CTTS and WTTS belonging to the ONC. In Sect. 3 and Sect. 4 we then discuss the cases of NGC 2264 and the Chamaeleon I cloud. Finally in Sect. 5 we briefly summarize our results.
2 The ONC: an update
Our analysis method throughout this paper is based on the work of Flaccomio et al. (2002a, b) on the ONC. This cluster is arguably the best target available for our study because we have access to a rich and well characterized sample of members spanning a wide range of masses. We refer the reader to Flaccomio et al. (2002a, b) for a full description of the X-ray and optical data used here. The extinction limited sample () discussed in this latter work has little field contamination and is complete almost down to the lowest stellar masses. Using the line () as an indicator for circumstellar accretion, Flaccomio et al. (2002b) obtained with high statistical significance the result that low mass stars () with this line in strong emission () have systematically lower and values respect to stars with the line in absorption ().
Here we state that an analogous result is obtained, albeit with smaller significance (), comparing the and distributions of stars with large and small near IR excess ( and respectively). The X-ray and optical/IR data are presented in Flaccomio et al. (2002a) and the values are taken from Hillenbrand et al. (1998). Figure 2 and 3 shows the maximum likelihood and distributions for these two classes of stars in 6 different mass bins. The range of confidence with which we can exclude that the two distributions are randomly extracted from the same parent population, according to the tests in the asurv package (Feigelson & Nelson, 1985), is given inside each panel.


We also note that very similar results are obtained, both with the line and with as a discriminant, if only X-ray detected members are considered in the distribution functions. As reminded in the introduction, these latter results exclude that the difference in the distributions is due to the preferential selection of faint CTTS (which is anyway not expected given that the sample is not selected from either accretion or disk indicators).
3 NGC 2264
Stellar activity in NGC 2264 has been studied most recently by Flaccomio et al. (2000) through 6 different ROSAT HRI observations covering, in two different pointings, a large fraction of the star forming cloud. One hundred sixty nine distinct sources were detected, of which are estimated to be associated with members of the association. One of the main problem at the time of this work was the lack of good optical characterization of the members, so that, for example, lacking individual measurements, extinction toward sources had to be assumed uniform and placement of counterparts in the HR diagram was performed solely from optical photometric data, an error-prone procedure for PMS stars. Moreover the distinction between CTTS and WTTS was not well established, as indications on the NIR excesses were not available and measurements were in most cases qualitative and non-uniform. Since that work new improved optical data have been recently published by Rebull et al. (2002). We therefore updated the previous analysis according to the general principles stated in the introduction.
3.1 The reference sample
We adopted optical data from tables 1 and 3 of Rebull et al. (2002). Out of the full list of 687 photometrically selected candidate members (i.e. the in cloud, in locus population defined by Rebull et al. 2002) we selected the 202 stars for which reliable spectral types and extinction () estimates (through and photometry spectral types) were available. This latter is a subset of the full spectroscopic sample studied by Rebull et al. (2002), initially selected primarily from a list of I-band variable stars, with the addition of previously known candidate members based on their X-ray or emission or on their proper motion. Our reference sample is therefore the intersection (logical and) of the photometrically selected member sample and of the spectroscopic sample. While the former is arguably free from selection biases in favor of faint CTTS, the degree of representativeness of the latter in this respect is less clear: is however only a secondary selection criterion and I-band variability (periodic in of the stars), although maybe more frequent in CTTS, does not obviously favor the inclusion of optically faint stars. Moreover the disk (CTTS) fractions Rebull et al. (2002) derive for the spectroscopic and the photometric sample (cf. their Table 6) are remarkably similar, suggesting that the former is not strongly biased toward CTTS.
Contamination of our reference sample from field stars may on the other hand be non negligible: according to preliminary proper motion data Rebull et al. (2002) report that of their photometric candidates are actually non-members. The spectroscopic sample, selected on the basis of PMS stellar characteristics, is expected to be less contaminated, although an estimate based on proper motion data is not provided. We recall (cf. Sect. 1) that field star contamination is expected to artificially lower the activity levels of WTTS.
We place stars in our reference sample in the HR diagram. Effective temperatures and bolometric corrections are estimated from spectral types and Kenyon & Hartmann (1995) conversions.444The effective temperature for spectral type A6 was modified from 8350 K to 8050. The former value seems to be at odds with the spectral type- relation; we suspect a typographical mistake. We then evaluate bolometric luminosities from I band magnitudes. Out of the 202 spectrally characterized candidate members, 193 fall within the Siess et al. (2000) evolutionary model grid and have therefore been assigned a mass and an age.
The reference sample used for our following analysis comprises the 178 stars, out of these 193 candidate members characterized in terms of mass and age, that fall in the field of view of the X-ray observations described by Flaccomio et al. (2000).
3.2 X-ray data
We matched the photometric catalog of Rebull et al. (2002), out of which our reference member list is drawn, with the list of 169 X-ray sources published by Flaccomio et al. (2000). The identifications were carried out as described in Flaccomio et al. (2000), i.e. assuming as identification radii the the off-axis dependent X-ray source position error summed in quadrature to 1′′, i.e. a conservative estimate of the optical position error. Before performing the final identification we first registered the coordinate systems of the optical and X-ray lists by comparing the positions of 125 uniquely identified pairs (, ). Sixty seven stars in our reference sample were identified with an X-ray source, 56 of which uniquely, while the the remaining 11 fell in the identification circle of an X-ray source along with other objects in the photometric catalog. To each of the 67 candidate members with X-ray counterparts we then assigned a Maximum Likelihood (ML) X-ray count rate: these are values computed by Flaccomio et al. (2000) in order to define a mean source brightness among 6 different observations. Due to source variability, five of these mean values are actually upper limits. The count rates of the 11 ambiguous identifications were also treated as upper limits and upper limits, computed as in Flaccomio et al. (2000), were also assigned to 111 X-ray undetected candidate members lying within the FOV of the HRI observations.
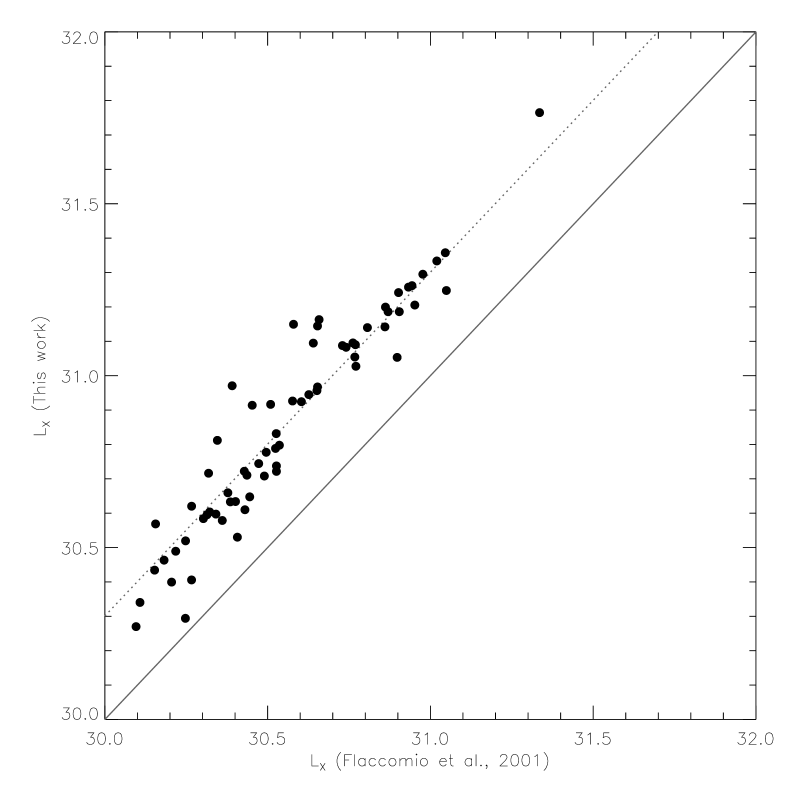
Finally we converted count-rates, measured and upper limits, to X-ray luminosities in the 0.1-4.0 keV band555Conversion factors to un-absorbed flux are computed using PIMMS (Portable, Interactive, Multi-Mission Simulator), version 3.0, available on-line at: http://asc.harvard.edu/toolkit/pimms.jsp. We assumed a thermal emission spectrum with keV, close to recent estimates for PMS stars (e.g. Flaccomio et al., 2002b; Imanishi et al., 2001; Getman et al., 2002). The hydrogen column density was assumed proportional to the optical extinction measured individually for each star: . The distance was assumed to be 760pc like in Flaccomio et al. (2000). Figure 4 compares the derived by Flaccomio et al. (2000) to those derived here from the same count-rates. Our new estimates are dex higher respect to the old ones, with the main differences due to the assumed (2.16 vs. 0.75 keV) and the increased absorption (mean vs. a constant ) and a small difference, dex, due to the different spectral band in which is computed.
3.3 Activity vs. circumstellar environment
We will now try to establish whether the activity levels of our sample of NGC 2264 candidate members depend on circumstellar properties, evidenced either by accretion or by IR disk indicators. We will use two indicators provided by Rebull et al. (2002): equivalent width, , and excess in the near IR color, . In the former case we will consider as accreting those stars with and non-accreting those with 666We choose 5 instead of the more customary 10 as threshold because we so obtain a better distinction between activity indicators of the two classes. As noted in the introduction lowering the threshold could, if anything, result in a reduction of the inferred difference in activity levels; the most active WTTS might indeed have strong chromospheric emission and be mistaken for CTTS.. In the latter case we take as threshold with stars showing larger excesses considered as surrounded by circumstellar disks.
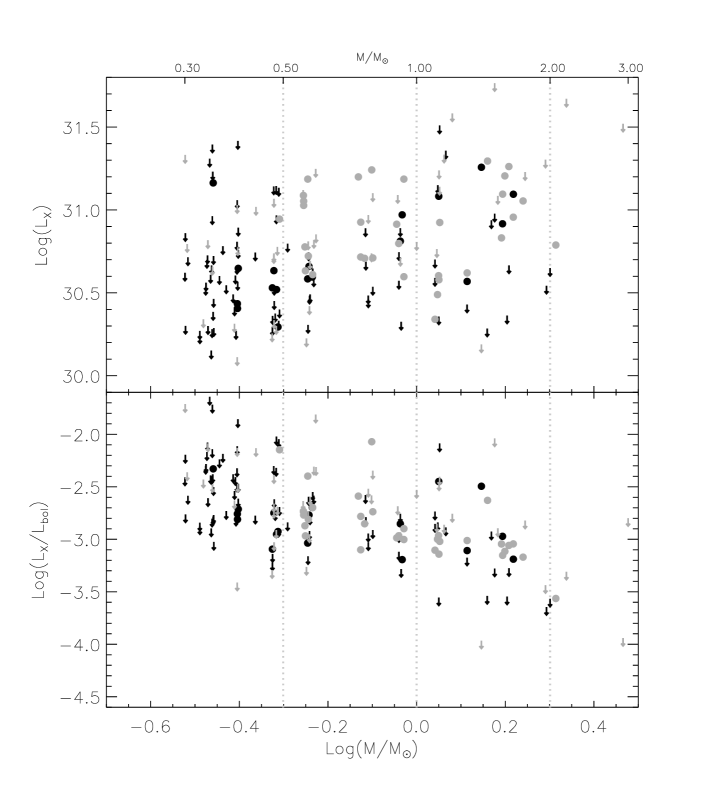
Figure 5 shows the scatter plots between and stellar mass and and mass, for the accreting and non-accreting stars. Similarly to what seen in other SFRs, is seen to correlate with stellar mass, although the relation appears somewhat fuzzier in this case respect to, e.g., the ONC or the Chamaeleon I cases (see below). A systematic difference between the two classes is not readily apparent. However, given the large number of upper limits a more quantitative analysis is needed. Figure 6 shows XLFs and distributions for the two separated stellar classes, in two different mass ranges, marked in Fig. 5 by vertical lines, and for the whole sample. In all cases the distributions of accreting stars appear to lie below those for non-accreting ones. Statistical test (in the asurv package) confirm such differences with varying degree of confidence (results of the tests are given in the figure, along with the number of detection and upper limits that enter in the distributions; the same information is repeated in the first part of Table 1, where the results of other tests described below are also reported). Particularly significant is the difference in for the whole sample (). Such a difference might however result from a larger fraction of low mass, and low , accreting stars (see Fig. 5). In the two narrower mass ranges, the result is however retrieved, with greater than confidence in the mass range. The difference is also observed in . Note that, as pointed out above, our reference sample may be significantly contaminated by field stars, and this would tend to depress the non-accreting stars distributions, thus lowering the significance of the result. If we repeat the same analysis including only stars confirmed as members by their IR excess ( or ), emission () and X-ray detection, we indeed find even more significant differences. Particularly interesting are the differences in , because they are less likely to be influenced by selection effects, a concern for this latter restricted sample. Table 1 reports the results of these tests.
Table 1 also reports the results of the comparisons between the stars with and without near IR excess, for the same mass ranges and the two stellar samples described above. The same results is retrieved: stars showing a excess, indicating the presence of a disk, have lower activity levels respect to the complementary sample.
| Mass | ||||||
| - Whole sample | ||||||
| 0.5-1.0 | 5 | 16 | 18 | 14 | 3.0/3.4 | 2.5/2.8 |
| 1.0-2.0 | 5 | 14 | 13 | 10 | 1.4/1.9 | 1.1/2.1 |
| All | 18 | 79 | 33 | 44 | 3.9 | 1.5/2.1 |
| - Confirmed members | ||||||
| 0.5-1.0 | 5 | 16 | 18 | 2 | 3.9 | 3.2/3.9 |
| 1.0-2.0 | 5 | 14 | 13 | 1 | 2.1/2.7 | 1.9/3.1 |
| All | 18 | 79 | 33 | 7 | 3.9 | 3.3/3.9 |
| - Whole sample | ||||||
| 0.5-1.0 | 1 | 9 | 18 | 20 | 1.3/1.8 | 2.2/3.2 |
| 1.0-2.0 | 1 | 10 | 14 | 11 | 1.9/2.2 | 2.1/2.5 |
| All | 4 | 30 | 40 | 71 | 2.2/2.4 | 2.6/3.2 |
| - Confirmed members | ||||||
| 0.5-1.0 | 1 | 9 | 18 | 9 | 1.8/2.3 | 2.6/3.5 |
| 1.0-2.0 | 1 | 10 | 14 | 2 | 2.4/2.8 | 2.9/3.4 |
| All | 4 | 30 | 40 | 44 | 2.8/3.0 | 3.4/3.9 |
-
Note –
Description of columns: (1) Mass range; (2) Number of detected CTTS; (3) Number of CTTS with upper limits; (4) Number of detected WTTS; (5) Number of WTTS with upper limits; (6) Range of significance (expressed in equivalent) for the difference between the distributions of CTTS and WTTS according to the tests in ASURV. Results greater than are in boldface; (7) like (6), but for

4 Chamaeleon I
Our main source of data regarding the Chamaeleon I association is the work by Lawson et al. (1996): we use their member list (117 stars in their Table B1) and their estimates of and (available for 78 stars, Table 6). We adopt here a distance to the Chamaeleon I cloud of 160pc (Whittet et al., 1997; Wichmann et al., 1998), 20pc larger than the distance assumed by Lawson et al. (1996) in estimating bolometric luminosities. We therefore increased the values accordingly. Masses of 71 candidate members were derived from placement in the HR diagram and interpolation of Siess et al. (2000) evolutionary tracks.
The selection of candidate members in Lawson et al. (1996) is performed mainly on the basis of either their or X-ray emission. The danger of preferentially selecting faint stars (both optically and in X-rays) with strong emission is therefore present. However the Chamaeleon I association is close enough that a large fraction of intermediate mass members is probably detected in the ROSAT PSPC X-ray observations. Also, as anticipated in the introduction, other than we will also investigate the dependence of on circumstellar characteristics and, as a further test, we will also consider a fully X-ray selected sample.
X-ray data were taken from Lawson et al. (1996): they quote X-ray luminosities (or upper limits) for members of the region, computed from ROSAT PSPC count rates in the 0.4-2.5keV spectral band (Feigelson et al., 1993), using a constant count-rate to (in the same band) conversion factor: 1 PSPC count = . Feigelson et al. (1993) find that this conversion factor corresponds to assuming a plasma temperature keV and an absorption by a hydrogen column, , corresponding to .
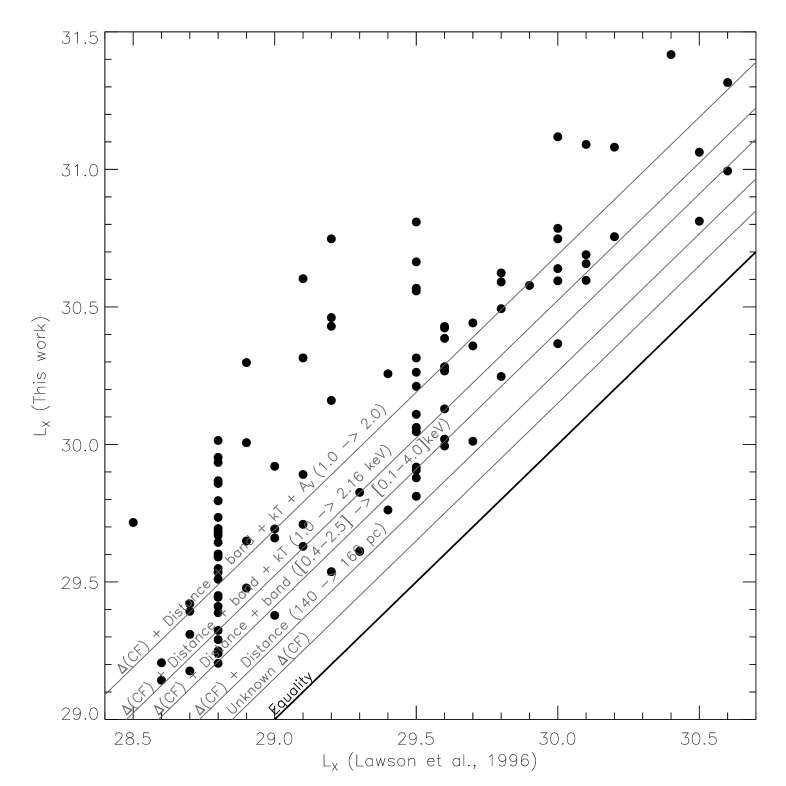
In order to account for differential extinction (i.e. the fact that star are subject to different extinctions) and to uniform our assumptions to the ONC and NGC 2264 studies, we re-estimated X-ray luminosities, in our standard 0.1-4.0 keV band. We started from PSPC count rates in the 0.4-2.5 keV band, i.e. from the reported in Lawson et al. (1996) divided by the above mentioned conversion factor. We then multiplied these count-rates by conversion factors between PSPC count-rates (in the 0.4-2.5 keV band) and luminosities (in the 0.1-4.0 keV band), computed for a keV thermal plasma emission absorbed by an hydrogen column and our assumed distance to the association (160pc). Estimates of individual optical extinction values are taken from the following works: Lawson et al. (1996, , Table 3), Gauvin & Strom (1992, , Table 2), Walter (1992, , Table 1) and Cambresy et al. (1998, , Table 1); whenever multiple estimates were available for a given star we choose one of the four values, the precedence order being the same as the order of citation given above. and were converted to by multiplying by 3.55 and 3.1 respectively (Mathis, 1990). Figure 7 compares the new X-ray luminosities with those reported in Lawson et al. (1996) and indicates the effects that contribute to the considerable average discrepancy between the two estimates. First of all a difference of dex, indicated by the lowest diagonal thin line, is of unclear origin: we recomputed the conversion factor, in the 0.4-2.5keV band, assuming keV and , i.e. following Feigelson et al. (1993), and derived a larger conversion factor, by dex, respect to the value reported by these authors. The other light lines show the effect of having changed the assumed cluster distance, the chosen spectral band, the plasma temperature, and the average source extinction. The combined effects of these changes results in our X-ray luminosities being on average (0.7 dex) times larger than the ones formerly derived.
4.1 Activity vs. circumstellar environment
We adopt the distinction between CTTS and WTTS presented by Lawson et al. (1996, Table B1), excluding from our analysis 4 stars with uncertain classification, out of our 71 with mass estimates. The distinction is based on emission. Our final sample comprises 28 CTTS and 39 WTTS.
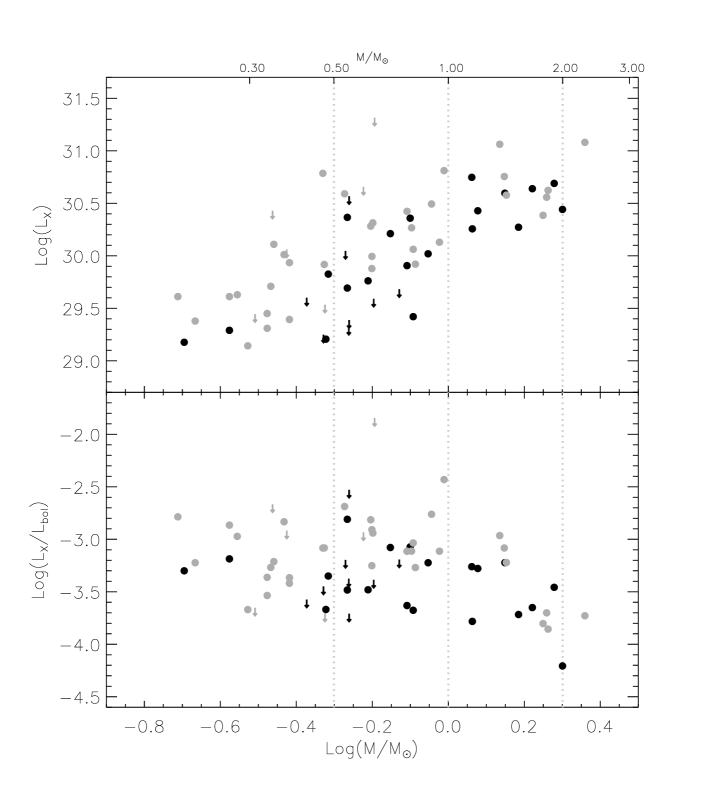
Figure 8 shows, with different symbols for CTTS and WTTS, the scatter plots of and with mass. Disregarding for the moment the difference between CTTS and WTTS, a trend of increasing with increasing mass, already noted by Lawson et al. (1996) and also seen in other star forming regions, can be clearly observed. seems to be close to the saturation level () at all masses. We note that Lawson et al. (1996), on the basis of their lower X-ray luminosities had excluded that coronal activity in Chamaeleon I members was saturated, contrary to what reported for other star forming regions. Our re-analysis of the same data shows that this result can be attributed in large part to the assumptions made in the conversion between count-rates and X-ray luminosities and to the choice a non standard X-ray spectral band for the calculation of .
Figure 9 shows the and distribution functions, separately for CTTS and WTTS, in the same two mass ranges investigated in NGC 2264 and for the whole sample. First of all we note that there is little difference (at the level) between the two XLFs referring to the whole population. This is indeed the same result reported by Lawson et al. (1996). However a look at Fig. 8 shows that this might be due to the inclusion of stars over an ample range of masses. If we indeed consider only stars in the range CTTS appear to be underluminous respect to WTTS at the level, both in absolute terms and respect to their bolometric luminosities. is indeed lower (at the level) even if we consider the whole sample. We obtain similar results, although of somewhat lesser significance, if we only consider X-ray selected stars: for example, the significance of the difference in the range are and for and , respectively.
As a final note we remark that less significant results are obtained if the same analysis is performed with the values of reported by Lawson et al. (1996). The scatter of points around the mean relations observed in Fig. 8, as well as in the distribution functions in Fig. 9, appear in this case to be larger. However the difference in the mass range remains (at the 2.2/2.8 level).

5 Summary and Conclusions
We have considered three SFRs: the ONC, NGC 2264 and Chamaeleon I. After a critical re-analysis of the optical and X-ray data published in recent literature, we have tried to answer the question of whether stars with different circumstellar properties have different observed X-ray emission, both in absolute terms and in relation to their bolometric luminosities.
In all of the analyzed cases we find that CTTS are underluminous respect to WTTS. This result is found in spite of large differences in the selection of members and in the optical and X-ray data used. We believe that it indicates a difference either in the intrinsic properties of X-ray emission or, alternatively, in the radiation transport (e.g. absorption) in the proximity of the stellar system. However we tend to prefer the first option: a difference in the relation between optical and X-ray circumstellar extinction, for example, might explain our result, but no such indication has been found to date.
When we could investigate the matter, i.e. in the cases of the ONC and NGC 2264, we found that the difference holds both when we discriminate stars on the basis of accretion and disk presence indicators. Therefore we are not able to say which of these two related aspects is most relevant for the mechanism responsible for the difference.
Having established the reality of this effect, work remains to be done to better characterize it and to identify its physical source. Thanks to sensitive X-ray data from modern X-ray space-borne telescopes and high-throughput optical/IR instruments this goal seems well within the reach of near future research.
Acknowledgements.
The authors wish to acknowledge support from the Italian Space Agency (ASI) and MURST.References
- Cambresy et al. (1998) Cambresy, L., Copet, E., Epchtein, N., et al. 1998, A&A, 338, 977
- Feigelson et al. (1993) Feigelson, E. D., Casanova, S., Montmerle, T., & Guibert, J. 1993, ApJ, 416, 623
- Feigelson et al. (2002) Feigelson, E. D., Broos, P., Gaffney, J., A., et al. 2002 ApJ, in press
- Feigelson & Nelson (1985) Feigelson, E. D. & Nelson, P.I. 1985, ApJ, 293, 192
- Flaccomio et al. (2000) Flaccomio, E., Micela, G., Sciortino, S., et al. 2000, A&A, 355, 651
- Flaccomio et al. (2002a) Flaccomio, E., Damiani, F., Micela, G., et al. 2002a, ApJ, in press, astro-ph/0208474
- Flaccomio et al. (2002b) Flaccomio, E., Damiani, F., Micela, G., et al. 2002b, ApJ, in press, astro-ph/0208475
- Gauvin & Strom (1992) Gauvin, L. S. & Strom, K. M. 1992, ApJ, 385, 217
- Getman et al. (2002) Getman, K. V., Feigelson, E. D., Townsley, L., et al. 2002, ApJ, in press
- Grosso et al. (2000) Grosso, N., Montmerle, T., Bontemps, S., André, P., & Feigelson, E. D. 2000, A&A, 359, 113
- Hillenbrand et al. (1998) Hillenbrand, L. A., Strom, S. E., Calvet, N., et al. 1998, AJ, 116, 1816
- Imanishi et al. (2001) Imanishi, K., Koyama, K., & Tsuboi, Y. 2001, ApJ, 557, 747
- Kastner et al. (2002) Kastner, J. H., Huenemoerder, D. P., Schulz, N. S., Canizares, C. R., & Weintraub, D. A. 2002, ApJ, 567, 434
- Kenyon & Hartmann (1995) Kenyon, S. J. & Hartmann, L. 1995, ApJS, 101, 117
- Kohno et al. (2002) Kohno, M., Koyama, K., & Hamaguchi, K. 2002, ApJ, 567, 423
- Lawson et al. (1996) Lawson, W.A., Feigelson, E.D., Huenemoerder, D.P. 1996, NMRAS, 280, 1071
- Mathis (1990) Mathis, J. S. 1990, ARA&A, 28, 37
- Neuhäuser et al. (1995) Neuhäuser, R., Sterzik, M. F., Schmitt, J. H. M. M., Wichmann, R., & Krautter, J. 1995, A&A, 297, 391
- Preibisch & Zinnecker (2001) Preibisch, T. & Zinnecker, H. 2001, AJ, 122, 866
- Preibisch & Zinnecker (2002) Preibisch, T. & Zinnecker, H. 2002, AJ, 123, 1613
- Rebull et al. (2002) Rebull, L. M., Makidon, R. B., Strom, S. E., et al. 2002, AJ, 123, 1528
- Siess et al. (2000) Siess, L., Dufour, E., & Forestini, M. 2000, A&A, 358, 593
- Stelzer et al. (2000) Stelzer, B., Neuhäuser, R., & Hambaryan, V. 2000, A&A, 356, 949
- Stelzer & Neuhäuser (2001) Stelzer, B. & Neuhäuser, R. 2001, A&A, 377, 538
- Tsujimoto et al. (2002) Tsujimoto, M., Koyama, K., Tsuboi, Y., Goto, M., & Kobayashi, N. 2002, ApJ, 566, 974
- Walter (1992) Walter, F. M. 1992, AJ, 104, 758
- Whittet et al. (1997) Whittet, D. C. B., Prusti, T., Franco, G. A. P., et al. 1997, A&A, 327, 1194
- Wichmann et al. (1998) Wichmann, R., Bastian, U., Krautter, J., Jankovics, I., & Rucinski, S. M. 1998, MNRAS, 301, L39