Detection of Optical Synchrotron Emission from the Radio Jet of 3C 279
Abstract
We report the detection of optical and ultraviolet emission from the kiloparsec scale jet of the well-known quasar 3C 279. A bright knot, discovered in archival V and U band Hubble Space Telescope Faint Object Camera images, is coincident with a peak in the radio jet 0.6 from the nucleus. The detection was also confirmed in Wide Field Planetary Camera-2 images. Archival Very Large Array and MERLIN radio data are also analyzed which help to show that the high-energy optical/UV continuum, and spectrum, are consistent with a synchrotron origin from the same population of relativistic electrons responsible for the radio emission.
ApJL, accepted
1 Introduction
The quasar 3C 279 (z=0.536) is one of the best studied active galaxies in the sky. It is a bright EGRET -ray source (Hartman et al., 2001), and shows rapid variability across the entire electromagnetic spectrum (e.g., Wehrle et al., 1998). One of the first early triumphs of the technique of Very Long Baseline Interferometry (VLBI), was the discovery of apparent superluminal motion in the parsec-scale jet of this quasar (Cotton et al., 1979, and references therein). Subsequent superluminal ejections have been continually monitored for more than thirty years (e.g., Unwin et al., 1989; Wehrle et al., 2001). The VLBI jet’s polarization structure (Leppänen, Zensus, & Diamond, 1995) has been imaged at frequencies as high as 86 GHz (Attridge, 2001). Circular polarization has been detected in the parsec-scale jet, possibly implying an electron-positron composition (Wardle et al., 1998; Homan & Wardle, 1999).
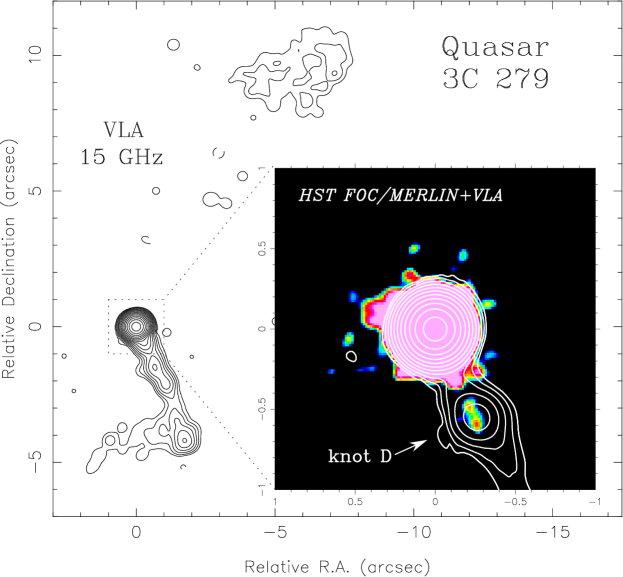
The radio jet has long been known to extend out to kiloparsec scales for 5 to the south-southwest (de Pater & Perley, 1983; Akujor et al., 1994). An extended feature to the northwest can be attributed to a radio lobe fueled by the Doppler dimmed counter-jet, but is equally likely to be due to the main jet because of its extreme viewing angle to our line of sight (Figure 1; de Pater & Perley, 1983). The recent discovery of an X-ray counterpart to the 5 long radio jet in a deep Chandra exposure prompted an analysis of archival Hubble Space Telescope111Based on observations made with the NASA/ESA Hubble Space Telescope, obtained from the data archive at the Space Telescope Science Institute. STScI is operated by the Association of Universities for Research in Astronomy, Inc. under NASA contract NAS 5-26555. (HST) images in search of optical emission in the jet. The Chandra results will be presented elsewhere (Marshall et al., 2002b). In this Letter, we report the detection of optical and ultraviolet (UV) emission associated with the brightest region in the kiloparsec scale radio jet. We adopt a Friedmann cosmology with = 75 km s-1 Mpc-1 and = 0 throughout this Letter, so at the distance of the quasar, 1 arcsecond equals 5.58 kpc.
2 Description of Archival Observations
We obtained post-COSTAR Faint Object Camera (FOC) f/96 (Jedrzejewski et al., 1994) images of 3C 279 from the HST archive with ‘on-the-fly’ pipeline calibration applied. Single high quality exposures with the F253M and F550M filters (each 1 ksec) were taken consecutively during November 1995 as part of a program (ID 6057) to study the inner structure of the quasar (Hook, Schreier, & Miley, 2000) with the Fine Guidance Sensors (FGS) – see Table 1. These filters approximate the standard U and V bands, respectively. To our knowledge, only the FGS data have been published (E. Schreier, personal communication).
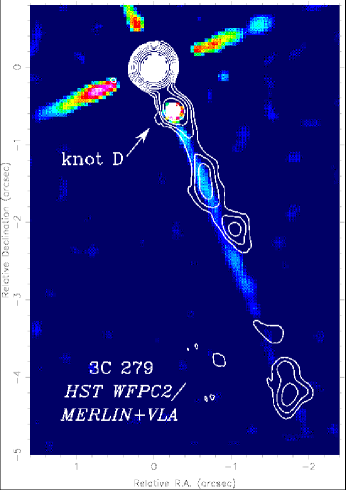
A visual inspection of the FOC images shows a noticeable linear extension centered 0.6 from the quasar nucleus, at a position angle (in the sky) of in both the U and V band exposures. This feature matches the position of the bright knot ‘D’ in the radio jet (nomenclature of de Pater & Perley, 1983). An overlay of the optical image with a high resolution radio image (Figure 1) show that the optical feature is clearly coincident with this region of the radio jet.
We were able to confirm this detection in two short (300 sec) R-band WFPC2 F702W exposures taken more than a year apart as part of the HST 3CR snapshot survey (Lehnert et al., 1999). Both images unfortunately suffered from saturated nuclei, and even worse, a diffraction spike lies at the position angle of the radio jet for almost its entire 5 extent. However, subtracting a smoothed version of the PSF from both the individual exposures, and from the combined image, revealed a large excess above the diffraction spike at the position of knot D in each case (Figure 2). Its count rate (measured from the unsharp masked image) is about three times greater than that measured anywhere else on that or the other three diffraction spikes. We use these data only for confirming the optical identification of knot D, as any flux measurement from these images will be hopelessly contaminated.
Two more HST images were available in the archive at the time of our analysis from the same FOC/FGS program described above (Hook, Schreier, & Miley, 2000). The observing sequence from the original program was repeated 1.5 years later (on 30 May 1997), but utilized the F2ND neutral density filters in parallel which resulted in a factor of about six drop in sensitivity. Our extraction procedure was performed on the images from the later epoch and showed flux levels at the predicted position of the 0.6 knot to be consistent with the background (see §3). Fluxes for the quasar nucleus could still be extracted from these images yielding 1.1 and 3.5 mJy at U and V bands, which are consistent with contemporaneous ground-based measurements (Wehrle et al., 1998). We similarly extracted nuclear fluxes for the 1995 epoch and obtained 0.79 mJy (U) and 2.8 mJy (V), again, close to ground-based results by Hartman et al. (2001).
Radio data was obtained from the NRAO222The National Radio Astronomy Observatory is a facility of the National Science Foundation operated under cooperative agreement by Associated Universities, Inc. Very Large Array (Thompson et al., 1980) archive and the MERLIN333MERLIN is a UK National Facility operated by the University of Manchester at Jodrell Bank Observatory on behalf of PPARC. archive (see Table 1 for a summary). The VLA data (5 and 15 GHz) was calibrated in AIPS (Greisen, 1988) utilizing standard procedures and self-calibrated in the Caltech DIFMAP package (Shepherd, Pearson, & Taylor, 1994). We selected the data carefully to give us matched resolution images (0.4) at the two frequencies. Fluxes were set using the VLA 1999.2 coefficients for 3C 286. The MERLIN data (5 GHz) was pipeline processed at Jodrell Bank on the Baars et al. (1977) scale, and then combined at Brandeis with a day-long VLA observation recently obtained when the full array was used as a single element for a VSOP space-VLBI experiment. We accounted for variability in the source between the two epochs of observation by subtracting 9.75 Jy from the VLA nucleus in the plane. With baselines up to 217 km, this data produced our highest resolution radio image (Figures 1 & 2), which most closely matches that achieved by the HST data (0.05-0.1). Pilbratt, Booth, & Porcas (1987) presented an earlier image of 3C 279 using MERLIN only data. To our knowledge, only the WFPC2 data (Lehnert et al., 1999), but none of the other multi-wavelength observations presented in this work were previously published.
3 Analysis and Results
The jet emission in the two 1995 FOC exposures appear prominently above the background and wings of the point spread function (PSF). Nevertheless, in order to verify that the extended emission detected was not an artifact of the PSF wings due to the bright nucleus, we subtracted scaled PSFs from each 3C 279 image using images of stars from FOC calibration program ID 6196 (the FOC is insensitive to cosmic rays and a careful inspection of the images did not show any unusual defects near the knot position). The emission from radio knot D clearly remained in the resultant images (not shown). We did not detect any optical counterpart to the rest of the arcsecond-scale jet444Up to 3 where the field of view of the FOC images was cut off, and for its entire length in the WFPC2 images., where the radio emission is weaker and the radio-to-optical spectrum (based on previous ground based optical imaging) is expected to be steeper: (Fraix-Burnet et al., 1991), using the sign convention . Analysis of the radio data and optical limits for the rest of the jet is deferred to a future paper (Marshall et al., 2002b).
We extracted counts from the original (unrotated) geometrically corrected
and flat-fielded images using square apertures with 21 pixel
(0.3) sides, centered on the position of the knot (we chose
not to extract fluxes from the PSF subtracted images since additional
artifacts were introduced from this process). This aperture was judged by
eye to contain all the flux from the jet knot, and is situated far enough
away from the bright quasar to avoid large contaminations. The background
and contribution from the PSF was determined using the same aperture to
measure the average count-rates at the three 0.6 distant
azimuthal positions in intervals around the core. The count
rates were converted to flux densities using the inverse sensitivity
measurement given by the PHOTFLAM keyword in the image headers,
yielding 6.1 and 1.8 Jy at the V and U bands, respectively. We
experimented with various circular apertures and found measurement
differences on the order of 20-25 (higher for the UV data) with
that derived above. Therefore, we conservatively estimate this to be the
error in our HST flux measurements. These fluxes are consistent with
(1) upper limits of about 10 Jy (V) and 6 Jy (U)
measured from the Poisson noise in the second epoch FOC data.
We used DIFMAP’s MODELFIT program to fit elliptical gaussian models
to the radio visibility data in the inner region of the jet. The position
and size (including ellipticity) derived in this manner for knot D was
consistent between the frequencies and gave fluxes of 279 mJy (4.76 GHz)
and 115 mJy (15 GHz) which we estimate are accurate to better than 10 and
15, respectively. The size of the emitting region is best constrained
by the MERLIN+VLA image which gives a measured gaussian with dimensions
, elongated in the jet direction. We
estimated a 1.67 GHz flux (650 mJy ) from a published MERLIN map
(Akujor et al., 1994) of comparable resolution to our new 5 and 15 GHz radio data,
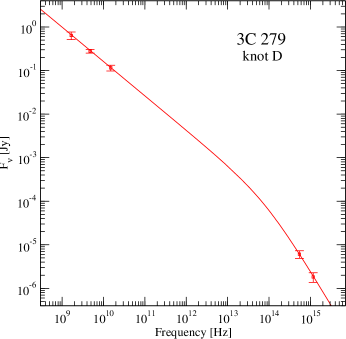
giving us a three point radio spectral index (=0.79)
for region D which agrees with the value of 0.750.1 measured by
de Pater & Perley (1983). The optical and UV fluxes lie below the power-law
extrapolation from the radio measurements, indicating steepening at higher
frequencies where we measure an optical/UV spectral index of 1.6 with a
2- confidence of 0.3. The radio-to-UV spectrum is shown in
Figure 3.
4 Physical Conditions in the Optical/UV Emitting Region
The radio emission from region D shows a high level of fractional polarization (20) at 5 GHz, but does not appear to be strongly shocked as the magnetic field direction is predominantly longitudinal (de Pater & Perley, 1983) indicating a shear dominated flow. Its integrated radio-to-UV spectrum can be well explained by a steepening synchrotron spectrum from a single population of relativistic electrons, as is the usual interpretation for the growing number of already detected optical/UV arcsecond-scale jets (Sparks, Biretta, & Macchetto, 1994; Scarpa & Urry, 2002). We can extrapolate the radio spectrum to the optical/UV by fitting a break at Hz to a smoothly connected double power-law spectrum (Figure 3), so the synchrotron luminosity appears to peak in the near-infrared. If we can extend the observed spectrum to even higher energies, it would predict a 1 keV flux of roughly 0.4 nJy if the X-ray output from the 0.6 feature is dominated by synchrotron losses. This should be easily detectable in the Chandra exposure obtained by Marshall et al. (2002b), although it may be difficult to resolve with the detector’s limited resolution of /pixel. The measured steepening in the spectral index () corresponds to a change in the electron distribution index (see below) of 1.6. Similar changes have been found for other well-studied high-energy (optical and X-ray) synchrotron emitting regions in the jets of, for instance, M87 (Marshall et al., 2002a) and PKS 0521–365 (Birkinshaw, Worrall, & Hardcastle, 2002).
We applied a homogeneous synchrotron model (see e.g., Blumenthal & Gould, 1970) to calculate an equipartition magnetic field, . The factor is defined by the relation: , where and are the energy densities in the magnetic field and electrons, respectively (e.g., if we have equipartition, for an electron-positron plasma). We assumed that the electrons have a power law energy distribution (with minimum and maximum energy cutoffs, , and ), and that the radiating particles and magnetic field fill a fraction, , of a spherical volume whose diameter is cm (applying an appropriate conversion from our measured elliptical gaussian fit to the size; Marscher (1983)). The Doppler beaming factor is defined as , where is the bulk Lorentz factor of the knot, is the velocity of the jet in units of c, and is the angle the jet makes to our line of sight. This calculation is only weakly dependent on which we arbitrarily set to extend into infinity. In the extreme case that the errors in the radio fluxes were even larger than our conservative estimates, it may be possible to obtain a single power law index (1) fit to the overall radio-to-UV spectrum. Our calculation of in this case maintains relatively unaffected by this steeper spectral index. The derived magnetic field implies that the UV emitting electrons have with a radiative lifetime (in their rest frame) of about ] yrs.
It is useful to see how the synchrotron cooling time of the UV emitting electrons in knot D compares with the light travel distance from the nucleus. Firstly, the angle between the jet and our line of sight is restricted to be by the observed VLBI apparent superluminal motion of 14c (Cotton et al., 1979). We note that this measurement is the fastest (and earliest) motion recorded in this quasar so far, and was observed when the VLBI jet was best aligned () with the position angle of the VLA scale jet (). This gives us a deprojected distance from the nucleus to knot D of 25 kpc. Now, if the Doppler factor this far down the jet is as large as that observed on parsec-scales (; Homan & Wardle, 2000), and making the simple assumptions, , , and , we can infer a rest-frame G – comparable to those derived for other known optical emitting synchrotron features (see e.g., Scarpa & Urry, 2002). It follows that the observed (accounting for time dilation between the rest frame and observer frame) radiative lifetime is yrs which corresponds to a travel distance of 90 kpc and exceeds the light travel time from the nucleus by a factor of a few. This makes it just plausible that in-situ reacceleration (e.g., Meisenheimer, 1996) is not strictly required if the Doppler factor at the site of knot D is really as high as that measured on parsec scales, but that remains unknown.
References
- Akujor et al. (1994) Akujor, C. E., Lüdke, E., Browne, I. W. A., Leahy, J. P., Garrington, S. T., Jackson, N., & Thomasson, P. 1994, A&AS, 105, 247
- Attridge (2001) Attridge, J. M. 2001, ApJ, 553, L31
- Baars et al. (1977) Baars, J. W. M., Genzel, R., Pauliny-Toth, I. I. K., & Witzel, A. 1977, A&A, 61, 99
- Birkinshaw, Worrall, & Hardcastle (2002) Birkinshaw, M., Worrall, D. M., & Hardcastle, M. J. 2002, MNRAS, 335, 142
- Blumenthal & Gould (1970) Blumenthal, G. R. & Gould, R. J. 1970, Rev. Mod. Phys., 42, 237
- Cotton et al. (1979) Cotton, W. D. et al. 1979, ApJ, 229, L115
- de Pater & Perley (1983) de Pater, I. & Perley, R. A. 1983, ApJ, 273, 64
- Fraix-Burnet et al. (1991) Fraix-Burnet, D., Golombek, D., Macchetto, F., Nieto, J.-L., Lelievre, G., Perryman, M. A. C., & di Serego Alighieri, S. 1991, AJ, 101, 88
- Greisen (1988) Greisen, E. W. 1988, AIPS Memo 61, National Radio Astronomy Observatory
- Hartman et al. (2001) Hartman, R. C., Boettcher, M., Aldering, G. et al. 2001, ApJ, 553, 683
- Homan & Wardle (1999) Homan, D. C. & Wardle, J. F. C. 1999, AJ, 118, 1942
- Homan & Wardle (2000) —–. 2000, ApJ, 535, 575
- Hook, Schreier, & Miley (2000) Hook, R. N., Schreier, E. J., & Miley, G. 2000, ApJ, 536, 308
- Jedrzejewski et al. (1994) Jedrzejewski, R. I., Hartig, G., Jakobsen, P., Crocker, J. H., & Ford, H. C. 1994, ApJ, 435, L7
- Lehnert et al. (1999) Lehnert, M. D., Miley, G. K., Sparks, W. B., Baum, S. A., Biretta, J., Golombek, D., de Koff, S., Macchetto, F. D., & McCarthy, P. J. 1999, ApJS, 123, 351
- Leppänen, Zensus, & Diamond (1995) Leppänen, K. J., Zensus, J. A., & Diamond, P. J. 1995, AJ, 110, 2479
- Marscher (1983) Marscher, A. P. 1983, ApJ, 264, 296
- Marshall et al. (2002a) Marshall, H. L., Miller, B. P., Davis, D. S., Perlman, E. S., Wise, M., Canizares, C. R., & Harris, D. E. 2002a, ApJ, 564, 683
- Marshall et al. (2002b) Marshall, H. L. et al. 2002b, in preparation
- Meisenheimer (1996) Meisenheimer, K. 1996, In ”Jets from Stars and Active Galactic Nuclei,” W. Kundt (ed.), Springer Lecture Notes No. 471, 57
- Pilbratt, Booth, & Porcas (1987) Pilbratt, G., Booth, R. S., & Porcas, R. W. 1987, A&A, 173, 12
- Scarpa & Urry (2002) Scarpa, R. & Urry, C. M. 2002, New Astronomy Review, 46, 405
- Shepherd, Pearson, & Taylor (1994) Shepherd, M. C., Pearson, T. J., & Taylor, G. B. 1994, BAAS, 26, 987
- Sparks, Biretta, & Macchetto (1994) Sparks, W. B., Biretta, J. A., & Macchetto, F. 1994, ApJS, 90, 909
- Thompson et al. (1980) Thompson, A. R., Clark, B. G., Wade, C. M., & Napier, P. J. 1980, ApJS, 44, 151
- Unwin et al. (1989) Unwin, S. C., Cohen, M. H., Hodges, M. W., Zensus, J. A., & Biretta, J. A. 1989, ApJ, 340, 117
- Wardle et al. (1998) Wardle, J. F. C., Homan, D. C., Ojha, R., & Roberts, D. H. 1998, Nature, 395, 457
- Wehrle et al. (1998) Wehrle, A. E., Pian, E., Urry, C. M. et al. 1998, ApJ, 497, 178
- Wehrle et al. (2001) Wehrle, A. E., Piner, B. G., Unwin, S. C., Zook, A. C., Xu, W., Marscher, A. P., Teräsranta, H., & Valtaoja, E. 2001, ApJS, 133, 297
| Instrument | Date | Frequency | Exp Time |
|---|---|---|---|
| (1) | (2) | (3) | (4) |
| MERLIN | 04 Jan 1993 | 4.99 | 9 hrs |
| VLA A-configuration | 10 Jan 2001 | 4.87 | 7 hrs |
| VLA A-configuration | 12 Mar 1990 | 4.76 | 580 sec |
| VLA B-configuration | 06 Jan 1992 | 15.0 | 2690 sec |
| HST WFPC2/F702W | 23 Feb 1994 | 4.33105 | 300 sec |
| HST WFPC2/F702W | 20 May 1995 | 4.33105 | 300 sec |
| HST FOC/F550M | 29 Nov 1995 | 5.44105 | 1115 sec |
| HST FOC/F253M | 29 Nov 1995 | 1.17106 | 935 sec |
Note. — Column (1) indicates the telescope and instrument/configuration used. The MERLIN observations utilized a six element array (no Lovell). The WFPC2 data was not used for photometric analysis.
Column (2) is the date of observation in UT.
Column (3) is the frequency in GHz.
Column (4) is the time on source with approximate times indicated for heavily edited data.