The Type Ia Supernova 2001V in NGC 3987111 Based on observations obtained at German-Spanish Astronomical Centre, Calar Alto, operated by the Max-Planck-Institute for Astronomy, Heidelberg, jointly with the Spanish National Commission for Astronomy
CCD photometry of the type Ia SN 2001V occured in the edge-on spiral galaxy NGC 3987 is presented. The observations made through Johnson-Cousins BVRI filters were collected from Feb. 24 ( days, with respect to B-maximum), up to May 5 ( days). The light curves are analyzed with the revised Multi-Colour Light Curve Shape (MLCS) method (Riess et al., (1998)) by fitting template vectors to the observed light curves simultaneously. The reddening of SN 2001V is estimated to be mag, while the galactic component is mag (Schlegel et al., (1998)), suggesting that part of the reddening may be due to the ISM in the host galaxy. The parameter in MLCS converged to mag, indicating that this SN was overluminous relative to the majority of Type Ia SNe. The inferred distance to its host galaxy, NGC 3987, is Mpc, which is in good agreement with recently determined kinematic distances, based on radial velocity corrected for Virgo-infall and Hubble constant kms-1Mpc-1.
Key Words.:
Stars: supernovae: individual: SN 2001V1 Introduction
SN 2001V was discovered spectroscopically by P. Berlind at the F. L. Whipple Observatory on Feb. 19, 2001 (Jha et al., (2001)). The supernova was immediately classified as of Type Ia based on the Si ii absorption trough at 6150 Å. The blue continuum suggested that this SN was discovered before maximum light. This was also strengthened by the high expansion velocity (14 000 kms-1) derived from the center of the Si ii line. Because the light curves of Type Ia SNe are now frequently used to infer distances to the host galaxies, such SNe that are identified before maximum are very important, because i) the light curve can be sampled more effectively, ii) the inferred distances are better constrained by the light variation around maximum than at later phases.
The host galaxy, NGC 3987 belongs to the small group centered on NGC 4005 (Nilson, (1973), Gregory & Thompson, (1978)). This group is located within the medium-sized cluster Zw 127-10 (Zwicky, et al., (1961)). NGC 3987 is an edge-on, Sbc-type galaxy with remarkable central dust lane. The IRAS point source 11547+2528 is located close to the optical center of this galaxy, which was also detected in radio (Condon & Broderick, (1986)).
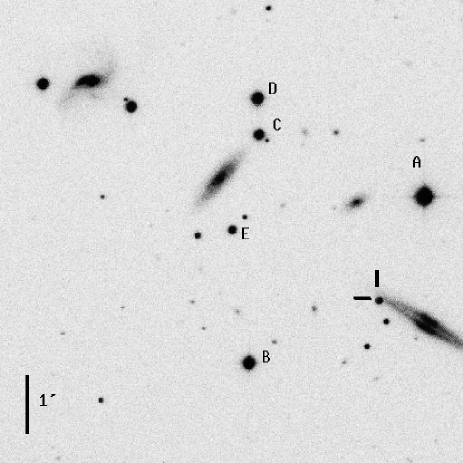
SN 2001V is the first supernova discovered in this galaxy. The SN occured in the outskirts, almost at the visible edge of the host (Fig.1). The position of the SN as well as its blue colour at maximum may suggest that the effect of interstellar extinction is probably not very high for SN 2001V. Indeed, the galactic component of the reddening in this direction is only mag, according to Schlegel et al., (1998).
There are two recent distance estimates for NGC 3987: Mould et al, (1993) lists mag (58.1 Mpc) based on near-IR Tully-Fisher relation, while van Driel et al., (2001) gives kms-1 as a group-averaged radial velocity corrected for Virgo-infall that results in Mpc (adopting kms-1Mpc-1). Based on the average of these distance estimates, the expected maximum brightness of a Type Ia SN is about 14.6 mag. According to the NASA/IPAC Extragalactic Database, the redshift of NGC 3987 is . Thus, SN 2001V is a relatively nearby, low-redshift SN.
In the followings, details of the observations and data reductions are given, then the results of the photometric analysis are presented and discussed.

2 Observations and data reduction
The light variation of SN 2001V was followed on 18 nights, starting from days (with respect to maximum), extending up to days. The applied telescopes and detectors are listed in Table 1. All data were collected through standard Johnson-Cousins filters.
| Code | Obs. | Tel. | CCD | RDN | Pixels | Scale | FoV | FWHM |
|---|---|---|---|---|---|---|---|---|
| A | Konkoly Obs. | 60 cm Schmidt | Photometrics | 14 | 1536x1024 | 1.00¨ | 25.5x17´ | 3.3 |
| B | Konkoly Obs. | 100 cm RCC | Photometrics | 6 | 1024x1024 | 0.29¨ | 5x5´ | 3.1∗ |
| C | Konkoly Obs. | 100 cm RCC | Wright EEV | 10 | 1200x800 | 0.36¨ | 7x5´ | 3.2∗ |
| D | Szeged Obs. | 40 cm Cass | SBIG ST-9 | 13 | 512x512 | 0.70¨ | 6x6´ | 3.0∗ |
| E | Baja Obs. | 50 cm RCC | Apogee AP7 | 18 | 512x512 | 1.29¨ | 11x11´ | 3.3 |
The CCD-frames have been reduced in IRAF111IRAF is distributed by NOAO which is operated by the Association of Universities for Research in Astronomy (AURA) Inc. under cooperative agreement with the National Science Foundation. First, the instrumental magnitudes of the SN and the selected comparison stars (Fig.1) were derived with aperture photometry using the task digiphot/apphot. The radius of the aperture was 6 pixels (about 2 x FWHM, see Table 1), while the sky level was determined in a 5 pixel-wide annulus with inner radius of 10 pixels. Because the SN is located close to the “tip” of NGC 3987, most of the pixels in the annulus were not affected significantly by the light from the host galaxy. The sky level was determined by calculating the modal average (3 x median 2 x mean) of the intensities in the annulus. The calculations were done interactively, and the results were plotted on the screen and inspected visually in order to detect any obvious systematic errors. The average sky level around the SN was always very close to the background around the comparison stars, no clear systematic effect could be found.
Second, the whole dataset have been re-reduced using PSF-photometry (digiphot/daophot), as also advised by the referee of this paper. PSF-photometry is a superior photometric method if the background strongly varies around the objects, and its removal is complicated. Since SN 2001V is somewhat contaminated by its host, the use of PSF-photometry may be useful to separate the light of the SN from that of the galaxy. This method requires bright stars with high S/N to construct a good PSF. Because there are only a few of such stars in the field of NGC 3987, and also the field of view of most of the telescopes used in this study was quite small, a lot of frames contained only 4 - 5 stars around the SN. Nevertheless, the PSF of each frame was determined interactively. The analytic component of the PSF was approximated by the built-in penny2 function in daophot, but in most cases it was based on only 2-3 stars. The frames made with the Schmidt-telescope (Table 1) contained much more field objects, but the PSF on these frames showed significant positional dependence. Therefore, a second-order variable PSF model has been constructed for these pictures, while constant PSF was determined for all other frames. Individual sky levels were calculated for all objects, and the background was subtracted iteratively during the fitting of the PSF in daophot/allstar. Then, the residuals were examined visually on the subtracted frames. The stars as well as the SN were adequately removed from most frames, but slight residuals were present at the position of the brightest stars on some frames. This was probably caused by the uncertainty of the PSF due to the small number of PSF-stars.
Differential magnitudes of SN 2001V have been computed using the comparison stars labeled in Fig.1 (see also Table 2 below). After transforming them to the standard system (Vinkó et al., (2001)), the brightness of the SN was calculated from the calibrated BVRI magnitudes of each comparison star (see below). Then, the SN magnitudes belonging to the same frame were averaged.
In order to search for any systematic effect caused by the reduction procedure, we have compared the SN magnitudes from the aperture- and PSF-photometry. Fig.2 presents the aperture minus PSF-magnitudes in all filters as a function of time. It is apparent that most of the differences are within mag. Naturally, the differences are higher at later phases, when the SN became fainter, but there is no visible systematic trend in the data. We conclude that both the aperture- and PSF-photometry of SN 2001V presented here is affected by approximately the same amount of random errors at the mag level, mainly due to the technical limitations of the applied instruments (lower S/N, small field of view, very few PSF-stars). In order to reduce the uncertainties introduced by the reduction method, the SN magnitudes resulted from both aperture- and PSF-photometry were averaged, and these magnitudes were accepted as the final result.
At first, the magnitudes of the comparison stars were calibrated via Landolt standards, observed at Calar Alto Observatory with the 1.2 m Cassegrain, under photometric conditions on Aug.11, 2001. The reliability of this dataset have been checked by using the calibrated photometry of some of the field stars made by the CfA Supernova Group at the F. L. Whipple Observatory. Because the comparison stars used in this study, and those adopted by the CfA-group were different, we have re-computed the magnitudes of our comparison stars using the CfA-dataset as secondary standards on a set of frames collected with the Schmidt telescope of Konkoly Observatory on March 14, 2001. After performing aperture photometry (with the same parameters described above) and standard transformation, the “Calar Alto” calibration and the “CfA/Konkoly” calibration was found to be fully consistent. The differences between the two datasets were within mag. Finally, the results from the CfA/Konkoly calibration was adopted, in order to keep maximal consistency with data of SN 2001V from other observatories. The final standard magnitudes of the comparison stars are collected in Table 2. The uncertainties reflect the statistical errors given by daophot and also the magnitude differences between the two calibrating datasets.
The calibrated standard magnitudes of SN 2001V are listed in Table 3. The estimated errors of each point are given in parentheses. These uncertainties were calculated as , where is the statistical error given by daophot, is the error due to the photometric method (assumed to be equal to the difference between the aperture- and PSF-photometry, plotted in Fig.2) and is the error introduced by the standard transformation (adopted as 0.03 mag for each data).
| Star | ||||
|---|---|---|---|---|
| A | 10.67 (0.01) | 0.59 (0.02) | 0.44 (0.02) | 0.71 (0.02) |
| B | 12.23 (0.02) | 0.84 (0.02) | 0.48 (0.02) | 0.95 (0.02) |
| C | 13.00 (0.02) | 0.59 (0.03) | 0.36 (0.02) | 0.69 (0.03) |
| D | 12.25 (0.02) | 0.43 (0.05) | 0.28 (0.02) | 0.57 (0.02) |
| E | 14.77 (0.03) | 0.85 (0.06) | 0.49 (0.04) | 0.89 (0.05) |
| JD | Tel. | ||||
|---|---|---|---|---|---|
| 51965.6 | 15.04(0.037) | 15.04(0.033) | 15.04(0.033) | – | A |
| 51967.5 | 14.82(0.051) | 14.84(0.035) | 14.83(0.036) | – | A |
| 51968.4 | 14.72(0.037) | 14.73(0.030) | 14.75(0.041) | 14.91(0.042) | A |
| 51970.5 | 14.79(0.035) | 14.72(0.098) | 14.74(0.043) | – | E |
| 51980.6 | 15.10(0.093) | 14.89(0.061) | 14.72(0.046) | 15.15(0.052) | D |
| 51981.4 | 14.92(0.040) | 14.72(0.030) | 14.68(0.045) | – | E |
| 51983.6 | 15.22(0.098) | 14.86(0.102) | 14.89(0.093) | 15.25(0.060) | D |
| 51985.4 | 15.40(0.092) | 15.00(0.060) | 14.94(0.058) | 15.28(0.095) | D |
| 51985.5 | 15.20(0.050) | 14.89(0.032) | 14.86(0.064) | – | C |
| 51993.5 | 15.93(0.040) | 15.26(0.052) | 15.23(0.034) | 15.31(0.031) | A |
| 51997.5 | 16.51(0.050) | 15.52(0.040) | 15.26(0.050) | 15.27(0.055) | C |
| 52001.5 | 16.89(0.043) | 15.79(0.032) | 15.37(0.034) | – | E |
| 52003.5 | – | 15.78(0.202) | 15.40(0.115) | – | E |
| 52015.5 | – | 16.49(0.163) | 15.99(0.172) | 15.79(0.080) | D |
| 52018.5 | – | 16.52(0.132) | 16.20(0.072) | 15.79(0.090) | D |
| 52023.3 | 17.53(0.036) | 16.55(0.101) | 16.45(0.060) | 16.15(0.100) | A |
| 52031.3 | – | 17.04(0.120) | 16.66(0.095) | 16.42(0.120) | D |
| 52033.5 | – | 17.01(0.110) | 16.81(0.132) | 16.79(0.110) | B |
| 52035.5 | – | 17.06(0.111) | 16.76(0.104) | 16.70(0.121) | B |
The observations listed in Table 3 were compared with the band CCD photometric data of K.Hornoch (Hornoch, (2001)) and found reasonable agreement within mag. More recently Mandel et al., (2002) published mag based on a more extensive photometric dataset. This agrees very well with our template fitting (see next section) resulting in (the larger uncertainty is due to the lack of data around maximum in our photometry). This agreement may give some support to our belief that the data in Table 3 probably do not suffer from large systematic errors.
3 Results

The BVRI light curves were analyzed by the Multi-Colour Light Curve Shape (MLCS) method of Riess et al., (1998) (the SN template vectors were kindly provided by A. Riess). The timescale of the observations was divided by = 1.015 to remove the effect of time dilation. The value of -correction in the band at this redshift varies between and mag (Hamuy et al., (1993)), which is definitely smaller than the uncertainty of our measurements, thus, it was not taken into account. The maximum absolute magnitude of the fiducial light curve was adopted as mag (Richardson et al., (2002)). The fitting was computed simultaneously to all light curves. Details of the procedure are described in Vinkó et al., (2001). The minimum of the was found at the following parameters: = JD 2451973.0 0.2 (fiducial -maximum), = mag, = mag and = mag. The given uncertainties are formal errors corresponding to the geometry of the function around minimum. The fitted light curves are shown in Fig.3. Note, that the parameter given here corresponds to the maximum of the fiducial light curve (with ), the actual maximum of SN 2001V in occured one day later, at JD 2451974.

The parameters above imply some interesting properties of SN 2001V. Comparing the colour excess with the reddening due to Milky Way dust (, Schlegel et al., (1998)), it is visible that the ISM in the host galaxy contributes to the dust absorption. Since NGC 3987 is an edge-on galaxy with strong central dust lane, it is not an unexpected result. The host-galaxy reddening could have been even more severe if the SN had occured closer to the central plane of NGC 3987, like e.g. in the case of SN 1986G (Phillips et al., (1987)), or, more recently SN 2002cv in NGC 3190 (Meikle & Mattila, (2002)).
The reddening was also estimated using the “Lira-Phillips law” (Phillips et al., (1999)) as an independent check of the value given by the MLCS method. This method uses the apparent homogeneity of the unreddened colours of SNe Ia in the phase interval ( is the phase measured from maximum). Unfortunately, there is only one observed data point in Table 3 that can be used for this purpose ( mag). The moment of maximum was estimated from the template light curves fitted by the MLCS method. It occured at = 2451976 JD. After correcting for time dilation, the phase of the observed point was found to be days. The relation
given by Phillips et al., (1999) resulted in . This implies mag, which is not too far from the value given by MLCS. However, its uncertainty is probably higher, because this estimate is based on a single observation, and the “Lira-Phillips law” itself may have an intrinsic uncertainty at the mag level (Li et al., 2001a ). On the other hand, the similarity of the reddening values given by two independent methods may mean that the estimated is close to the real value.
Adopting mag, the total absorption in the , , and bands is , , , mag, respectively, using the galactic reddening law given by Schlegel et al., (1998).
The luminosity parameter implies that SN 2001V is a super-luminous Type Ia SN, relative to the majority of such SNe. Super-luminous SNe are often referred as SN 1991T-, or SN 1999aa-like events (see Li et al., 2001b ). The distinction between different subtypes of SNe Ia is usually based on spectroscopic properties, e.g. the strength of the Si ii trough at 6150 Å. Overluminous SNe Ia have weaker Si ii 6150 Å line, and the Fe iii lines are strong. In addition, SN 1999aa-like events usually show strong Ca ii H & K lines, which are weak in SN 1991T-like SNe. These spectroscopic characteristics correlate with photometric properties: the light curves of SN 1991T-like SNe declines more slowly, and they are bluer in maximum than normal SNe Ia. Thus, overluminous SNe may be recognizable from photometry, e.g. via the MLCS-method.
We do not have spectroscopic data of SN 2001V at our disposal, but two spectra of SN 2001V, obtained around maximum, are available in graphical form from the CfA-website 222http://cfa-www.harvard.edu/cfa/oir/Research/supernova. As the referee of this paper, Dr. Weidong Li, pointed out, these spectra are very similar to that of SN 1999aa: broad, but less prominent Si ii 6150 Å line, strong Fe iii and Ca ii H & K lines. These spectral features fully support our conclusion (based on photometry), that SN 2001V is an overluminous SN Ia.
Note, however, that it is not clear whether the higher luminosity is necessarily connected with the spectroscopic peculiarities. There are examples, such as SN 1992bc (Riess et al., (1998)), that were super-luminous, but otherwise showed normal spectra around maximum. Thus, the overluminosity of some Type Ia SNe might be due to e.g. statistical fluctuation of the ejected 56Ni mass that powers the light curve, rather than a difference in the explosion mechanism or the physical state of the progenitor. Recently Richardson et al., (2002) found that the maximum brightness of SNe Ia has a Gaussian distribution with mag (corrected for the effect of extinction).
From yet unpublished photometry, recently Mandel et al., (2002) concluded that SN 2001V was a “normal” Type Ia event, with light and colour curves very similar to SN 1990N. On the other hand, they also determined the initial decline rate, and found . This decline rate may suggest an overluminous, rather than a “normal” SN Ia (e.g. Hamuy et al., (1996)). Although our photometry has less accuracy and phase coverage, we also attempted to estimate this parameter and found . According to the correlation between and (e.g. Riess et al., (1998)), this is consistent with the parameter given by the MLCS-method. Furthermore, Fig.4 shows the essential similarity of the light curves of SN 2001V with that of SN 1991T (, Hamuy et al., (1996)).
Thus, all available data consistently support the conclusion that SN 2001V was an intrinsically bright SN Ia. At maximum, it was brighter than the fiducial Type Ia SN by about 0.5 mag. Adopting the parameters given by the MLCS-method, the inferred absolute magnitudes of SN 2001V at maximum are
= mag
= mag
= mag
= mag
The true distance modulus, mag, corresponds to Mpc. The uncertainty given here is the formal error of the fitting, and does not include possible systematic effects, such as the zero-point of the SN distance scale. The MLCS distance marginally agrees with the kinematic distance of NGC 3987 corrected for Virgo-infall (67 Mpc, see Sect.1), the difference is about . The Tully-Fisher distance (58 Mpc, Sect.1) is about 20 percent shorter. The TF distance modulus (, Mould et al, (1993)) can be brought into agreement with the MLCS distance by adding 0.54 mag to the previous one, in accord with the suggestion by Shanks (Shanks, (1997)) for matching the TF and SN distance scales.
4 Summary
The results of this paper can be summarized as follows.
-
1.
We presented BVRI photometry of SN 2001V starting from 8 days before maximum light and extending up to 60 days past maximum.
-
2.
The reddening was estimated by applying the MLCS template fitting method for all light curves. This resulted in mag, indicating that there was significant extinction in the host galaxy affecting the light from SN 2001V. The empirical “Lira-Phillips law” gave similar, but slightly higher colour excess ( mag). Its uncertainty is probably higher, because it is based only a single observation. Therefore, the result from the MLCS-method was accepted as final.
-
3.
The light curve analysis indicates that SN 2001V was an over-luminous SN by about 0.5 mag relative to the fiducial SN Type Ia. This is consistently supported by the overall similarity of the light curves and the decline rate with those of SN 1991T, and also the publicly available spectra of SN 2001V. The spectral features suggest that SN 2001V may be a SN 1999aa-like object (Li et al., 2001b ).
-
4.
The SN distance was inferred from the MLCS method and found to be 74.5 Mpc. This marginally agrees with the previous kinematic distance, but about 20 percent longer than the Tully-Fisher distance of NGC 3987.
Acknowledgements.
This work was supported by Hungarian OTKA Grants No. T032258, T034615, the “Bolyai János” Research Scholarship to JV, the OM FKFP 0010/2001 grant from Hungarian Ministry of Education, Pro Renovanda Cultura Hungariae Foundation and MTA-CSIC Joint Project No.15/1998 from Hungarian and Spanish Academy of Sciences. We acknowledge the permission by Prof. A. Riess to use the MLCS template vectors. We thank the referee, Dr. Weidong Li, for a lot of critical comments and suggestions that helped us to improve the paper. We are grateful to Dr. T. Matheson and the Supernova Group led by Prof. R. Kirshner at the Harvard-Smithsonian Center for Astrophysics for providing their calibration data prior to publication. Thanks are also due to Dr. L.L.Kiss for his kind help during some observing sessions carried out at Szeged Observatory. The NASA Astrophysics Data System, the SIMBAD and NED databases and the Canadian Astronomy Data Centre were frequently used to access data and references. The availability of these services are gratefully acknowledged.References
- Condon & Broderick, (1986) Condon, J.J. & Broderick, J.J. 1986, AJ 92, 94
- Gregory & Thompson, (1978) Gregory, S.A. & Thompson, L.A. 1978, ApJ 222, 784
- Hamuy et al., (1993) Hamuy, M., Phillips, M.M., Wells, L.A. & Maza, J. 1993, PASP 105, 787
- Hamuy et al., (1996) Hamuy, M., Phillips, M.M., Suntzeff, N.B. et al. 1996, AJ 112, 2438
- Hornoch, (2001) Hornoch, K. 2001, IAU Circ. No. 7612
- Jha et al., (2001) Jha, S., Matheson, T., Challis, P. & Kirshner, R. 2001 IAU Circ. No.7585
- (7) Li, W., Filippenko, A., Gates, E. et al. 2001a, PASP 113, 1178
- (8) Li, W., Filippenko, A., Treffers, R.R. et al. 2001b, ApJ 546, 734
- Mandel et al., (2002) Mandel, K., Jha, S., Matheson, T. et al. 2002, poster 47.04 on AAS 199th meeting, Washington DC, Session 47.
- Meikle & Mattila, (2002) Meikle, P., & Mattila, S. 2002, IAU Circ. No. 7911
- Mould et al, (1993) Mould, J.R., Akeson, R.L., Bothun, G.D. et al. 1993, ApJ 409, 14
- Nilson, (1973) Nilson, P. 1973, Uppsala General Catalogue of Galaxies (Uppsala Astr. Obs. Ann., Vol. 6)
- Phillips et al., (1987) Phillips, M.M., Phillips, A.C., Heathcote, S.B. et al. 1987, PASP 99, 592
- Phillips et al., (1999) Phillips, M.M., Lira, P., Suntzeff, N.B. et al. 1999, AJ 118, 1766
- Richardson et al., (2002) Richardson, D., Branch, D., Casebeer, D. et al. 2002, AJ 123, 745
- Riess et al., (1998) Riess, A.G., Filippenko, A.V., Challis, P. et al. 1998, AJ 116, 1009
- Schlegel et al., (1998) Schlegel, D., Finkbeiner, D. & Davis, M. 1998, ApJ 500, 525
- Shanks, (1997) Shanks, T. 1977, MNRAS 290, L77
- van Driel et al., (2001) van Driel, W., Marcum, P., Gallagher, J.S. et al. 2001, A&A 378, 370
- Vinkó et al., (2001) Vinkó, J., Csák, B., Csizmadia, Sz. et al. 2001, A&A 372, 824
- Zwicky, et al., (1961) Zwicky, F., Herzog, E. & Wild, P. 1961, Catalog of Galaxies and Clusters of Galaxies (Pasadena: California Institute of Technology)