Interaction between the Northeastern Boundary of Sgr A East and Giant Molecular Clouds
Abstract
We have detected the and lines of H2 in the Galactic centre, in a arcsec region between the northeastern boundary of the non-thermal source, Sgr A East, and the giant molecular cloud (GMC) M-0.02-0.07. The detected emission has an intensity of 1.6 – 21 and is present over most of the region. Along with the high intensity, the broad line widths (FWHM = 40 – 70 ) and the to line ratios (0.3 – 0.5) can be best explained by a combination of C-type shocks and fluorescence. The detection of shocked H2 is clear evidence that Sgr A East is driving material into the surrounding adjacent cool molecular gas. The H2 emission lines have two velocity components at +50 and 0 , which are also present in the NH3(3,3) emission mapped by McGary, Coil, & Ho (2001). This two-velocity structure can be explained if Sgr A East is driving C-type shocks into both the GMC M-0.02-0.07 and the northern ridge of McGary, Coil, & Ho (2001).
keywords:
Galaxy: centre – ISM: individual(Sgr A East), molecules – infrared: ISM: lines and bands1 Introduction
Sgr A East has frequently been interpreted as a supernova remnant due to its shell structure and non-thermal spectrum (Jones 1974; Goss et al. 1983 and references therein; and see the more recent references in Maeda et al. 2002). Some recent research, however, has suggested that the energetics, size, and elongated morphology ( arcmin or pc at kpc) of Sgr A East cannot have been produced by a typical supernova (Yusef-Zadeh & Morris, 1987; Mezger et al., 1989). Mezger et al. (1989) estimate the required energy to produce Sgr A East to be more than ergs. Modeling of the entire spectrum of Sgr A East by Fatuzzo et al. (1999), which fits very well with the observations of the non-thermal emission of Sgr A East and EGRET -ray sources, supports the energy estimate by Mezger et al. (1989). Those authors concluded that a single supernova explosion could explain the existence of Sgr A East only if it occurred within the cavity formed by the stellar wind from a progenitor star. In that scenario, however, the formation of the cavity takes too much time ( yr) compared with the orbital period ( yr) of matter circling around the Galactic centre (Mezger et al., 1989).
Yusef-Zadeh & Morris (1987) suggested that a different kind of explosive event could create Sgr A East. The energy required to make a huge shell such as Sgr A East has been associated with a ‘hypernova’ (Woosley, Eastman, & Schmidt, 1999). Khokhlov & Melia (1996) hypothesize that Sgr A East may be the remnant of a solar mass star tidally disrupted by a massive black hole. Their model can naturally explain the elongated shape of Sgr A East as well as the extreme energetics. However, from their observation with the Chandra X-ray Observatory, Maeda et al. (2002) suggest that Sgr A East should be classified as a metal-rich ‘mixed morphology’ supernova remnant . They argue that the model of Khokhlov & Melia (1996) cannot reproduce the metal-rich abundances observed at the centre of Sgr A East. They also conclude that a single Type II supernova explosion with an energy of ergs into an homogeneous ambient medium with a density of can most simply explain the results of both radio and X-ray observations, and thus that the extreme energy of ergs is not required.
In principle, the energy of the explosive event can be directly measured by studying regions where Sgr A East is colliding with ambient interstellar material. By tracing the dynamics of molecular gas, an interaction between the eastern part of Sgr A East and the giant molecular cloud (GMC) M-0.02-0.07 (also known as the ‘ cloud’) has been inferred (Genzel et al., 1990; Ho et al., 1991; Serabyn, Lacy, & Achtermann, 1992; Mezger, Duschl, & Zylka, 1996; Novak, 1999; Coil & Ho, 2000). Recent observations of NH3(3,3) emission in the region show that Sgr A East impacts material to the north and west as well (see Fig. 1) (McGary, Coil, & Ho, 2001). As direct evidence of this interaction, several 1720 MHz OH masers, which are a good diagnostic of the continuous, or C-type, shock excitation (Frail et al., 1996; Wardle, Yusef-Zadeh, & Geballe, 1999), have been detected along the southern edge of Sgr A East and to the north of the circum-nuclear disc (CND) (Yusef-Zadeh et al., 1996).
Wardle et al. (1999) and Yusef-Zadeh et al. (1999b, 2001) detected H2 line emission in regions where OH-masers have been detected. In most cases H2 line emission arises either from thermal excitation (e.g. by shock heating) or from non-thermal excitation by far-UV absorption (Black & van Dishoeck, 1987; Burton, 1992; Pak et al., 1998). One can in principle distinguish between these two mechanisms by comparing near-infrared (near-IR) line intensities. The / ratio has been an effective discriminant in a number of shocked regions (where the ratio should be ) and photodissociation regions (PDRs) (where it is about 0.5 – 0.6). However, a ‘thermal’ line ratio can be observed in a PDR – even though fluorescence is the dominant excitation mechanism – if the gas density is high (; Sternberg & Dalgarno 1989). Gatley et al. (1984) observed the CND and concluded that the H2 molecules are excited by collisions, while the results for larger regions (about deg2) by Pak, Jaffe, & Keller (1996a, b) are consistent with non-thermal excitation. The interpretation of Wardle et al. (1999) and Yusef-Zadeh et al. (1999b, 2001) that the line emission in Sgr A East is thermal is supported by the presence of the 1720 MHz OH masers. It is therefore likely that Sgr A East is indeed driving shocks into the adjacent GMCs to the south and into the CND.

The fields observed by Wardle et al. (1999) and Yusef-Zadeh et al. (1999b, 2001) are restricted to the vicinity of the CND and cover only some of the regions where interaction of the Sgr A East shell with surrounding material is expected. Before one can hope to estimate the energy released in the event that created Sgr A East, it is necessary to observe additional interaction regions in diagnostic lines of H2 at high spectral resolution. In this paper we present velocity-resolved, near-IR H2 observations at the northeastern boundary of Sgr A East. By measuring / line ratios and line profiles simultaneously we aim to study the excitation and kinematics of the interaction between Sgr A East and M-0.02-0.07.
2 Observation and Data reduction
We observed the and the spectra at the 3.8 m United Kingdom Infra-Red Telescope (UKIRT) in Hawaii on 2001 August 3 and 4 (UT), using the Cooled Grating Spectrometer 4 (CGS4; Mountain et al. 1990) with a 31 l/mm echelle grating, 300 mm focal length camera optics and a two-pixel-wide slit. The spatial resolution along the slit was 0.90 arcsec for with the grating angle of 64 691 and 0.84 arcsec for with 62 127, respectively; the slit widths on the sky were 0.83 and 0.89 arcsec, respectively, for these two configurations. The slit length is 90 arcsec. The instrumental resolutions, measured from Gaussian fits to sky lines in our raw data, were for and for , respectively.
Ten parallel slit positions were observed, sampling a arcsec area on the northeastern boundary of Sgr A East. The slit was oriented east of north for each measurement; adjacent slit positions were separated by 3 arcsec perpendicular to the slit axis. The coordinates at the centre of the observed area are (J2000) (see Fig. 1). The southwestern part of this region includes the ‘outer H2 clumps’ from which H2 emission was detected by Yusef-Zadeh et al. (2001). Only the ninth slit position, hereafter called ‘Slit 9’, was observed in both and . The telescope was nodded between object and blank sky positions every 25 minutes, to subtract the background and telluric OH line emission. The sky positions were offset by about 2 5 () from the on-source positions.

Initial data reduction steps, involving bias-subtraction and flat-fielding (using an internal blackbody lamp), were accomplished by the automated Observatory Reduction and Acquisition Control (orac) pipeline at UKIRT. iraf was used for the remainder of the reduction. We corrected the spectral distortion along the dispersion axis using the spectrum of the standard star HR 6496 as a template. The sky OH lines were then used to correct for spatial distortion perpendicular to this axis and also for wavelength calibration. We also corrected for the motions of the Earth and Sun in order to determine local standard of rest (LSR) velocities.
Only part of the flux from a standard star is detected due to the narrow slit; hence for proper flux calibration the measured signal must be corrected. We assumed a circularly symmetric PSF for the star, based on the flux profile along the slit length, to estimate the missing flux. The correction factor, which varies with the seeing, ranged from 2.06 to 2.56. Near-IR emission from the Galactic centre is attenuated by interstellar material in the foreground (mostly 4 – 8 kpc from the Galactic centre) and by material in the Galactic centre itself. Since we believe that the H2 line emission originates from the surface of the cloud, we ignore the latter (Pak et al., 1996a, b) and correct only for foreground extinction; which we assume to be mag (Catchpole, Whitelock, & Glass, 1990).

3 Results and Discussion
3.1 emission
Bright (1.6 – 21 ) H2 emission was detected from most of the observed region ( arcsec) along the northeastern boundary of Sgr A East. We created a SE–NW cut parallel to the boundary of Sgr A East (‘Cut B’) by extracting spectra from each of the ten slit positions. A second cut perpendicular to the boundary (i.e., SW–NE) is composed of six positions from Slit 9. The positions of Cut B and Slit 9 are marked in Fig. 1. Along Cut B, the intensity of NH3 emission varies dramatically; we can investigate both high and low density regions along this cut. Slit 9 is the only slit observed both in and , the line ratio of which we can use to constrain models for the excitation of H2. In this paper, we present the results of these two cuts, rather than the whole data set, as a preliminary report. We aim to concentrate on the excitation mechanism of the detected H2 emission, and the map the structure and kinematics perpendicular to and parallel to the boundary. From the sixteen spectra in Figs. 2 & 3 we measure line centres and line widths along the interaction region. Each spectrum is well fitted by one or two Gaussian components.
Figs. 4 & 5 show the distributions of the derived line parameters along Cut B and Slit 9, respectively. For direct comparison, we include in these figures data from the NH3(3,3) observations of McGary et al. (2001); the NH3 emission essentially traces the cool ( K), dense (), cloud material. From these data we note the following.
- •
- •
-
•
Along Cut B, the distribution of the total intensity of H2 (the solid line in Fig. 4(c)) is quite different from the NH3 (the dashed line; the units are arbitrarily scaled). The NH3 emission increases to the southeast as the cut passes deeper into the body of the GMC M-0.02-0.07, but the H2 emission decreases in this direction. The decrease in H2 may be explained either by exhaustion of the source of excitation (e.g. shock energy or UV photons) or by obscuration, at the inner, more dense, regions of the cloud, or by the geometry of the interaction region (see Section 3.3).

Figure 5: Derived line parameters for the spectra along Slit 9. Indicated positions are as in Fig. 3; positive towards NE. Identities of plotted quantities are as in Fig. 4. The decrease in NH3 flux at positions greater than is a result of reduced sensitivity at the edge of the mosaic (McGary et al., 2001). -
•
Along Slit 9, the distribution of the H2 intensity (solid line) in Fig. 5(c) is generally similar to that of NH3 (dashed line). It should be noted that NH3 is attenuated at positions greater than by the edge of the primary beam in the VLA mosaic (McGary et al., 2001). There is a small discrepancy between NH3 and H2 between and which may be the result of the same effects discussed in Cut B. Note that Slit 9 covers a very large spatial scale (90 arcsec). The brightest emission along Slit 9, between offsets to (the southwestern part), arises from the outer H2 clumps of Yusef-Zadeh et al. (2001).
3.2 H2 excitation
The line was detected at three locations along Slit 9, at positions NE , SW , and SW relative to the centre of the slit (; J2000). From these data we measured line ratios ( / ) of , , and , respectively (see Fig. 3). At other positions only the line was detected, with 3 upper limits to the ratio of 0.5, 0.6, and 0.1 at offsets of NE , NE , and SW along Slit 9, respectively.
Fluorescent excitation in a low-density PDR () should yield a ratio of about 0.6. A lower ratio is expected in a more dense PDR environment (Black & van Dishoeck, 1987), or in a shock. There are two basic types of shock; ‘jump’ or J-type and ‘continuous’ or C-type (see Draine & McKee 1993 for a review). A J-type shock is formed in a highly ionized or weakly magnetized gas. Fluid parameters such as density and temperature undergo a discontinuous change (jump) at the shock front where the molecules may be dissociated. J-type shocks (with velocities greater than about 24 ) will completely dissociate the molecules (Kwan, 1977); H2 emission occurs from a warm, recombination plateau in the post-shock region. J-type shocks typically produce low line intensities and line ratios as large as 0.5 are possible (Hollenbach & McKee, 1989). At lower shock velocities, below the H2 dissociation speed limit, J-type shocks may yield much lower line ratios; (Smith, 1995). In a C-type shock, where the magnetic field softens the shock front via ion-magnetosonic wave propagation so that the fluid parameters change continuously across the shock front, the H2 dissociation speed limit is much higher ( 45 ; depending on the density and magnetic field strength in the pre-shock gas). Smaller line ratios of about 0.2 are then predicted (Smith, 1995; Kaufman & Neufeld, 1996).
From the observed ratios alone we are not able to unambiguously distinguish between excitation mechanisms. Our results can either be explained by fast J-type shocks or dense PDRs, or by a combination of fluorescence and either C-type shocks or slow J-type shocks, since the higher line ratios associated with fluorescence will be tempered by the low intensities associated with collisional excitation in shocks.
To help distinguish between the H2 excitation mechanisms, we consider kinematic information and the spatial variation of the line ratio along slit 9 . At most positions in Figs. 4(b) & 5(b), the H2 line widths are high (typically 40 – 70 , but as high as 120 in some positions). This suggests shock excitation and turbulent motions in the gas and tends to exclude the pure fluorescence models (in which the H2 line emission generally arises from the stationary gas at the edges of neutral clouds illuminated by Far-UV photons from early-type stars). However, in other shocked regions the line ratio is found to be constant over a wide range of intensities and spatial positions (Davis & Smith, 1995; Richter, Graham, & Wright, 1995), although this is not necessarily predicted from theory (Draine & McKee, 1993). Conversely, in a PDR the ratio is sensitive to the incident FUV flux and the molecular gas density (the intensity increases but the / ratio decreases with increasing gas density or UV intensity; Usuda et al. 1996; Takami et al. 2000). Thus an unchanging ratio is found in shocks, while a varying ratio is expected in the pure fluorescent case. The measured line ratio and the intensity in Fig. 5(c), show evidence of an anti-correlation in our data, as expected in dense PDRs. Although the wide line profiles point to shock excitation, fluorescence appears to play a significant role at at least some locations.
Considering the kinematics further, we note that J-type shocks produce narrow lines that peak at the velocity of the shock, while C-type shocks produce broader lines which peak at the velocity of the pre-shock gas and extend up to the shock velocity. Figs. 4(a) & 5(a) show that there are two velocity components that are similar in H2 and NH3. The H2 emission traces hot ( K) gas and the NH3 cool ( K) gas. Thus, if we assume that shocks are driven by Sgr A East into cold molecular gas, whose velocities are given by the NH3 data, then fast J-type shocks are inconsistent with our results, due to the low peak velocities of the H2 lines relative to the molecular clouds.
In summary, then, the wide line profiles and low peak velocities indicate C-type shock excitation. However, the high values of the line ratio at some positions along Slit 9 and the spatial variation in that ratio, point to a fluorescent component to the excitation in some locations. A combination of C-type shocks and fluorescence (see e.g. Fernandes, Brand, & Burton 1997) is therefore the most reasonable explanation for the H2 excitation. For the fluorescence, the source of the UV radiation could be either nearby early type stars or J-type shocks. However, as noted above, we see no evidence of J-type shocks in our data. Also, we cannot establish whether nearby stars are the source of the UV flux due to the lack of information on where or how many early type stars there are in the region.
3.3 Structure of the interaction region
The extended +50 component of the NH3 emission traces the GMC M-0.02-0.07, while the 0 component corresponds to the ‘northern ridge’ of McGary et al. (2001) (see the NH3(3,3) channel maps in their Fig. 4). The NH3 component at +20 seen in Fig. 5(a) at negative offsets seems to trace hotter gas according to the NH3(2,2) to (1,1) line ratio map by McGary et al. (2001), which they suggest may be the result of an impact by Sgr A East.
The difference in line width between NH3 and H2 as well as the different spatial locations of their 0 features (Fig. 5(a)) indicate that the NH3 and H2 trace fundamentally different components of the gas. The narrow NH3 line widths arise in ambient clouds. The broader H2 line emission traces shocked gas where the NH3 molecules are likely destroyed. One can envision a situation in which Sgr A East is located adjacent to both M-0.02-0.07 (the +50 component) and the northern ridge (the 0 component), with Sgr A East driving C-type shocks into these clouds.
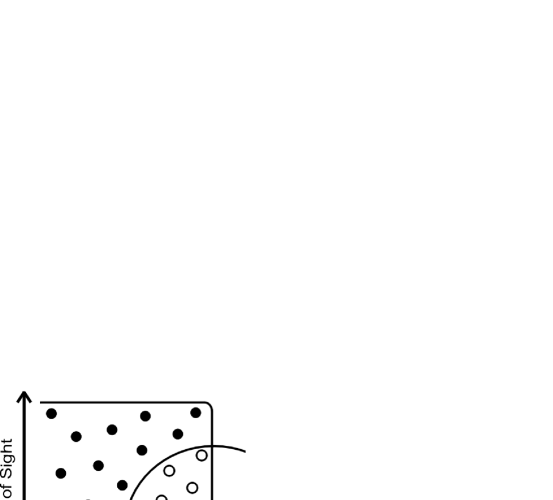
On the other hand, the fact that the two H2 velocity components overlap along the line-of-sight, yet are roughly equally bright seems somewhat unlikely, as one must be attenuated by the molecular cloud associated with the other. The rough equality might be explained by clumpiness of the foreground cloud, regardless of which one is in the foreground, where a small filling factor of high density clumps are embedded within a less dense medium (Burton, Hollenbach, & Tielens, 1990). The size of such clumps seems to be – pc (Garay, Moran, & Reid, 1987; Churchwell et al., 1987), which is smaller than our resolution of 1 arcsec ( pc at the distance of 8.5 kpc to the Galactic center). As illustrated in Fig. 6, this clumpy structure could explain both the observed decrease of NH3 line emission and the observed increase of H2 line emission toward the edge of the cloud (see the +50 components in Figs. 4(c) & 5(c)).
4 Conclusion
We observed the northeastern part of the Sgr A East shell in order to investigate its interaction with the GMC M-0.02-0.07. The bright emission is strong evidence that Sgr A East is physically adjacent to, and interacting with, M-0.02-0.07.
By comparing the relative intensities of and emission, the distribution of the / line ratio, and the radial velocities of the H2 emission, we can to some extent distinguish between excitation mechanisms for the H2. The line ratios tend to support emission in either fast J-type shocks or a dense PDR. However, on considering the bright intensity, the large line widths, and the spatial variation in the line ratio, we conclude that a combination of C-type shocks and fluorescence is required. The presence of shocks is direct evidence that Sgr A East is driving into the surrounding material, and is consistent with the detection of 1720 MHz OH masers to the north of the CND and to the south of Sgr A East (Yusef-Zadeh et al., 1996). Very recently Karlsson et al. (2003) detected the 1720 MHz OH masers also at two positions near our target region, which is more direct evidence supporting our conclusion on the C-type shocks.
The H2 emission covers most parts of our targeted region ( arcsec). The line profiles are made up of two velocity components both of which extend over a significant portion of the region ( arcsec). We find that the NH3(3,3) emission lines observed by McGary et al. (2001) also show a similar kinematic structure, with almost the same velocities. We suggest that the H2 line emission arises at the interfaces between Sgr A East and two independent molecular clouds, with line-of-sight velocities of +50 (M-0.02-0.07) and 0 (the northern ridge). Both the observed two velocity components of the H2 emission and the difference in the intensity distributions between the H2 and NH3 emission can be understood if the molecular clouds are composed of small dense clumps with a very small filling factor.
To study the origin and evolution of Sgr A East, it would be important to know the total H2 luminosity and the total cooling rate (based on that) over the interaction region, which could be compared with those of well studied SNRs. However, it is very difficult to estimate them with the small amount of information we have at present. Given the uncertainty in the emission mechanisms, even estimating the total H2 luminosity in the small mapped region would be difficult, without considering the entire interaction region. It would be premature for us to estimate the required energy to make the Sgr A East shell. We will be able to do this in the future, after observations of more of the interaction region.
Acknowledgments
We give special thanks to Young-Sam Yu and Tae-Hyun Kim for their help with the observation. Fig. 1 is reproduced from Fig. 10 of McGary et al. (2001) by permission of the AAS. The United Kingdom Infrared Telescope is operated by the Joint Astronomy Centre on behalf of the U.K. Particle Physics and Astronomy Council. This work was financially supported by the BK21 Project of the Korean Government. TRG’s research is supported by the Gemini Observatory, which is operated by the Association of Universities for Research in Astronomy, Inc., on behalf of the international Gemini partnership of Argentina, Australia, Brazil, Canada, Chile, the United Kingdom and the United States of America.
References
- Black & van Dishoeck (1987) Black J.H., van Dishoeck E.F., 1987, ApJ, 322, 412
- Burton (1992) Burton M.G., 1992, Aust. J. Phys., 45, 463
- Burton et al. (1990) Burton M.G., Hollenbach D.J., Tielens A.G.G.M., 1990, ApJ, 365, 620
- Catchpole et al. (1990) Catchpole R.M., Whitelock P.A., Glass I.S., 1990, MNRAS, 247, 479
- Coil & Ho (2000) Coil A.L., Ho P.T.P., 2000, ApJ, 533, 245
- Churchwell et al. (1987) Churchwell E., Wood D.O.S., Felli M., Massi M., 1987, ApJ, 321, 516
- Davis & Smith (1995) Davis C.J., Smith M.D., 1995, ApJ, 443, L41
- Draine & McKee (1993) Draine B.T., McKee C.F., 1993, ARA&A, 31, 373
- Fatuzzo et al. (1999) Fatuzzo M., Melia F., Yusef-Zadeh F., Markoff S., 1999, in Falcke H. et al., eds, ASP Conf. Ser. Vol. 186, The Central Parsecs of the Galaxy. Astron. Soc. Pac., San Francisco, p. 560
- Fernandes et al. (1997) Fernandes A.J.L., Brand P.W.J.L., Burton M.G., 1997, MNRAS, 290, 216
- Frail et al. (1996) Frail D.A., Goss W.M., Reynoso E.M., Green A.J., Otrupcek R., 1996, AJ, 111, 1651
- Garay et al. (1987) Garay G., Moran J.M., Reid M.J., 1987, ApJ, 314, 535
- Gatley et al. (1984) Gatley I., Jones T.J., Hyland A.R., Beattie D.H., Lee T.J., 1984, MNRAS, 210, 565
- Genzel et al. (1990) Genzel R., Stacey G.J., Harris A.I., Geis N., Graf U.U., Poglitsch A., Sutzki J., 1990, ApJ, 356, 160
- Goss et al. (1983) Goss W.M., Schwarz U.J., Ekers R.D., van Gorkom J.H., 1983, in Danziger J., Gorenstein P., eds, Proc. IAU Symp. 101, Supernova Remnants and Their X-Ray Emission. Dordrecht, Reidel, p. 65
- Ho et al. (1991) Ho P.T.P., Ho L.C., Szczepanski J.C., Jackson J.M., Armstrong J.T., Barrett A.H., 1991, Nat, 350, 309
- Hollenbach & McKee (1989) Hollenbach D., McKee C.F., 1989, ApJ, 342, 306
- Jones (1974) Jones T.W., 1974, A&A, 30, 37
- Karlsson et al. (2003) Karlsson R., Sjouwerman L.O., Sandqvist Aa., Whiteoak J.B., 2003, submitted to A&A
- Kaufman & Neufeld (1996) Kaufman M.J., Neufeld D.A., 1996, ApJ, 456, 611
- Khokhlov & Melia (1996) Khokhlov A., Melia F., 1996, ApJ, 457, L61
- Kwan (1977) Kwan J., 1977, ApJ, 216, 713
- Maeda et al. (2002) Maeda Y. et al., 2002, ApJ, 570, 671
- McGary et al. (2001) McGary R.S., Coil A.L., Ho P.T.P., 2001, ApJ, 559, 326
- Mezger et al. (1996) Mezger P.G., Duschl W.J., Zylka R., 1996, ARA&A, 7, 289
- Mezger et al. (1989) Mezger P.G., Zylka R., Salter C.J., Wink J.E., Chini R., Kreysa E., Tuffs R., 1989, A&A, 209, 337
- Mountain et al. (1990) Mountain C.M., Robertson D.J., Lee T.J., Wade R., 1990, in Crawford D.L., ed., Proc. SPIE Vol. 1235, Instrumentation in Astronomy VII. SPIE, Bellingham, p. 25
- Novak (1999) Novak G., 1999, in Falcke H. et al., eds, ASP Conf. Ser. Vol. 186, The Central Parsecs of the Galaxy. Astron. Soc. Pac., San Francisco, p. 488
- Pak et al. (1996a) Pak S., Jaffe D.T., Keller L.D., 1996a, ApJ, 457, L43
- Pak et al. (1996b) Pak S., Jaffe D.T., Keller L.D., 1996b, in Gredel R., ed., ASP Conf. Ser. Vol. 102, The Galactic Center. Astron. Soc. Pac., San Francisco, p. 28
- Pak et al. (1998) Pak S., Jaffe D.T., van Dishoeck E.F., Johansson L.E.B., Booth R.S., 1998, ApJ, 498, 735
- Richter et al. (1995) Richter M.J., Graham J.R., Wright G.S., 1995, ApJ, 454, 277
- Serabyn et al. (1992) Serabyn E., Lacy J.H., Achtermann J.M., 1992, ApJ, 395, 166
- Smith (1995) Smith M.D., 1995, A&A, 296, 789
- Sternberg & Dalgarno (1989) Sternberg A., Dalgarno A., 1989, ApJ, 338, 197
- Takami et al. (2000) Takami M., Usuda T., Sugai H., Kawabata H., Suto H., Tanaka M., 2000, ApJ, 529, 268
- Usuda et al. (1996) Usuda T., Sugai H., Kawabata H., Inoue M.Y., Kataza H., Tanaka M., 1996, ApJ, 464, 818
- Wardle et al. (1999) Wardle M., Yusef-Zadeh F., Geballe T.R., 1999, in Falcke H. et al., eds, ASP Conf. Ser. Vol. 186, The Central Parsecs of the Galaxy. Astron. Soc. Pac., San Francisco, p. 432
- Woosley et al. (1999) Woosley S.E., Eastman R.G., Schmidt B.P., 1999, ApJ, 516, 788
- Yusef-Zadeh & Morris (1987) Yusef-Zadeh F., Morris M., 1987, ApJ, 320, 545
- Yusef-Zadeh et al. (1996) Yusef-Zadeh F., Roberts D.A., Goss W.M., Frail D.A., Green A.J., 1996, ApJ, 466, L25
- Yusef-Zadeh et al. (1999a) Yusef-Zadeh F., Roberts D.A., Goss W.M., Frail D.A., Green A.J., 1999a, ApJ, 512, 230
- Yusef-Zadeh et al. (2001) Yusef-Zadeh F., Stolovy S.R., Burton M., Wardle M., Ashley M.C.B., 2001, ApJ, 560, 749
- Yusef-Zadeh et al. (1999b) Yusef-Zadeh F., Stolovy S.R., Burton M., Wardle M., Melia F., Lazio T.J.W., Kassim N.E., Roberts D.A., 1999b, in Falcke H. et al., eds, ASP Conf. Ser. Vol. 186, The Central Parsecs of the Galaxy. Astron. Soc. Pac., San Francisco, p. 197