A Spectroscopic Survey of Subarcsecond Binaries in the Taurus-Auriga Dark Cloud with the Hubble Space Telescope 11affiliation: Based on observations made with the NASA/ESA Hubble Space Telescope, obtained at the Space Telescope Science Institute, which is operated by the Association of Universities for Research in Astronomy, Inc., under NASA contract NAS5-26555.
Abstract
We report the results of a spectroscopic survey of 20 close T Tauri binaries in the Taurus-Auriga dark cloud where the separations between primaries and their secondaries are less than the typical size of a circumstellar disk around a young star. Analysis of low-resolution and medium-resolution STIS spectra yields the stellar luminosities, reddenings, ages, masses, mass accretion rates, IR excesses, and emission line luminosities for each star in each pair. We examine the ability of IR color excesses, H equivalent widths, [O I] emission, and veiling to distinguish between weak emission and classical T Tauri stars. Four pairs have one cTTs and one wTTs; the cTTs is the primary in three of these systems. This frequency of mixed pairs among the close T Tauri binaries is similar to the frequency of mixed pairs in wider young binaries. Extinctions within pairs are usually similar; however, the secondary is more heavily reddened than the primary in some systems, where it may be viewed through the primary’s disk. Mass accretion rates of primaries and secondaries are strongly correlated, and H luminosities, IR excesses, and ages also correlate within pairs. Primaries tend to have somewhat larger accretion rates than their secondaries do, and are typically slightly older than their secondaries according to three different sets of modern pre-main-sequence evolutionary tracks. Age differences for XZ Tau and FS Tau, systems embedded in reflection nebulae, are striking; the secondary in each pair is less massive but more luminous than the primary. The stellar masses of the UY Aur and GG Tau binaries measured from their rotating molecular disks are about 30% larger than the masses inferred from the spectra and evolutionary tracks. This discrepancy can be resolved in several ways, among them a 10% closer distance for the Taurus-Auriga dark cloud.
1 INTRODUCTION
A large body of work in the last two decades has established that binaries with active accretion disks are the most common way that stars form. Surveys of regions of star formation using speckle images (Ghez et al., 1993; Leinert et al., 1993) and lunar occultations (Simon et al., 1999) have established that binaries are ubiquitous among the youngest stars. Direct imaging (McCaughrean & O’Dell, 1996; Padgett et al., 1999) and surveys of infrared excesses (Haisch et al., 2001) have discovered circumstellar disks around many newly-formed stars. Most young circumstellar disks accrete onto their central stars, as evidenced by inverse P-Cygni line profiles (Edwards et al., 1994) and excess emission from the accretion hot spot at optical and ultraviolet wavelengths (e.g. Hartigan et al., 1995; Gullbring et al., 1998).
To understand how stars form we must address several fundamental questions concerning binaries and their disks. One of the most basic of these is whether or not the components of a young binary have the same age. If capture plays a role in binary formation then a range of ages should occur within pairs, while if the secondary forms out of a disk around the primary then the secondary should be younger than the primary. If the relative location of primaries and their secondaries is consistent throughout the HR-diagram, it may be possible to measure the location of isochrones that must be reproduced by theoretical models of young stars.
While most pairs generally fall along isochrones derived from theoretical pre-main-sequence evolutionary tracks (Hartigan et al., 1994; Brandner & Zinnecker, 1997; White et al., 1999), uncertainties in the effective temperature scale at the lowest masses and difficulties in estimating stellar luminosities, especially when individual spectra of the two stars are lacking, have made it difficult to compare ages within pairs. In some pairs infrared companions exist that are much more obscured, and therefore possibly significantly younger, than their optically visible primaries. However, extinction does not necessarily correlate inversely with age – highly embedded companions may be obscured only temporarily by an episode of infalling envelope material. Hence, these infrared companions are not necessarily younger simply because they are more reddened (Koresko et al., 1997). Any secondary that is more luminous than its primary must also be younger, because isochrones always slope down and to the right in an HR diagram for pre-main-sequence stars.
Other important issues are whether the masses, spatial extents, lifetimes, and accretion histories of primary circumstellar disks differ from those that surround the secondaries. Recent studies of the frequency of disks in young binaries have concluded that mixed pairs – those where one star is a classical T Tauri star (cTTs; stars with circumstellar disks) and the other a weak-lined T Tauri star (wTTs; stars without detectable disks) – are rare (Prato & Simon, 1997; Duchene et al., 1999). Stars with the highest accretion rates tend to be more massive (i.e., primaries, on average, accrete more rapidly than secondaries do), but there is no obvious correlation between mass accretion rates and separations (White & Ghez, 2001, hereafter WG01).
How disks interact in binary systems when the distance between the stars is smaller than the typical size of a disk, 100 AU, is a topic of much current research. Models of these close binaries typically surround the stars with a circumbinary disk, as has been imaged with adaptive optics and with HST around some systems (Close et al., 1998; Silber et al., 2000). In DQ Tau, it appears that the eccentric orbit of the binary leads to cyclic pulses of accretion from the circumbinary disk onto the stars (Mathieu et al., 1997; Basri et al., 1997). In such systems the less massive star may accrete faster than the more massive star does (Artymowicz & Lubow, 1996), a prediction that can in principle be tested observationally.
To make progress in these areas one must measure the spectral types, accretion rates, luminosities, emission line fluxes, and reddenings of each primary and secondary independently, which requires individual spectra and photometry for each star. The stellar luminosities and effective temperatures, when compared with predictions of published pre-main-sequence evolutionary tracks, provide the masses and ages of each star. If the primaries are, on average, coeval with their secondaries, it should be possible to test the accuracy of the theoretical tracks, which have been undergoing significant revisions as the assumption of grey photospheres has been relaxed (Siess et al., 2000; Baraffe et al., 1998; Palla & Stahler, 1999). It is also possible to test the evolutionary tracks if there is an independent measurement of the stellar masses from orbital motion (Ghez et al., 1995; Steffen et al., 2001) or from Keplerian rotation of the molecular disk (Guilloteau et al., 1999; Simon et al., 2000).
In this study we focus on 20 close pairs where the projected separations are 100 AU. Even in the Taurus-Auriga complex, the closest significant population of cTTs, these size scales are all subarcsecond and most cannot be resolved from the ground. Our spectroscopic study extends the work of WG01, who mainly used photometric HST observations to investigate close binaries. By combining both low-resolution and medium-resolution spectra together we can measure spectral types, reddenings, accretion and emission line properties of each component of each pair accurately. Together with the WG01 photometry, the new spectra give the best overview to date of how young close binary systems interact with their disks.
2 OBSERVATIONS AND DATA REDUCTION
Spectra of 20 close T Tauri binaries were observed using the CCD detector attached to the STIS spectrograph on the Hubble Space Telescope between 26 Nov 1998 and 22 Jan 2001. The medium-resolution spectra taken with the G750M grating with central wavelength 6252Å have a resolution of R 7000, a dispersion of 0.56 Å per pixel, and range from 5950Å – 6550Å. Similarly, the low-resolution spectra that used the G750L grating at central wavelength 7750Å have a resolution of R 900, a dispersion of 4.9Å per pixel, and cover 5270Å – 10260Å. The central wavelengths are optimal for measuring TiO bands in reddened young stars.
Ideally one would align the 52′′ slit of STIS with the stars in each pair, but for many targets this was not possible owing to severe scheduling constraints imposed by the proximity of the targets to the ecliptic. In most cases a 0.2′′ slit was used, but five pairs (DD Tau, FQ Tau, FV Tau, UZ Tau W, and V999 Tau) required the 0.5′′ slit to allow the observations to be done over a larger range of position angles, and for V927 Tau (Lk H 331), the slit was the only one that allowed the observations to be done. The spectral resolution is the same to within measurement error through these three slits.
Reduction of the spectra followed the standard pipeline procedure with several modifications. Sporadic dark counts on the STIS CCD were the dominant source of noise in most spectra. Subtracting a ‘day dark’ improved the situation somewhat, but many hot pixels remained. To clean the data we developed a procedure where statistics measured over a box are compared with the pixel value at the center of the box to determine if the value is erroneously high or low. Real absorption or emission lines will display the PSF of the system in the spatial dimension, while hot pixels will not. Through trial and error and individual inspection of each two-dimensional image one can effectively eliminate all the hot pixels in this manner without affecting any real features. The low-resolution data had to be corrected for fringing using flats taken for this purpose. The correction procedure reduced the amplitude of the fringing across the entire spectrum to less than 5%, a significant improvement over the 30% – 40% amplitudes present in the reddest portion of the spectra before the fringe corrections. Fringing varies spatially over only a few pixels, so it is necessary to correct the secondary separately from the primary. Fringing corrections were negligible for wavelengths 8000Å.
Flux levels of the medium-resolution and low-resolution spectra of the same star taken within the same orbit agree on average within 8% , so the absolute flux calibrations and extractions agree to this level. In all cases the slopes of the medium-resolution and low-resolution spectra are essentially identical. Errors in relative flux calibrations at different wavelengths across a single spectrum are dominated by PSF variations in STIS, especially at the longest wavelengths in the low-resolution spectra, and should be 5% . The effect of the PSF on our medium-resolution spectra is 1% . The PSFs were corrected according to the tables appropriate for the slit used in the observations.
When the pairs are separated by more than about 0.3′′, it is possible to extract each spectrum from the 2D data by simply summing the appropriate rows and applying the appropriate flux correction with wavelength given the extraction aperture (the PSF of STIS develops an extended tail in the near-IR that is corrected in the flux calibration, which depends on the aperture size). However, when the separation is less than 0.3′′ the PSFs of the primary and secondary overlap, and must be deblended. The deblending was done by first extracting the spectrum of primary+secondary with a large aperture, and then determining the ratio of the primary to secondary flux at each wavelength by fitting a gaussian to the location of the primary and secondary, which are known empirically from the acquisition image taken immediately before the spectrum. The result proves to be essentially independent of the choice of the fitting function because the goal is only to determine the ratio of primary to secondary fluxes. By combining the ratio spectrum with the combined spectrum we obtained individual spectra of the primaries and secondaries.
We define the ‘primary’ as the brighter star at 7000Å. In the case of FQ Tau, where the fluxes of the two stars are nearly equal at 7000Å, we take the bluer star, which has an earlier spectral type, to be the primary. With these definitions the secondary can be more luminous overall, especially if it is very red, but the primary always turns out to be the most massive star in the pair for the objects in our sample.
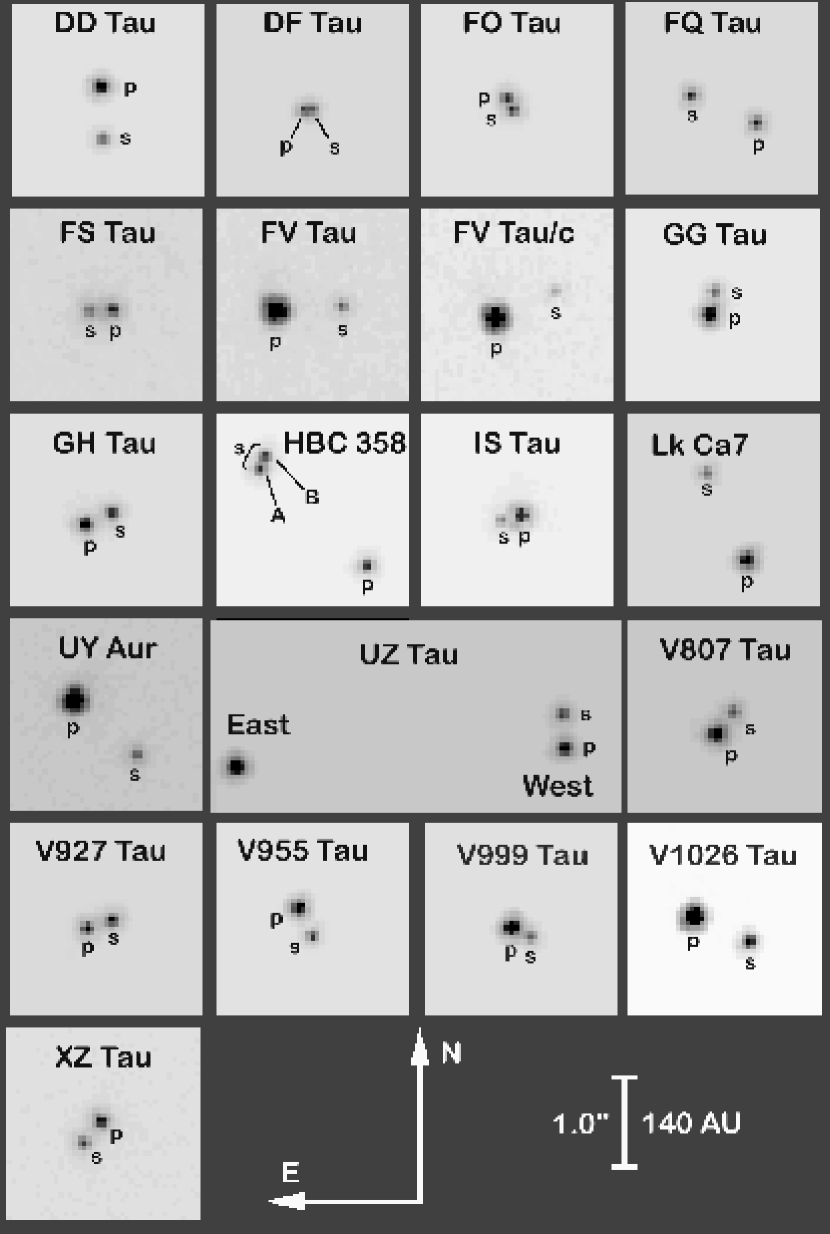
Position angles and separations of the pairs reported in Table 1 were measured from the unfiltered 100x100 CCD acquisition images (Fig. 1) obtained with STIS. Uncertainties in the PA and separation are dominated by centroiding errors, which are typically 0.1 – 0.2 pixels. By comparison, uncertainties in the plate scale of STIS (0.05072 arcseconds per pixel) and orientation of HST are negligible. All of the pairs with separations 0.3′′ (DF Tau, FO Tau, GG Tau, FS Tau, and IS Tau) have position angles that differ by 10 degrees or more from those in the literature, while the discrepancies for more widely separated pairs are all smaller. The PA of a circular orbit at the distance to Taurus with a separation of 0.2 arcsecond and a combined mass of 1 M⊙ varies by 10 degrees in about 4 years. The PA of the closest binary, DF Tau (separation 0.099′′, changed by 30 degrees from the value reported by Ghez et al. (1997) from previous HST images taken in July of 1994.
3 SPECTRAL TYPES, REDDENING, LUMINOSITIES, AND MASS ACCRETION RATES
3.1 Spectral Diagnostics
Deriving the physical properties of the inner disk and stellar photosphere of the T Tauri star requires estimates of the reddening, spectral type, and veiling. Because veiling fills in absorption features and makes the broadband colors of the underlying stellar photosphere more blue, the veiling must be measured before assigning a stellar spectral type and deriving the reddening. To measure veiling, we approximate the underlying stellar spectrum with a ‘template spectrum’ chosen to match the stellar photosphere as closely as possible. We then adopt a spectral shape for the veiling emission (section 3.2) and use a least-squares minimization to solve for the amount of veiling and reddening for that template. We then repeat this procedure for several templates to find the best solution. For the template spectra, we choose weak emission T Tauri stars acquired with the same instrumentation. The best templates are those that leave no residual spectral features when the model (template plus veiling) is subtracted from the object.
To make first estimates for the stellar spectral type and reddening, we measure continuum magnitudes and spectral indices for strong absorption lines. For comparison, we derive continuum magnitudes and absorption indices for nearby stars with known spectral types (Kirkpatrick et al., 1991). Hartigan et al. (1991) describes ground-based spectrophotometry of these stars. Briefly, the data were acquired with the Intensified Reticon Scanner (IRS) and white spectrograph at the No. 2 0.9-m telescope at Kitt Peak National Observatory. The spectra have a resolution of 10 Å and cover 5700–8400 Å. The photometric calibration of these data has an uncertainty of 0.03 mag based on observations of standard stars and repeat observations of program stars.
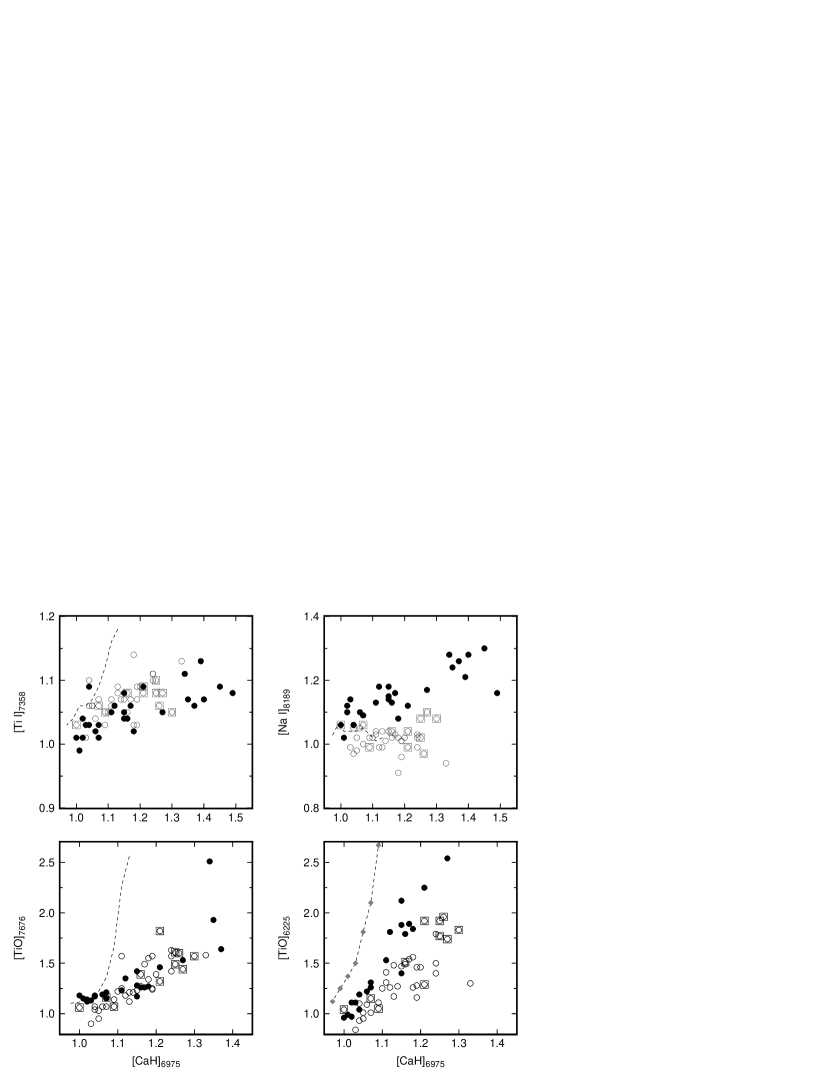
Continuum magnitudes at 5400 Å and at 7035 Å are normalized to the zero-point of the V magnitude scale, = 21.1, where is the average flux in a 30 Å passband centered at wavelength . Absorption indices for CaH 6975, Ti I 7358, the Na I 5890, 5896 doublet, Ca II 8542, and two TiO bands at 6225, 7675 are derived from the STIS spectra using SBANDS within IRAF.
Fig. 2 (see also Kenyon & Hartigan (2001)) shows that the graph of CaH vs. TiO 7675 provides a reasonable first estimate for the spectral types of pre-main sequence stars because the ratio of these indices is insensitive to gravity. The – color then provides an initial estimate for the reddening of each star. For wTTS, the derived from agrees with estimates derived from V–R or J–K to 0.1–0.2 mag. For cTTS, the derived is sensitive to the veiling. We use the veiling model to improve reddening and spectral type estimates as we derive the veiling.
Table 2 compiles the equivalent widths for the brightest emission lines. Uncertainties in the location of the continuum, measured by fitting the continuum at different levels, dominate the errors in the tabulated values for the emission lines.
3.2 Veiling Model
We follow previous studies and assume that the observed spectrum of a TTS, , is the arithmetic sum of a photospheric spectrum and a veiling spectrum ,
| (1) |
where is a constant that represents the ratio of the photospheric flux of the object to that of the template. The photospheric ‘template’ spectrum is the observed spectrum of a wTTS, . We test this assumption by measuring the veiling of a wTTS using another wTTS with the same spectral type as the template. Stars with negligible are reasonable templates.
To solve for the veiling spectrum, we adopt a model for the veiling and use a minimization procedure to match the model to the data. Hartigan et al. (1989) assume a discrete model, where the veiling is a constant in a bandpass of width centered at . They use a least-squares technique to find the best for a set of defined by the discrete orders of an echelle spectrograph; Hartigan et al. (1991) combined the with spectrophotometry to derive the veiling spectrum (see also Basri & Batalha, 1990). Here, we adopt a linear model for moderate resolution STIS spectra,
| (2) |
where is the veiling flux at the reference wavelength and is a constant. This approach avoids choosing bandpasses from a continuous spectrum and provides a good way to measure the variation of veiling with wavelength for low- and medium-resolution spectra like those reported here. In the low resolution spectra, we adopt a quadratic model,
| (3) |
where is another constant.
With these definitions, the veiling (Hartigan et al., 1989) is a simple ratio of the veiling model to the template spectrum,
| (4) |
Averaging this quantity over bandpasses of width yields , the veiling averaged over a bandpass (Hartigan et al., 1989).
We use a downhill simplex method (amoeba algorithm Press et al., 1986) to find the best veiling parameters for each TTS spectrum. The algorithm minimizes the function
| (5) |
where is the number of discrete wavelengths and is an error estimate. The ‘residual spectrum’ is
| (6) |
where uses the best-fit model parameters. To avoid problems with wavelength solutions and flux calibrations at the ends of each spectrum, we clip 10–15 pixels off the end of each spectrum when building the model. To estimate the noise, we add in quadrature the photon noise, the calibration noise, and the ‘shifting noise’ defined below. Given starting values for the unknown parameters, the amoeba algorithm finds the values for , , and which minimize for an input template spectrum and . In our implementation, we make several starting choices to verify the minimum; from several templates, we select the one which minimizes and the slope of the residual spectrum.
To derive error estimates for the model parameters, we use a Monte Carlo technique based on the flux error estimate . For each of to Monte Carlo trials, we add noise to each point of the observed spectrum and repeat the amoeba solution. The noise model is , where is a normally distributed deviate with zero mean and unit variance (Press et al., 1986). The observed flux for these trials is
| (7) |
This procedure yields a range of solutions for , , and ; we adopt the first and third quartiles of this range as the 2 error in the derived parameters.
To minimize the residuals due to emission lines and differences in wavelength solutions between the observed and template spectra, we shift the wavelength scale of the template spectrum. Before running the algorithm, we cross-correlate the observed and template spectrum to derive the wavelength shift. The wavelength shift has an accuracy of 0.1 Å or better for medium resolution spectra and 0.3 Å or better for low resolution spectra. Emission lines and veiling often prevent better measurements of the wavelength shift. We use the polynomial interpolation routine POLINT (Press et al., 1986) to transform the template spectrum to the wavelength scale of the observed spectrum. Tests with different interpolation algorithms verify that a 14th order polynomial provides flux conservation to better than 0.1% over the entire wavelength scale. The shifting noise in the flux is the rms difference between transformed spectra using 12th order and 14th order polynomials. After shifting the template spectrum, the amoeba algorithm derives best model parameters and 1 errors. We then repeat this procedure for different wavelength shifts with a range of 1 Å for medium resolution spectra and 10 Å for low resolution spectra. Repeating the amoeba algorithm and Monte Carlo trials for different wavelength shifts yields a robust minimum in and provides better error estimates in the model parameters.
With low and medium resolution spectra for each pair of TTS, we iterate on the input template and reddening to find the best solution for both spectra. We derive a best reddening by requiring that the residual spectrum for the low resolution data has zero slope over 6000–8500. Template mismatch prevents us from using the full wavelength range of the low resolution data for some TTS, and fringing corrections introduce uncertainties at the longest wavelengths. In some cases, does not provide a good discriminant between templates. In those cases, we choose the best template by minimizing the residuals across prominent absorption features such as TiO. In some cases the spectral type of the object lies between those of two standards; in these cases we choose the standard that produces the best residuals and flattest veiling spectrum to display in Figs. 3 and 4, and average the veiling and reddening results for the object obtained using the two templates for use in the Tables and other Figures.
Tests with different veiling models demonstrate the validity of our veiling model for these data. Constant veiling models for medium resolution data and linear models for low resolution data produce poor results and marginal constraints on the underlying spectral type and the veiling. Higher order polynomials do not improve the per degree of freedom of the fits significantly. Trials with more physical veiling models do not improve the fits or are unsatisfactory. For low resolution data, blackbody models are similar to the polynomial models and often do not provide a useful blackbody temperature. The medium resolution data provide no constraint on the blackbody temperature. Without measurements covering the Balmer jump at 3646 Å, optically thin models or slab models (Hartigan et al., 1991; Valenti et al., 1993; Gullbring et al., 1998) provide fewer constraints than blackbodies. Because these more physical models often fail completely to constrain the veiling, we do not report results for these trials.
Figure 3 shows results for the medium resolution spectra. Each panel of the figure includes the dereddened spectrum (top curve), the spectrum of the normalized template star (middle curve), and the residual spectrum (lower curve). When the residual spectrum is zero at all wavelengths, the veiling spectrum is the difference between the observed spectrum and the normalized template spectrum. In stars with little or no veiling, spectra of the veiling emission and the photosphere nearly coincide. Aside from strong emission lines and occasional absorption features, the residual spectrum is nearly zero for almost all TTS. A few TTS, such as the primary and secondary of DF Tau, display absorption features in the residual spectrum due to template mismatch. Otherwise, the model provides a good fit to spectra of all stars, including strong emission TTS such as the primary of XZ Tau.
Table 3 lists the veiling results for the medium resolution data. We choose = 6100 Å as a convenient continuum band relatively free of strong absorption bands where our spectra have good signal-to-noise. The table includes the template, the veiling at 6100 Å, , defined in equation (4), the dereddened stellar flux at 6100 Å, and the dereddened veiling flux at 6100 Å. The veiling model fails for stars without entries in any column.
Figure 4 and Table 4 describe veiling results for the low resolution spectra. The format of the spectra are the same as in Fig. 3. Most residual spectra are flat over 5700–10000 Å; some TTS have strong emission lines from H, He I, Na I, [S II], and the Ca II near-IR triplet. A few TTS have upturns or downturns near the edges of their spectra. These features are mostly caused by template mismatch (for example, they appear when using an M0 as a template for V999 Tau p, itself an M0.5 template), and by uncertain calibration at long wavelengths. These uncertainties have basically no effect on the reddening, stellar luminosities, or effective temperatures. The veiling parameters in Table 4 include the template, the veiling at 6100 Å and at 8100 Å, and the dereddened stellar flux at 6100 Å.
3.3 Physical Properties of T Tauri Stars
Table 5 lists the derived physical properties of the TTS in our STIS sample. The spectral types and in columns (2) and (3) result from the veiling analysis of the low-resolution spectra. The reddening is the best derived from the veiling model for these spectra. The formal error in is 0.2 – 0.3 mag for most stars. The spectral type is derived from the spectral types of the templates for the low resolution and the medium resolution veiling analysis. Errors are 0.5 subclass for most stars; the error is 1 subclass for XZ Tau p. The scale of the spectral types is based on CaH spectral types for nearby stars observed with the IRS (Kenyon & Hartigan, 2001). Kirkpatrick et al. (1991) use CaH to place these stars on the standard Boeshaar scale. The other parameters in this table are the stellar luminosity , the accretion luminosity , the stellar mass , the stellar age , the stellar radius , the accretion rate of the disk onto the star, the infrared excess and a quantity log LSEC that measures how close the primary and secondary are to being the same age. The following paragraphs describe our derivation of these parameters from our spectra and the veiling analysis.
Luminosity estimates are based on the Kenyon & Hartmann (1995, KH95 hereafter) photometric compilation. For each component of a close pair, our veiling analysis yields the R-band magnitude for the stellar photosphere and the veiling source. These magnitudes represent the fraction of light passing through the STIS slit. To correct for any slit losses, we assume that the total light from the pair equals the average R-band flux in KH95. We then apportion the total R-band flux to each stellar component and each veiling component of the pair. For an adopted distance of 140 pc for the Taurus-Auriga complex (Kenyon et al., 1994), the stellar luminosity of each component follows from a bolometric correction listed in KH95 derived for the stellar spectral type listed in Table 5.
Estimates for the accretion luminosity rely on a bolometric correction to convert the total flux in an observed bandpass to the total flux in the entire spectrum. Because detailed physical models for the veiling source are not available, a robust estimate for the bolometric correction is not possible. We follow Hartigan et al. (1991), Valenti et al. (1993), Gullbring et al. (1998), and others and adopt a simple slab model for the veiling emission. The model specifies the veiling radiation by the temperature, the density, and the optical depth at a fixed wavelength (Kenyon & Hartmann, 1987; Hartigan et al., 1991). This model accounts for many observed features of the veiling emission with a minimum of free parameters (e.g. Kenyon et al., 1994b; Valenti et al., 1993).
Gullbring et al. (1998) derive bolometric corrections for a range of slab models. Their Fig. 9 shows that the ratio of the total flux to the flux in a 3200–5300 Å bandpass is 3–5 for temperatures 6000 K to 20000 K and optical depths = 1–10 at a density cm-3. They adopt a bolometric correction of 3.5 to convert their veiling observations to accretion luminosity. Using the slab model described in Hartigan et al. (1991), we confirm the Gullbring et al. (1998) result for a modest range in hydrogen density, log = 13.5–14.5. For our 6000–6500 Å medium resolution passband, the typical bolometric correction is 35. Because the veiling model works well in the 6000–6500 Å region, we adopt this bandpass instead of the broader low resolution bandpass. For d = 140 pc, the accretion luminosity is then
| (8) |
where is the flux from the veiling model integrated over the medium resolution bandpass.
We follow WG01 (their Table 5) to convert the observed spectral types into stellar effective temperatures. The effective temperature and stellar luminosity give the stellar radius, and the stellar luminosity and effective temperature place the star in the HR diagram, where masses and ages result from pre-main-sequence evolutionary tracks.
The accretion rates for TTS depend on the accretion geometry. We adopt a magnetosphere model, where the stellar magnetic field truncates the disk a few stellar radii above the photosphere. The central star corotates with the inner disk; disk material then flows toward the star along magnetic field lines (Königl, 1991; Ghosh & Lamb, 1979a, 1979b). Bright spots form where the accretion streams impact the star; these spots rotate with the stellar photosphere. This geometry provides a natural explanation for the spectral energy distributions, optical photometric variations, and emission line profiles in many cTTS (Bertout et al., 1988; Edwards et al., 1994; Kenyon et al., 1996).
The total infall energy per second from a magnetosphere model is
| (9) |
where is the gravitational constant, is the accretion rate, and is the inner radius of the disk. We adopt = 3 (Kenyon et al., 1996) and solve for the accretion rate:
| (10) |
Gullbring et al. (1998) derive a similar expression for the accretion rate, though they assume that all of the accretion energy is radiated in the 2 steradians away from the star; that is, Linfall = Lacc, where Lacc is the radiated luminosity from the hot spots. Depending on the optical depth and altitude of the bright spot above the photosphere, some of the accretion energy radiated toward the star will heat the stellar photosphere and some may help to drive an outflow. Here we assume that 50% of the accretion energy is radiated away from the star (Linfall = 2Lacc). The accretion rate is then
| (11) |
Infrared excesses for each star use the K and L colors compiled by WG01. Because we have measured both the reddening and spectral type of each star from its spectrum, we can correct the observed color for reddening and subtract the photospheric colors to obtain a true infrared KL color excess. Finally, the amount that the secondary must move in log L⋆ in the HR diagrams of Siess et al. (2000) to make it the same age as the primary appears in the last column of Table 5. Negative values imply that the secondary is younger than the primary, and vice-versa for positive values.
4 Disk and Accretion Properties of Close Binaries
The main goal of this project is to determine how disk accretion behaves in close binary systems. Our data are well-suited to compare primary disks with those of their secondaries, because we have spectra of each component and can therefore estimate the reddening, veiling, luminosities, masses, ages, mass accretion rates throughout the sample. In many cases infrared colors of each component also exist in the literature. However, our sample is not large enough to compare global star formation questions such as how quickly disks evolve with age. Our sample deliberately avoids single stars, and so is not representative of the stellar population as a whole. For these reasons, in this paper we compare disk properties within each pair to try to gain some understanding about accretion in binaries.
4.1 Mixed Pairs
One of the most basic questions about young binaries is whether or not a disk exists around one or both of the stars. Although most binaries consist of two cTTs or two wTTs, about 15% of young binaries are ‘mixed pairs’ that have a cTTs and a wTTs (Prato & Simon, 1997; Duchene et al., 1999; White & Ghez, 2001). The new HST spectra allow us to investigate this frequency among the closest pairs by checking for disks around each star through veiling, [O I] emission, and strong H emission. The spectra also reveal the reddening and spectral types of each star individually, which we can combine with existing photometry to detect even weak infrared excesses. Together, these four disk signatures provide a thorough means to look for disks in the sample. Because the medium-resolution spectra do not cover H, we cannot use the width of the H line to distinguish between cTTs and wTTs (e.g. Batalha et al., 1996).
Classification results appear in Table 7. In the Table, an ‘X’ means that the star has the disk signature, and a ‘’ means that it does not. We use the following H equivalent width criteria to determine if a star is a cTTs – EW(H) 5Å for K stars, 10Å for M0 – M2, and 25Å for M2. With the exception of coolest stars, where we have increased the EW from 20Å to 25Å to promote better consistency with the rest of our data, these criteria are the same as those used by Martin (1998). Stars are marked as cTTs if the veiling or [O I] emission is 2. For IR excesses, we use the KL color of WG01, and subtract the reddened KL photospheric color appropriate for the spectral type and reddening of each star (Table 5). If the resulting KL 0.20 magnitude, the object is a cTTs. Of the 41 stars in Table 7, 28 (68% of the sample) have consistent classifications across all four disk signatures.
Stars where one of the disk indicators disagrees with the other three provide useful insights into the strengths and weaknesses of each of the criteria. Nine stars (22% of the sample) fall into this category. The least reliable indicator seems to be [O I], which gives a false negative (i.e., no [O I] but all other disk signatures are present) in 4 cases. The lack of [O I] for these cTTs may simply be signal to noise – it is usually much easier to see the [O I] in the medium resolution spectrum than in the low resolution one because [O I] stands out more from the continuum in the medium resolution spectrum. The M2.0 star V807 Tau s, gives a false positive; it has strong [O I] but no other disk signatures. We have no explanation for this anomaly. Similarly, the secondary of IS Tau, an M3.5, has weak [O I] but lacks other indications of a disk (the EW(H) of 24Å falls just below our cutoff for a cTTs).
The H, veiling, and IR-excess tests are each fairly reliable, but none are foolproof. For example, the H test gives a false negative for the secondary of V955 Tau (6Å, M2.5), which is a cTTs according to the [O I] emission and IR excess. Had we used the H cTTs criteria of Martin (1998) there would be three false positives, but we have avoided these by increasing the EW(H) cutoff for cTTs to 25Å from 20Å for the latest spectral types. Veiling works about as well as H, giving false positives for the secondaries of V927 Tau (r=0.090.03) and V999 Tau (r=0.290.05). The photosphere of the latter is apparently anomalous. In general, veiling is easier to measure in later-type stars than in earlier-types because the temperature differences between the accretion spots and the photospheres are higher when the photospheres are cool. Finally, KL fails only in the primary of FQ Tau (M3.0), which shows no IR excess despite having relatively strong veiling and [O I] emission, as well as an H equivalent width of over 100Å. Unlike veiling, IR excesses are less sensitive to the presence of a disk when the photosphere is very red, so it is not too surprising that very red cTTs sometimes lack excesses (see also the secondary of FO Tau below).
Four stars (10% of the sample) in Table 7 show two cTTs indicators and two wTTs indicators. The primary of V807 Tau is a K5 star with a large IR excess and an H equivalent width of 7Å, so we classify this as a cTTs. The lack of veiling is not particularly worrisome because the photosphere is relatively blue, and there are at least four other cTTs without [O I] (see above). The primary of V955 Tau is another relatively blue star (K7) that has no detectable veiling or [O I], but satisfies the cTTs classification with 11Å H equivalent width and a large KL excess; we also classify this star as cTTs. As described above, its secondary has strong [O I] and a moderate infrared excess but lacks veiling and has weak H. We classify this borderline case as a cTTs. Finally, the secondary of FO Tau must also be a cTTs; this M3.5 star has an H equivalent width of 95Å and a significant amount of veiling. We attribute the lack of IR excess to its cool photosphere, and the lack of [O I] simply brings the total number of cTTs in that category up to seven.
With these classifications, we have 12 cTTs pairs, 5 wTTs pairs, and 4 mixed pairs. The mixed pairs are FQ Tau, FV Tau/c, IS Tau, and V807 Tau; the cTTs is the primary except in FV Tau/c. However, FV Tau/c is not anomalous, as other examples of mixed pairs where the cTTs is the secondary exist in the literature (Jayawardhana & Brandeker, 2001).
This frequency of mixed pairs among the close binaries is essentially identical to that found for wider binaries with larger samples (Duchene et al., 1999, WG01).
4.2 Mass Accretion Rates, Emission Lines, and IR Excesses
Figure 5 shows the mass accretion rates of all pairs that have at least one veiled component. Ignoring the FV/FVc point, which plots the widely separated primaries of these close binaries, the mass accretion rates of the primaries are correlated with those of their secondaries. Hence, the disks around the closely separated systems that comprise our sample are not independent of one another. The significance of this correlation is very high – a Spearman rank of 0.816 for 15 points occurs with a probablility of less than in uncorrelated data. Surprisingly, though the mass accretion rates of the primaries exceed those of the secondaries in several cases, most of the sample points lie close to the line of equal mass accretion rates. In fact, when considered per unit mass (bottom panel in Fig. 5), secondaries appear somewhat more active than primaries do, on average.
The H luminosity of all pairs in the sample (Fig. 6, top panel) also shows that activity levels of the primaries and secondaries are correlated. Considering the sample as a whole is not particularly useful however, because the paucity of mixed pairs implies a dearth of points in the lower right and upper left portions of the graph, and this fact alone produces a correlation between the two variables. A more interesting test is to compare the correlation among the cTTs pairs (solid squares in the figure). A correlation does exist among cTTs, although there are only 12 points in this subsample. The H correlation exists at a 99% confidence level according to a Spearman rank test. Most pairs lie to the right of the line in the top panel of Fig. 6; primaries have larger intrinsic H luminosities than secondaries do in the majority of pairs.
When the H luminosities are normalized by the stellar luminosities, the correlation among the cTTs subsample vanishes, although it remains for the entire sample. Hence, the correlation in H among the cTTs in Fig. 6 results from a correlation in stellar luminosities, which in turn arises because primaries and secondaries tend to be coeval (see section 5).
Our data are particularly well-suited to examine infrared excesses from colors because the extinction and the spectral types, both of which affect colors, are known for all the stars. The KL excesses in the bottom half of Fig. 6 also correlate for the primaries and secondaries, but, as for the H luminosities, this correlation is more interesting for the cTTs subsample. A weak correlation between the KL excesses of the primaries and their secondaries, but this correlation rests entirely upon two points, XZ Tau and FS Tau. The correlation exists at the 98% confidence level, but without XZ Tau and FS Tau the confidence drops to 80%. KL excesses arise in part from accretion in the disk, and correlate with veiling (Hartigan et al., 1990); hence, a correlation of KL colors within a pair is likely to arise from the accretion rate correlations between primaries and their secondaries.
4.3 Extinction
Extinctions of primaries and their secondaries correlate (Fig. 7), as expected for stars that lie along a nearly common sight line through a dark cloud. The correlation in extinctions is very strong, with a confidence level of 99.99%. However, in six pairs (GH Tau, UZ Tau-W, UY Aur, DD Tau, V999 Tau, and FV Tau/c), the reddening of the secondary is significantly larger than that of the primary. Only one of these, V999 Tau, is a wTTs pair; FV Tau/c has a wTTs primary and cTTs secondary, while the components of the other four pairs are all cTTs. As noted above, the photosphere of V999 Tau s appears anomalous, so it is possible that the extinction may be more uncertain there. Ignoring the FV/FVc point, which refers to the primaries of the FV Tau and FV Tau/c systems and as such is a wide binary, there are only a couple of marginal cases of a primary that appears more reddened than its secondary.
The tendency of some secondaries to have more extinction than their primaries has a fairly simple geometric interpretation for close binaries if the orbital plane of the binary differs from that of the disk around the primary. In such systems the secondary will be seen through the disk of the primary over part of its orbit. If disks around primaries are, on average, more massive than those around secondaries, then secondaries seen through the disks of their primaries will experience a significant amount of additional extinction that would be less noticeable for a primary seen through the disk of its secondary. Because FV Tau/c is a mixed pair with a wTTs primary, additional local extinction around the secondary must either arise from the disk of the secondary or from an extended envelope around the primary that lacks an inner disk. More close pairs are needed to test if this trend of more highly reddened secondaries is real.
5 Ages, Masses, and Pre-Main-Sequence Tracks
The binaries in our sample are plotted in an HR diagram together with the pre-main-sequence evolutionary tracks of Baraffe et al. (1998), Siess et al. (2000), and Palla & Stahler (1999) in Figs. 8, 9, and 10, respectively. Although most of the secondaries are less luminous than their primaries, two pairs (XZ Tau and FS Tau) have more luminous secondaries which must be significantly younger than their primaries. The secondary of XZ Tau dominates the mid-IR emission from the pair (Krist et al., 1997), and both XZ Tau and FS Tau are surrounded by reflection nebulae. It is possible that the reflected light increases the apparent luminosities of the secondaries, thereby decreasing their ages. The reflection nebulae indicate that the environments of these binaries are very dusty, so it is conceivable that large grains in the immediate vicinity of the primary produce a more grey reddening law, which would increase the extinction and make the primary appear erroneously old. For this effect to equalize ages it would have to act in the primary but not the secondary. There is no direct evidence to support this scenario. Uncertainties of the stellar luminosities are dominated by systematic errors, and are about 0.2 in log L.
As Fig. 11 shows, there is no clear correlation between the amplitude of log LSEC, the amount in log L that the secondary must shift to be coeval with the primary, and the mass ratio. Secondaries tend to be younger than primaries for both the Siess00 and Palla00 tracks (the BCAH98 tracks in Fig. 8 cannot be used because they do not extend to high enough masses or young enough ages). In pairs such as DD Tau where the primary and secondary have the same spectral type, and the tracks are nearly vertical in the HR diagram, the primary and secondary will have the same mass but the primary will always appear younger because by our definition the star we call the primary is the more luminous one at 7000Å. Hence, any statistics about age differences between primaries and secondaries must eliminate these systems. Ignoring such pairs, and leaving out the wide binary FV/FVc, the Palla00 tracks have 13 pairs where the secondary is younger and only 3 where it is older. The corresponding numbers for the Siess00 tracks are 12 and 4, respectively. This trend for the secondaries to be younger is unlikely to be caused by random errors. The chance that at least 13 out of 16 pairs in a coeval sample have the secondary younger owing to random errors is only 1.1% ; the chance for at least 12 out of 16 pairs is 3.8%.
WG01 noted that the age differences between components within a binary were significantly less than those obtained by randomly pairing stars within their sample. This correlation between the ages of primaries and secondaries is quite clear in Fig. 12, and exists at the level for the Palla00 tracks and at the level for the Siess00 tracks (Fig. 12 shows only the Siess00 tracks, because these are the only ones with young enough isochrones for our sample). The points in Fig. 11 also show the age correlation indirectly – the standard deviation of log LSEC is 0.28 for both sets of tracks, but should be 0.51 if the stars in the sample were paired randomly.
If, on average, secondaries formed some time after their primaries (for example from instabilities in the primary’s disk (Shu et al., 1990)), then the age differences should be largest on a log plot for the youngest pairs because the fractional age difference declines as the pair ages. Fig. 12 does not show this trend – the two oldest primaries have the largest age differences from their secondaries.
One possible explanation for the younger ages of secondaries may be disk accretion (Hartmann et al., 1997). If a 0.1 M⊙ star were to accrete an additional 0.1 M⊙ on a timescale short compared to the age of the star, the new 0.2 M⊙ star is in some sense half as old as it once was. For this case of a mass-weighted age, the effect of accretion on age should depend upon /M (bottom panel of Fig. 5), where secondaries appear somewhat more active than primaries, on average. However, the difference between primaries and secondaries in Fig. 5 is less than a factor of two, and the effects of accretion on the location of a star in the HR diagram is a complex problem (e.g. Tout et al., 1999). There is no evidence that the secondaries continue to accrete matter after the primary has stopped accreting – if this were the case then most of the mixed pairs should have a cTTs secondary and a wTTs primary, which they do not. Although no set of pre-main sequence tracks can make all the pairs coeval, the points in Fig. 12 would fall more closely on the line of equal ages if the isochrones were a little less steep in the HR diagram. Such behavior is indeed predicted by some of the accretion models of Tout et al. (1999). With the exception of the primary of FS Tau and possibly the primary of V955 Tau, all of the stars lie on the convective portion of the tracks.
One advantage of studying close binaries is that they are sometimes surrounded by rotating molecular disks in Keplerian orbits, so the combined mass of the system can be estimated independently from the evolutionary tracks. The closest pairs also show substantial orbital motion over a few years, which leads to a mass estimate for the binary. Dynamical masses from disk orbital motion have now been measured accurately around a few T Tauri stars (Duvert et al., 1998; Simon et al., 2000; Guilloteau et al., 1999). The best example is probably GG Tau, which has a dynamical mass of 1.28 0.07 M⊙, somewhat larger than the 0.98 M⊙ derived from the the location of the primary and secondary in the HR diagram using either the Siess et al. (2000) tracks or the Palla & Stahler (1999) tracks. If we take these numbers at face value, then an additional mass of 0.30 M⊙ must be in the system but not in the stars. This extra mass is about 30% of the stellar masses, and seems large for disks, especially in a relatively unobscured system like GG Tau. A circumbinary disk also exists around UY Aur with a dynamical mass of 1.2 M⊙ (Duvert et al., 1998); the combined mass of the system using the Siess00 tracks is 0.94 M⊙. Following the assumptions described in the Notes for FS Tau leads to 1.2 M⊙ in that system, again larger than the combined mass of 0.89 M⊙ in Table 5.
Dynamical masses of T Tauri systems continue to improve as better orbits are measured for close binaries. The current data imply that discrepancies between the dynamical masses and stellar masses are significant. Either the dynamical masses are too large, or the stellar masses too small; the latter could indicate a problem with the evolutionary tracks or the effective temperature scales, while errors in dynamical masses could easily arise from uncertain distances. For example, a 10% decrease in the distance to Taurus (to 126 pc) would decrease dynamical masses by 30% , but would have little effect on the spectral masses because the pre-main-sequence tracks are nearly vertical in the HR diagram for low mass stars, and changing the distance affects the luminosity but not the effective temperature of the star.
6 Summary
This paper reports the results of a spectroscopic survey of 20 close (subarcsecond) binary T Tauri stars in the Taurus-Auriga dark cloud done with STIS on the Hubble Space Telescope. By obtaining spectra of each component it is possible to determine the reddening, spectral types, and stellar luminosities of the primaries and secondaries in all the pairs. This information suffices to place each star in the HR diagram, which determines its mass and age. When combined with disk characteristics such as mass accretion rates measured from veiling emission, and including emission line luminosities and infrared color excesses, it is possible to address many of the outstanding questions regarding binary formation in systems where the stellar separations are less than the extent of the circumstellar disks. Such systems are not only interesting from the standpoint of accretion dynamics, but also make up the most common mode of star formation in our galaxy.
Components of close binaries share common characteristics in a number of ways. Correlations in mass accretion rates particularly stand out – the best place to look for a rapidly accreting secondary is next to a rapidly accreting primary. The actual values of the accretion rates are remarkably similar between primaries and secondaries. Because secondaries are less luminous than their primaries in most cases, it is often easier to see accretion signatures such as emission lines and veiling around secondaries than it is around primaries. On average, secondaries actually accrete more per unit mass than their primaries do. Other accretion signatures such as H emission and color excesses also correlate within pairs, probably as a result of the correlation of these quantities with mass accretion rates. Extinctions of primaries correlate well with those of their secondaries, as expected.
We have examined four independent signatures of disks: H emission, KL color excesses, veiling and [O I] in each of our objects, and have devised rules each of these signatures must satisfy to classify a star as a cTTs. Most stars are clearly a cTTs or a wTTs, but several have at least one misleading indicator, most often [O I] although each of the four signatures is inaccurate in at least one case. Overall, the frequency of mixed pairs, where one star is a cTTs and one a wTTs, comprise about the same fraction among close pairs as they do among wider pairs.
Several subtle trends have emerged from the data set. When extinctions differ within a pair it is usually the secondary that is more heavily obscured. One can explain this result geometrically by having a larger, more opaque disk around the primary than exists around the secondary. Ages of primaries and secondaries also clearly correlate, and are equal to within the errors in most cases. However, there is a clear tendency for secondaries to be a bit younger than their primaries. Slightly flatter isochrones in the pre-main-sequence tracks, perhaps caused by ongoing accretion, would remove this bias. However, pairs such as FS Tau and XZ Tau have more luminous secondaries that will be very difficult to make coeval with their primaries for any set of tracks.
Masses of the pairs inferred from their locations in the HR diagram are 30% less than those measured from rotating Keplerian disks or from the orbital motion within the binary. These discrepancies are most easily removed by reducing the distance to Taurus by about 10% to 126 pc, but can also be accomplished in other ways, such as altering the effective temperature scale for cool photospheres or by generating a substantially different set of pre-main-sequence tracks.
References
- Artymowicz & Lubow (1996) Artymowicz, P. & Lubow, S. 1996, ApJ 467, L77.
- Baraffe et al. (1998) Baraffe, I., Chabrier, G., Allard, F., & Hauschildt, P. 1998, A&A 337, 403.
- Basri & Batalha (1990) Basri, G., & Batalha, C. 1990, ApJ, 363, 654.
- Basri et al. (1997) Basri, G., Johns-Krull, C., & Mathieu, R. 1997, AJ 114, 781.
- Batalha et al. (1996) Batalha, C., Stout-Batalha, N., Basri, G., & Terra, M. 1996, ApJS 103, 211.
- Bertout et al. (1988) Bertout, C., Basri, G., & Bouvier, J. 1988, ApJ, 330, 350.
- Brandner & Zinnecker (1997) Brandner, W., & Zinnecker, H. 1997, A&A 321, 220.
- Cardelli et al. (1989) Cardelli, J., Clayton, G., & Mathis, J. 1989, ApJ 345, 245.
- Close et al. (1998) Close, L., Roddier, F., Northcott, M., Roddier, C. & Graves, J. 1998, ApJ 478, 766.
- Duchene et al. (1999) Duchene, G., Monin, J.-L., Bouvier, J., & Menard, F. 1997, A&A 351, 954.
- Duvert et al. (1998) Duvert, G., Dutrey, A., Guilloteau, S., Menard, F., Schuster, K., Prato, L., & Simon, M. 1998, A&A 332, 867.
- Edwards et al. (1994) Edwards, S., Hartigan, P., Ghandour, L., & Andrulis, C. 1994, AJ 108, 1056.
- Ghez et al. (1993) Ghez, A., Neugebauer, G., & Matthews, K. 1993, AJ 106, 2005.
- Ghez et al. (1995) Ghez, A., Weinberger, A., Neugebauer, G., Matthews, K., & McCarthy, D. 1995, AJ 110, 753.
- Ghez et al. (1997) Ghez, A., White, R., & Simon, M. 1997, ApJ 490, 353.
- Ghosh & Lamb (1979a) Ghosh, P., & Lamb, F. K. 1979a, ApJ, 232, 259.
- Ghosh & Lamb (1979b) Ghosh, P., & Lamb, F. K. 1979b, ApJ, 234, 296.
- Guilloteau et al. (1999) Guilloteau, S., Dutrey, A., & Simon, M. 1999, A&A 348, 570.
- Gullbring et al. (1998) Gullbring, E., Hartmann, L., Briceno, C. & Calvet, N. 1998, ApJ 492, 323.
- Haisch et al. (2001) Haisch, K., Lada, E.& Lada, C. 2001, ApJ 553, L153.
- Hamann & Persson (1992) Hamann, F., & Persson, S. 1992, ApJS 82, 247.
- Hartigan et al. (1989) Hartigan, P., Hartmann, L., Kenyon, S. J., Hewett, R., & Stauffer, J. 1989, ApJS, 70, 899.
- Hartigan et al. (1990) Hartigan, P., Hartmann, L., Kenyon, S., Strom, S.& Skrutskie, M. 1990, ApJ 354, L25.
- Hartigan et al. (1991) Hartigan, P., Kenyon, S. J., Hartmann, L., Strom, S. E., Edwards, S., Welty, A. D., & Stauffer, J. 1991, ApJ, 382, 617.
- Hartigan et al. (1994) Hartigan, P., Strom, S. & Strom, K. 1994, ApJ 427, 961.
- Hartigan et al. (1995) Hartigan, P., Edwards, S. & Ghandour, L. 1995, ApJ 452, 736.
- Hartmann et al. (1997) Hartmann, L., Cassen, P. & Kenyon, S. 1997, ApJ 475, 770.
- Herbst et al. (1995) Herbst, T. M., Koresko, C. D., & Leinert, C. 1995, ApJ 444, L93.
- Jayawardhana & Brandeker (2001) Jayawardhana, R., & Brandeker, A. 2001, ApJ 561, L111.
- Joy & van Biesbrock (1944) Joy, A. H., & van Biesbrock, G. 1944, PASP 56, 119.
- Kenyon et al. (1994) Kenyon, S. J., Dobrzycka, M., & Hartmann, L. 1994a, AJ, 108, 1872.
- Kenyon & Hartigan (2001) Kenyon, S. J., & Hartigan, P. 2001, in The Formation of Binary Stars, IAU Symposium No. 200, eds. H. Zinnecker & R. D. Mathieu, San Francisco, ASP Press, p. 323.
- Kenyon & Hartmann (1987) Kenyon, S. J., & Hartmann, L. 1987, ApJ, 323, 714.
- Kenyon & Hartmann (1995) Kenyon, S., & Hartmann, L. 1995, ApJS 101, 117 (KH95).
- Kenyon et al. (1994b) Kenyon, S. J., Hartmann, L., Hewett, R., Carrasco, L., Cruz-Gonzalez, I., Recillas, E., Salas, L., Strom, K. M., Strom, S. E., & Newton, G. 1994, AJ, 107, 2153.
- Kenyon & Fernández-Castro (1987) Kenyon, S. J., & Fernández-Castro, T. 1987, ApJ, 316, 427.
- Kenyon et al. (1996) Kenyon, S. J., Yi, I., & Hartmann, L. 1996, ApJ, 462, 439.
- Kirkpatrick et al. (1991) Kirkpatrick, J. D., Henry, T. J., & McCarthy Jr., D. W. 1991, ApJS, 77, 417.
- Königl (1991) Königl, A. 1991, ApJL, 370, L39.
- Krist et al. (1997) Krist, J. et al. 1997, ApJ 481, 447.
- Krist et al. (1998) Krist, J. et al. 1998, ApJ 501, 841.
- Koresko et al. (1997) Koresko, C., Herbst, T., & Leinert, Ch. 1997, ApJ 480, 741.
- Leinert et al. (1993) Leinert, Ch., Zinnecker, H., Weitzel, N., Christou, J., Ridgway, S., Jameson, R., Haas, M., & Lenzen, R. 1993, A&A 278, 129.
- Mathieu et al. (1996) Mathieu, R., Martin, E., & Maguzzu, A. 1996, BAAS 28R, 920.
- Mathieu et al. (1997) Mathieu, R., Stassun, K., Basri, G., Jensen, E., Johns-Krull, C., Valenti, J., & Hartmann, L. 1997, AJ 113, 1841.
- Martin (1998) Martin, E. 1998, AJ 115, 351.
- Mathis (1990) Mathis, J. 1990, ARA&A 28, 37.
- McCaughrean & O’Dell (1996) McCaughrean, M., & O’Dell, C. R. 1996, AJ 111, 1977.
- Muzerolle et al. (1998) Muzerolle, J., Hartmann, L., & Calvet, N. 1998, AJ, 116, 455.
- Padgett et al. (1999) Padgett, D., Brandner, W., Stapelfeldt, K., Strom, S., Terebey, S., & Koerner, D. 1999, AJ 117, 1490.
- Palla & Stahler (1999) Palla, F., & Stahler, S. 1999, ApJ 525, 772.
- Prato & Simon (1997) Prato, L., & Simon, M. 1997, ApJ 474, 455.
- Press et al. (1986) Press, W. H., Flannery, B. P., Teukolsky, S. A., & Vetterling, W. T. 1986, Numerical Recipes, The Art of Scientific Computing, Cambridge, Cambridge.
- Shu et al. (2000) Shu, F., Najita, J., Shang, H., & Li, Z.-Y. 2000, Protostars and Planets IV, V. Mannings, A. Boss & S. Russell eds., Tucson: U of Arizona Press, 789
- Shu et al. (1990) Shu, F., Tremaine, S., Adams, F., & Ruden, S. 1990, ApJ 358, 495.
- Siess et al. (2000) Siess, L., Dufour, E., & Forestini, M. 2000, A&A 358, 593.
- Silber et al. (2000) Silber, J., Gledhill, T., Duchene, G., & Menard, F. 2000, ApJ 536, L89.
- Simon et al. (1999) Simon, M., Beck, T., Greene, T., Howell, R., Lumsden, S. & Prato, L. 1999, AJ 117, 1594.
- Simon et al. (2000) Simon, M., Dutrey, A., and Guilloteau, S. 2000, ApJ 545, 1034.
- Steffen et al. (2001) Steffen, A. et al. 2001, AJ 122, 997.
- Tout et al. (1999) Tout, C., Livio, M., & Bonnell, I. 1999, MNRAS 310, 360.
- Valenti et al. (1993) Valenti, J. A., Basri, G., & Johns, C. M. 1993, AJ, 106, 2024.
- White et al. (1999) White, R. J., Ghez, A. M., Reid, I. N., & Schultz, G. 1999, ApJ 520, 811.
- White & Ghez (2001) White, R. J. & Ghez, A. M. 2001, ApJ 556, 265 (WG01).
- Woitas et al. (2002) Woitas, J., Eislöffel, J., Mundt, R., & Ray, T. 2002, ApJ 564, 834.
Notes on Individual Pairs
DD Tau – The primary and secondary are a little later than the template, LkCa 7 s, at Å. The veiling on the medium resolution spectrum of DD Tau p is somewhat larger than that of the low resolution spectrum. Both spectra for DD Tau s yield the same veiling. The reddening difference between the primary and secondary is significant. The Ca II lines in the primary and the [O I] lines in the secondary are particularly strong. The secondary is the only star in our sample with detectable [O I]5577 emission.
DF Tau – Residuals for the medium resolution spectra of both stars show a small wave, possibly resulting from a template mismatch. The best template is V807 Tau s, which gives good residuals in the the low resolution spectra. The primary has strong Paschen lines that underlie the Ca II IR triplet. The reddening is essentially the same for the two stars.
FO Tau – Residuals for the medium resolution spectra of both stars show a low-amplitude wave, like those of DF Tau only weaker. Residuals in the low resolution spectra are flat out to 9000 Å. LkCa 7 s is the best template for both primary and secondary. FO Tau p has Paschen lines in emission. Although the secondary has no [O I] emission or IR excess, its H equivalent width is 95Å, which clearly marks it as a cTTs.
FQ Tau (Haro 6-3) – The low- and medium-resolution spectra of both stars yield flat residuals and consistent veiling results where they overlap in wavelength. The secondary has an H equivalent width of 23Å, but this star is an M3.5 and has no other accretion signatures so we classify it as a wTTs. The secondary is brighter than the primary longward of about 7000Å. FQ Tau p has strong H, He I, and Ca II triplet lines, and is veiled, but has no IR excess.
FS Tau (Haro 6-5A) – Forbidden lines are strong in this pair, which is surrounded by a reflection nebula Krist et al. (1998). The red doublet line of [S II] 6720 has an equivalent width of 4.9 0.4 Å in the primary. H and [O I] emission fill the space between the pair in the longslit data, and extend brightly along the slit for an additional 0.3 arcseconds past the primary and some 0.2 arcseconds beyond the secondary. The [S II] emission is also extended, and H continues weakly out to 1.7 arcseconds away from the primary. A second system, FS Tau B located some 20′′ west of FS Tau, also drives a highly collimated jet (Woitas et al., 2002). The primary is too faint in the medium resolution spectrum to derive a reliable veiling, but the low resolution spectrum yields a good veiling measurement that is relatively insensitive to the reddening. The medium resolution spectrum of FS Tau s has low S/N, but yields the same veiling as the low resolution spectrum of this star, which is very red. Binning the medium resolution spectrum to increase the S/N yields a similar result. The PA of the system has increased by 10 degrees from that measured by Krist et al. (1998) from HST images taken about 5 years earlier. If the orbit is circular and viewed pole-on, the period of 180 years implies a mass of 1.20 M⊙ for d = 140 pc.
FV Tau (Haro 6-8) – Despite a large reddening, spectra of the primary yield good veiling measurements. The secondary is a continuum T Tauri star that shows no photospheric features and has strong H and Ca II triplet emission. The KL value in Table 5 assumes an intrinsic KL = 0.16, corresponding to an M2.0 star, and the same reddening as the primary. Regardless of the spectral type and reddening assumed, the star is clearly a cTTs. We obtain an approximate mass accretion rate by taking the star to lie in the middle of the sample of stars we observed, with mass 0.40 M⊙ and radius 1.5 R⊙.
FV Tau/c – The primary star has no veiling on either spectrum. The secondary is very red and has very little flux 7000Å, so the reddening is difficult to measure, though is definitely greater than that of the primary. The values for this star in Table 5 come from considering a range of AV, and choosing the value that makes the veiling reasonably flat. Visual extinctions less than 5.5 or greater than 8 lead to non-physical veiling solutions. The medium resolution spectrum for FV Tau/c s is too noisy to derive a reliable veiling measurement. The extremely large H and [O I] 6300 equivalent widths are caused by the very weak continuum at those wavelengths. For Å, the veiling model fits the low resolution spectrum well. The pair is located about 12 arcseconds away from FV Tau.
GG Tau – The secondary was only partially contained within the slit. The spectrum of the secondary was multiplied by a factor of 2.3 to compensate for this effect, which brings the flux ratio of the spectra of the two stars in agreement with the flux ratio of 3.0 measured from the acquisition image. Residuals in the low resolution models for both stars have a small wave. H is saturated in the primary, which shows Ca II emission lines as well as Paschen lines. The dereddened fluxes of the brightest Paschen lines are about one-third that of the Ca II lines.
GH Tau (Haro 6-20)– Aside from a difference of 0.5 in the reddening, the spectra of these two stars are essentially identical at both low and medium resolution except for [O I] emission lines that occur in the secondary but not in the primary. On the medium resolution spectra, both stars have somewhat stronger absorption lines than the templates do. This result does not depend on the choice of the template and is not caused by template mismatch in spectral type. At low resolution, both stars have weaker TiO bands than exists in the templates. If one star is used as a template for the other, the residuals show no photospheric features. The reddening difference between the primary and secondary is significant – making the extinctions of the two stars equal introduces a negative veiling in one or both components.
HBC 358 (NTTS 040047) – This system is a hierarchical triple. The secondary consists of two components that differ by only 0.01 magnitude in the acquisition image, and are each 0.28 magnitude fainter than the primary. The brighter of secondary components and the primary were centered on the slit. About 1/3 of the light from the fainter component of the secondary was included within the slit, and coincides spatially with the spectrum from the brighter component of the secondary. To correct for this effect, the extracted spectrum of the secondary was multiplied by a factor of 0.75. Hence, the spectrum of the secondary is that of the brighter component only.
HBC 360 (NTTS 040142) – HBC 360 is wide binary with a separation of about 7.1 arcseconds and two nearly equal components. Only the primary was observed with HST, but the secondary is also known to be a wTTs (Hartigan et al., 1994).
IS Tau (Haro 6-23) – Low and medium resolution spectra give consistent veilings for both primary and secondary where the wavelengths overlap. Both stars are have visual extinctions of about 3.5 magnitudes. IS Tau s has a somewhat later spectral type than the template, but choosing a later template produces a poorer fit. The slight rise in the residual of the low resolution model for IS Tau p is caused by a combination of noise in the spectrum and spectral type mismatch in the template.
Lk Ca 7 (V1070 Tau) – Both the primary (K7) and secondary (M3.5) of this subarcsecond weak-lined T Tauri binary are useful as spectroscopic templates.
UY Aur – UY Aur s has bright Ca triplet emission. The template provides a good match to UY Aur s on both spectra. Residuals for the medium resolution spectrum of UY Aur p have a small wave. The reddening difference between the stars is significant. The secondary of UY Aur has been known to have variable reddening since the early observations of Joy & van Biesbrock (1944) (see also Herbst et al., 1995).
UZ Tau/W – Given the errors, both stars have no veiling in the low-resolution spectrum, but veiling at the 2 – 3 sigma level is present for both stars in the medium-resolution spectra. Both stars have strong H emission and significant KL excess, and [O I] is also bright in the secondary, so this is a cTTs pair with unusually weak veiling. The templates provide an excellent match for the medium resolution spectra of both stars. Residuals for the low resolution spectra have a wavy pattern at long wavelengths. Changing the template makes this pattern worse. About 3.5 arcseconds to the east lies UZ Tau E, which Mathieu et al. (1996) report as a spectroscopic binary. The secondary is significantly more reddened than the primary.
V807 Tau – The primary is a K5 with an H equivalent width of 7.4Å a large IR excess, and so is a cTTs even though it is not veiled (and, in fact, used as a template). The secondary, an M2.0, is also a good spectroscopic template. The secondary has relatively strong [O I] emission, but lacks other cTTs signatures.
V927 Tau (LkH 331) – The low resolution spectrum of the primary is a little later than the template.
V955 Tau (LkH 332) – The templates provide good matches to the spectra of both stars, though the low resolution spectrum of V955 Tau s is slightly later than the template.
V999 Tau (LkH 332/G2) – The template for the primary star does not match as well as most of the rest of the stars in the sample. The secondary spectrum yields a good veiling measurement at low resolution, but shows no other cTTs signatures.
V1026 Tau (Haro 6-28) – Low and medium-resolution spectra for both stars give consistent veiling where the wavelengths overlap, and the templates provide a very good match to the absorption lines.
XZ Tau - The veiling measurement for the primary is large. XZ Tau p has many emission lines. The Ca II triplet is particularly strong here, with each line nearly as bright as H. The Paschen series is visible from Pa7 near the red limit of the spectra through Pa14, above which the series becomes weaker and blends with the Ca II lines. The dereddened luminosities for the brighter Paschen lines are about L⊙ apiece. The reddening seems reliable – larger values make the low resolution spectrum too blue. Residuals for the low resolution spectrum of XZ Tau s are relatively large at the longest wavelengths.
| Name | bPA | cSep | Date |
|---|---|---|---|
| DD Tau | 182.1 (1.0) | 568 (14) | 1999.68 |
| DF Tau | 273.4 (6.1) | 99 (14) | 1998.90 |
| FO Tau | 203.8 (4.1) | 146 (14) | 1999.79 |
| FQ Tau | 67.4 (0.7) | 763 (14) | 1998.93 |
| FS Tau | 93.7 (2.5) | 242 (14) | 2000.95 |
| FV Tau | 273.0 (0.8) | 711 (14) | 2000.92 |
| FV Tau/ch | 293.6 (0.8) | 701 (14) | 1998.92 |
| GG Tau | 348.6 (2.4) | 248 (14) | 2001.06 |
| GH Tau | 293.7 (2.0) | 304 (14) | 2001.06 |
| HBC 358f | 47.5 (0.4) | 1555 (14) | 1998.92 |
| HBC 358sg | 337.3 (4.1) | 149 (14) | 1998.92 |
| IS Tau | 104.1 (2.8) | 216 (14) | 2000.92 |
| LkCa 7 | 25.2 (0.6) | 1035 (14) | 1999.07 |
| UY Aur | 228.1 (0.7) | 892 (14) | 1998.98 |
| UZ Tau W | 3.6 (1.6) | 369 (14) | 1999.84e |
| UZ Tau Ed | 93.2 (0.2) | 3551 (14) | 1999.84 |
| V807 Tau | 322.9 (2.0) | 297 (14) | 1998.92 |
| V927 Tau | 287.8 (2.1) | 280 (14) | 1999.77 |
| V955 Tau | 206.1 (1.7) | 339 (14) | 1998.98 |
| V999 Tau | 242.0 (3.1) | 226 (14) | 1998.95 |
| V1026 Tau | 245.9 (0.8) | 658 (14) | 1998.92 |
| XZ Tau | 142.6 (2.0) | 299 (14) | 2000.92 |
| H | [O I] | [O I] | Ca II | Ca II | Ca II | Pa9 | |
|---|---|---|---|---|---|---|---|
| Nameb | 6563 | 5577 | 6300 | 8498 | 8542 | 8662 | 9229 |
| DD Tau p | 206 (10) | 0.4 | 7.7 (0.2) | 7.8 (0.4) | 5.9 (0.4) | 6.1 (0.4) | 0.5 |
| DD Tau s | 635 (30) | 9.1 (1.7) | 19 (01) | 0.8 | 2.7 (1.2) | 1.6 (1.0) | 0.6 |
| DF Tau p | c55 (8) | 0.15 | d1.8 (0.2) | 2.0 (0.2) | 3.0 (0.2) | 1.8 (0.2) | 2.4 (0.2) |
| DF Tau s | c52 (8) | 0.2 | d1.7 (0.2) | 2.1 (0.3) | 1.6 (0.2) | 1.6 (0.2) | 0.4 |
| FO Tau p | 137 (10) | 0.2 | 0.5 (0.1) | 2.6 (0.2) | 2.5 (0.2) | 2.8 (0.3) | 1.3 (0.2) |
| FO Tau s | 95 (10) | 0.5 | 0.1 | 0.5 | 0.5 | 0.5 | 0.3 |
| FQ Tau p | 110 (5) | 0.5 | 0.9 (0.1) | 5.9 (0.5) | 6.3 (0.4) | 4.0 (0.4) | 0.5 |
| FQ Tau s | 23 (4) | 0.9 | 0.1 | 0.5 | 0.5 | 0.5 | 0.6 |
| FS Tau p | 71 (5) | 2.5 | e21 (3) | 3.7 (0.3) | 4.9 (0.3) | 5.4 (0.3) | 1.1 (0.2) |
| FS Tau s | 33 (3) | 8.0 | 13 (2) | 0.8 | 0.5 | 0.8 | 0.3 |
| FV Tau p | 15 (2) | 0.7 | 0.3 (0.1) | 2.7 (0.8) | 0.8 (0.8) | 2.0 (0.8) | 0.9 |
| FV Tau s | 63 (5) | 1.5 | 1.6 (0.3) | 8.8 (0.4) | 9.7 (0.5) | 6.7 (0.3) | 0.9 |
| FV Tau/c p | 21 (2) | 0.6 | 0.1 | 0.4 | 0.4 | 0.4 | 0.4 |
| FV Tau/c s | 800 (90) | 12 | 67 (20) | 1.2 | 1.0 | 0.6 | 1.4 |
| GG Tau p | c42 (2) | 0.7 | 0.2 | 2.9 (0.4) | 2.8 (0.4) | 2.2 (0.3) | 1.5 (0.3) |
| GG Tau s | 21 (4) | 0.4 | 0.5 (0.1) | 0.5 | 0.5 | 0.5 | 0.5 |
| GH Tau p | 10 (1) | 0.6 | 0.2 | 0.3 | 0.3 | 0.3 | 0.3 |
| GH Tau s | 10 (1) | 0.8 | 0.9 (0.1) | 0.6 | 0.6 | 0.7 | 0.7 |
| HBC 358 p | 4.5 (0.4) | 1.1 | 0.1 | 1.1 | 1.1 | 1.1 | 1.1 |
| HBC 358 s | 6.9 (1.0) | 1.1 | 0.1 | 1.1 | 1.1 | 1.1 | 1.1 |
| HBC 360 p | 4.6 (0.4) | 1.1 | 0.2 | 1.1 | 1.1 | 1.1 | 1.1 |
| IS Tau p | 9.5 (0.4) | 0.2 | 0.5 (0.1) | 0.9 | 0.9 | 0.8 | 0.8 |
| IS Tau s | 24 (3) | 1.8 | 0.5 (0.2) | 0.8 | 0.8 | 0.8 | 0.8 |
| LkCa 7 p | 1.4 (0.2) | 0.5 | 0.1 | 0.5 | 0.5 | 0.5 | 0.5 |
| LkCa 7 s | 2.2 (1.0) | 0.5 | 0.1 | 0.8 | 0.8 | 0.8 | 0.8 |
| UY Aur p | 36 (1) | 0.5 | d1.1 (0.1) | 0.2 | 0.2 | 0.2 | 0.2 |
| UY Aur s | 59 (4) | 0.6 | 3.4 (0.2) | 0.5 (0.6) | 10.2 (0.6) | 8.5 (0.6) | 0.6 |
| UZ Tau W p | 54 (8) | 0.3 | 0.1 | 0.5 | 0.5 | 0.5 | 0.5 |
| UZ Tau W s | 97 (8) | 1.5 | 1.5 (0.1) | 0.5 | 0.5 | 0.5 | 0.5 |
| V807 Tau p | c7.4 (0.5) | 0.4 | 0.1 | 0.6 | 0.6 | 0.7 | 0.7 |
| V807 Tau s | 3.4 (0.4) | 0.5 | 0.8 (0.1) | 0.6 | 0.6 | 0.7 | 0.7 |
| V927 Tau p | 5.6 (0.8) | 0.8 | 0.05 | 0.5 | 0.5 | 0.5 | 0.5 |
| V927 Tau s | 2.5 (1.8) | 0.8 | 0.4 | 1.5 | 1.5 | 1.5 | 1.5 |
| V955 Tau p | 10.9 (0.6) | 0.5 | 0.2 | 0.4 | 0.4 | 0.4 | 0.4 |
| V955 Tau s | 6.2 (0.6) | 0.6 | 1.1 (0.1) | 0.7 | 0.7 | 0.7 | 0.7 |
| V999 Tau p | 1.6 (0.3) | 0.6 | 0.1 | 0.6 | 0.6 | 0.6 | 0.6 |
| V999 Tau s | 4.5 (0.4) | 1.5 | 0.1 | 0.7 | 0.7 | 0.7 | 0.7 |
| V1026 Tau p | 57 (6) | 0.4 | 0.1 | 0.3 | 0.3 | 0.4 | 0.6 (0.2) |
| V1026 Tau s | 124 (10) | 2.0 | 5.6 (0.5) | 1.1 | 1.1 | 1.1 | 1.1 |
| XZ Tau p | 77 (6) | 0.4 | 2.8 (0.1) | 36 (2) | 36 (1) | 37 (2) | 2.3 (0.2) |
| XZ Tau s | 42 (5) | 0.6 | 11.5 (0.5) | 1.2 | 1.2 | 1.2 | 1.2 |
| Name | Template | blog F | cF | |
|---|---|---|---|---|
| DD Tau p | LkCa 7 s | |||
| DD Tau s | LkCa 7 s | |||
| DF Tau p | V807 Tau s | |||
| DF Tau s | V807 Tau s | |||
| FO Tau p | LkCa 7 s | |||
| FO Tau s | LkCa 7 s | |||
| FQ Tau p | LkCa 7 s | |||
| FQ Tau s | LkCa 7 s | |||
| FS Tau p | ||||
| FS Tau s | LkCa 7 s | |||
| FV Tau p | V807 Tau p | |||
| FV Tau s | ||||
| FV Tau/c p | V807 Tau s | |||
| FV Tau/c s | ||||
| GG Tau p | LkCa 7 p | |||
| GG Tau s | V807 Tau s | |||
| GH Tau p | V955 Tau s | |||
| GH Tau s | V955 Tau s | |||
| HBC 358 p | HBC 358 s | |||
| HBC 358 s | HBC 358 p | |||
| HBC 360 p | HBC 358 p | |||
| IS Tau p | LkCa 7 p | |||
| IS Tau s | LkCa 7 s | |||
| UY Aur p | LkCa 7 p | |||
| UY Aur s | V807 Tau s | |||
| UZ Tau W p | V807 Tau s | |||
| UZ Tau W s | V807 Tau s | |||
| V927 Tau p | LkCa 7 s | |||
| V927 Tau s | LkCa 7 s | |||
| V955 Tau p | V807 Tau p | |||
| V955 Tau s | V807 Tau s | |||
| V999 Tau s | V955 Tau s | |||
| V1026 Tau p | V807 Tau s | |||
| V1026 Tau s | HBC 358 s | |||
| XZ Tau p | V807 Tau s | |||
| XZ Tau s | HBC 358 s |
| TTS | Template | blog | ||
|---|---|---|---|---|
| DD Tau p | LkCa 7 s | |||
| DD Tau s | LkCa 7 s | |||
| DF Tau p | V807 Tau s | |||
| DF Tau s | V807 Tau s | |||
| FO Tau p | LkCa 7 s | |||
| FO Tau s | LkCa 7 s | |||
| FQ Tau p | LkCa 7 s | |||
| FQ Tau s | LkCa 7 s | |||
| FS Tau p | LkCa 7 p | |||
| FS Tau s | LkCa 7 s | |||
| FV Tau p | V807 Tau p | |||
| FV Tau s | 5 | |||
| FV Tau/c p | V807 Tau s | |||
| FV Tau/c s | LkCa 7 s | |||
| GG Tau p | LkCa 7 p | |||
| GG Tau s | V807 Tau s | |||
| GH Tau p | V807 Tau s | |||
| GH Tau s | V807 Tau s | |||
| HBC 358 p | HBC 360 p | |||
| HBC 358 s | LkCa 7 s | |||
| HBC 360 p | HBC 358 p | |||
| IS Tau p | LkCa 7 p | |||
| IS Tau s | LkCa 7 s | |||
| UY Aur p | LkCa 7 p | |||
| UY Aur s | V807 Tau s | |||
| UZ Tau/W p | V807 Tau s | |||
| UZ Tau/W s | V807 Tau s | |||
| V927 Tau p | LkCa 7 s | |||
| V927 Tau s | LkCa 7 s | |||
| V955 Tau p | V807 Tau p | |||
| V955 Tau s | V807 Tau s | |||
| V999 Tau s | V955 Tau s | |||
| V1026 Tau p | V807 Tau s | |||
| V1026 Tau s | HBC 358 s | |||
| XZ Tau p | V807 Tau s | |||
| XZ Tau s | LkCa 7 s |
| Name | Sp. | bM⋆ | blog() | cR⋆ | dMacc | KL log LS | ||||
|---|---|---|---|---|---|---|---|---|---|---|
| DD Tau p | M3.5 | 2.10 | 0.39 | 0.098 | 0.29 | 6.17 | 1.9 | 7.21 | 0.91 | |
| DD Tau s | M3.5 | 2.90 | 0.24 | 0.045 | 0.29 | 6.34 | 1.5 | 7.65 | 0.75 | 0.21 |
| DF Tau p | M2.0 | 0.60 | 0.52 | 0.283 | 0.38 | 6.14 | 1.9 | 6.87 | ||
| DF Tau s | M2.5 | 0.75 | 0.68 | 0.206 | 0.35 | 6.02 | 2.3 | 6.89 | 0.15 | |
| FO Tau p | M3.5 | 1.90 | 0.30 | 0.050 | 0.29 | 6.27 | 1.6 | 7.58 | 0.43 | |
| FO Tau s | M3.5 | 1.90 | 0.30 | 0.031 | 0.29 | 6.27 | 1.6 | 7.78 | 0.08 | 0.00 |
| FQ Tau p | M3.0 | 1.95 | 0.20 | 0.026 | 0.31 | 6.44 | 1.3 | 7.98 | 0.10 | |
| FQ Tau s | M3.5 | 1.80 | 0.28 | (0.005) | 0.29 | 6.28 | 1.6 | (8.57) | 0.06 | 0.18 |
| FS Tau p | M0 | 4.95 | 0.15 | 0.037 | 0.61 | 7.23 | 0.9 | 8.28 | 1.02 | |
| FS Tau s | M3.5 | 5.15 | 0.17 | 0.012 | 0.28 | 6.48 | 1.2 | 8.31 | 1.18 | 0.72 |
| FV Tau p | K5 | 5.40 | 1.50 | 0.577 | 1.20 | 6.39 | 2.1 | 7.01 | 0.20 | |
| FV Tau sg | Cont | 5.40 | 0.130 | 7.33 | 0.87 | |||||
| FV Tau/c p | M2.5 | 3.25 | 0.18 | (0.006) | 0.34 | 6.56 | 1.2 | (8.70) | 0.15 | 0.14h |
| FV Tau/c si | M3.5 | 7.00 | 0.06 | 0.019 | 0.24 | 6.93 | 1.1 | 8.08 | 0.83 | 0.46 |
| GG Tau p | M0 | 0.30 | 0.38 | 0.122 | 0.60 | 6.61 | 1.4 | 7.56 | 0.72 | |
| GG Tau s | M2.0 | 0.45 | 0.20 | 0.079 | 0.38 | 6.57 | 1.2 | 7.62 | 0.61 | 0.02 |
| GH Tau p | M2.0 | 0.00 | 0.28 | 0.027 | 0.38 | 6.40 | 1.4 | 8.02 | 0.54 | |
| GH Tau s | M2.0 | 0.50 | 0.27 | 0.027 | 0.38 | 6.42 | 1.4 | 8.02 | 0.68 | 0.02 |
| HBC 358 p | M3.5 | 0.05 | 0.12 | (0.003) | 0.27 | 6.63 | 1.0 | (8.97) | ||
| HBC 358 s | M4.0 | 0.05 | 0.12 | (0.003) | 0.23 | 6.57 | 1.1 | (8.86) | 0.08 | |
| HBC 360 p | M3.5 | 0.05 | 0.12 | (0.003) | 0.27 | 6.63 | 1.0 | (8.97) | ||
| IS Tau p | M0 | 3.25 | 0.64 | 0.041 | 0.58 | 6.28 | 1.8 | 7.91 | 0.65 | |
| IS Tau s | M3.5 | 3.60 | 0.21 | (0.011) | 0.28 | 6.39 | 1.4 | (8.28) | 0.10 | 0.12 |
| LkCa 7 p | M0 | 0.20 | 0.43 | (0.015) | 0.59 | 6.51 | 1.5 | (8.44) | 0.07 | |
| LkCa 7 s | M3.5 | 0.35 | 0.18 | (0.008) | 0.28 | 6.45 | 1.3 | (8.45) | 0.13 | 0.06 |
| UY Aur p | M0 | 0.55 | 0.32 | 0.109 | 0.60 | 6.71 | 1.3 | 7.64 | 0.81 | |
| UY Aur s | M2.5 | 2.65 | 0.17 | 0.064 | 0.34 | 6.59 | 1.1 | 7.70 | 0.97 | 0.09 |
| UZ Tau W p | M2.0 | 0.55 | 0.44 | 0.020 | 0.38 | 6.21 | 1.8 | 8.04 | 0.68 | |
| UZ Tau W s | M3.0 | 1.75 | 0.75 | 0.013 | 0.32 | 5.93 | 2.5 | 8.01 | 0.37 | 0.31 |
| V807 Tau p | K5 | 0.50 | 2.30 | (0.100) | 1.20 | 6.13 | 2.6 | (8.68) | 0.69 | |
| V807 Tau s | M2.0 | 0.60 | 1.04 | (0.035) | 0.38 | 5.85 | 2.7 | (8.62) | 0.08 | 0.27 |
| V927 Tau p | M3.0 | 1.40 | 0.32 | (0.011) | 0.32 | 6.26 | 1.6 | (8.28) | 0.16 | |
| V927 Tau s | M3.5 | 0.85 | 0.11 | 0.002 | 0.26 | 6.66 | 1.0 | 9.13 | 0.17 | 0.44 |
| V955 Tau p | K7 | 2.80 | 0.20 | (0.009) | 0.73 | 7.26 | 0.9 | (8.97) | 0.51 | |
| V955 Tau s | M2.5 | 2.30 | 0.09 | 0.003 | 0.31 | 6.92 | 0.8 | 9.13 | 0.29 | 0.28 |
| V999 Tau p | M0.5 | 2.00 | 0.24 | (0.013) | 0.52 | 6.75 | 1.1 | (8.58) | 0.07 | |
| V999 Tau s | M2.5 | 3.30 | 0.15 | 0.018 | 0.33 | 6.65 | 1.1 | 8.24 | 0.26 | 0.08 |
| V1026 Tau p | M2.0 | 2.30 | 0.09 | 0.036 | 0.35 | 7.01 | 0.8 | 8.10 | 0.44 | |
| V1026 Tau s | M3.5 | 1.90 | 0.03 | 0.002 | 0.21 | 7.27 | 0.5 | 9.34 | 0.66 | 0.24 |
| XZ Tau p | M2.0 | 1.40 | 0.17 | 0.347 | 0.37 | 6.66 | 1.1 | 7.00 | 1.09 | |
| XZ Tau s | M3.5 | 1.35 | 0.31 | 0.044 | 0.29 | 6.25 | 1.7 | 7.61 | 1.61 | 0.45 |
| Name | H | [O I] 6300 | Ca II 8542 |
|---|---|---|---|
| DD Tau p | 2.66 (0.01) | 4.28 (0.01) | 3.90 (0.04) |
| DD Tau s | 2.35 (0.02) | 4.15 (0.01) | 4.59 (0.10) |
| DF Tau pb | 2.72 (0.06) | 4.35 (0.04) | 3.87 (0.10) |
| DF Tau sb | 2.69 (0.06) | 4.36 (0.04) | 4.06 (0.10) |
| FO Tau p | 2.89 (0.04) | 5.62 (0.06) | 4.23 (0.08) |
| FO Tau s | 3.17 (0.04) | 6.3 | 4.6 |
| FQ Tau p | 3.17 (0.04) | 5.53 (0.04) | 4.14 (0.04) |
| FQ Tau s | 3.87 (0.07) | 6.7 | 4.7 |
| FS Tau p | 3.11 (0.03) | 3.90 (0.01) | 4.19 (0.04) |
| FS Tau s | 3.80 (0.05) | 4.26 (0.02) | 4.6 |
| FV Tau p | 2.87 (0.04) | 3.6 | 3.71 (0.10) |
| FV Tau sc | 3.23 (0.04) | 4.84 (0.08) | 3.80 (0.15) |
| FV Tau/c p | 3.74 (0.03) | 6.3 | 4.8 |
| FV Tau/c s | 2.27 (0.05) | 3.63 (0.02) | 4.2 |
| GG Tau pb | 2.67 (0.01) | 5.1 | 3.71 (0.06) |
| GG Tau s | 3.41 (0.08) | 5.14 (0.06) | 4.5 |
| GH Tau p | 3.78 (0.05) | 5.9 | 4.7 |
| GH Tau s | 3.80 (0.05) | 5.08 (0.06) | 4.7 |
| HBC 358 p | 4.91 (0.04) | 6.9 | 4.7 |
| HBC 358 s | 4.81 (0.05) | 6.9 | 5.0 |
| HBC 360 p | 4.66 (0.03) | 6.9 | 4.7 |
| IS Tau p | 3.53 (0.02) | 4.76 (0.10) | 4.6 |
| IS Tau s | 3.89 (0.04) | 6.02 (0.15) | 4.8 |
| LkCa 7 p | 4.30 (0.03) | 5.6 | 4.6 |
| LkCa 7 s | 4.80 (0.15) | 6.8 | 4.9 |
| UY Aur p | 2.81 (0.04) | 4.42 (0.04) | 4.51 (0.08) |
| UY Aur s | 3.10 (0.03) | 4.54 (0.02) | 3.63 (0.03) |
| UZ Tau W p | 3.07 (0.06) | 6.1 | 4.6 |
| UZ Tau W s | 2.72 (0.04) | 4.80 (0.04) | 4.1 |
| V807 Tau pb | 3.21 (0.04) | 5.0 | 4.2 |
| V807 Tau s | 4.07 (0.06) | 4.97 (0.02) | 4.8 |
| V927 Tau p | 4.26 (0.06) | 5.7 | 4.5 |
| V927 Tau s | 5.13 (0.22) | 5.71 (0.02) | 4.5 |
| V955 Tau p | 3.33 (0.02) | 6.3 | 4.7 |
| V955 Tau s | 4.27 (0.05) | 6.0 | 5.0 |
| V999 Tau p | 4.63 (0.07) | 5.8 | 4.7 |
| V999 Tau s | 4.41 (0.04) | 4.90 (0.04) | 4.4 |
| V1026 Tau p | 3.36 (0.04) | 6.5 | 4.9 |
| V1026 Tau s | 3.81 (0.02) | 5.52 (0.04) | 4.7 |
| XZ Tau p | 2.62 (0.02) | 4.18 (0.01) | 2.81 (0.02) |
| XZ Tau s | 3.17 (0.04) | 4.99 (0.01) | 4.03 (0.30) |
| Name | EW(H)b | Veilingc | IR Excessd | [O I]e | Classf |
|---|---|---|---|---|---|
| DD Tau p | X | X | X | X | C |
| DD Tau s | X | X | X | X | C |
| DF Tau p | X | X | X | C | |
| DF Tau s | X | X | X | C | |
| FO Tau p | X | X | X | X | C |
| FO Tau s | X | X | C | ||
| FQ Tau p | X | X | X | C | |
| FQ Tau s | W | ||||
| FS Tau p | X | X | X | X | C |
| FS Tau s | X | X | X | X | C |
| FV Tau p | X | X | X | X | C |
| FV Tau s | X | X | X | X | C |
| FV Tau/c p | W | ||||
| FV Tau/c s | X | X | X | X | C |
| GG Tau p | X | X | X | C | |
| GG Tau s | X | X | X | X | C |
| GH Tau p | X | X | X | C | |
| GH Tau s | X | X | X | X | C |
| HBC 358 p | W | ||||
| HBC 358 s | W | ||||
| HBC 360 p | W | ||||
| IS Tau p | X | X | X | X | C |
| IS Tau s | X | W | |||
| LkCa 7 p | W | ||||
| LkCa 7 s | W | ||||
| UY Aur p | X | X | X | X | C |
| UY Aur s | X | X | X | X | C |
| UZ Tau W p | X | X | X | C | |
| UZ Tau W s | X | X | X | X | C |
| V807 Tau p | X | X | C | ||
| V807 Tau s | X | W | |||
| V927 Tau p | W | ||||
| V927 Tau s | X | W | |||
| V955 Tau p | X | X | C | ||
| V955 Tau s | X | X | C | ||
| V999 Tau p | W | ||||
| V999 Tau s | X | W | |||
| V1026 Tau p | X | X | X | C | |
| V1026 Tau s | X | X | X | X | C |
| XZ Tau p | X | X | X | X | C |
| XZ Tau s | X | X | X | X | C |