Chandra Snapshot Observations of Low-Luminosity AGNs with a Compact Radio Source
Abstract
The results of Chandra snapshot observations of 11 LINERs (Low-Ionization Nuclear Emission-line Regions), three low-luminosity Seyfert galaxies, and one H II-LINER transition object are presented. Our sample consists of all the objects with a flat or inverted spectrum compact radio core in the VLA survey of 48 low-luminosity AGNs (LLAGNs) by Nagar et al. (2000). An X-ray nucleus is detected in all galaxies except one and their X-ray luminosities are in the range to ergs s-1. The X-ray spectra are generally steeper than expected from thermal bremsstrahlung emission from an advection-dominated accretion flow (ADAF). The X-ray to H luminosity ratios for 11 out of 14 objects are in good agreement with the value characteristic of LLAGNs and more luminous AGNs, and indicate that their optical emission lines are predominantly powered by a LLAGN. For three objects, this ratio is less than expected. Comparing with properties in other wavelengths, we find that these three galaxies are most likely to be heavily obscured AGN. We use the ratio (5 GHz)/, where is the luminosity in the 2–10 keV band, as a measure of radio loudness. In contrast to the usual definition of radio loudness ((5 GHz)/(B)), can be used for heavily obscured ( cm-2, mag) nuclei. Further, with the high spatial resolution of Chandra, the nuclear X-ray emission of LLAGNs is often easier to measure than the nuclear optical emission. We investigate the values of for LLAGNs, luminous Seyfert galaxies, quasars and radio galaxies and confirm the suggestion that a large fraction of LLAGNs are radio loud.
1 Introduction
Low-Ionization nuclear emission-line regions (LINERs; Heckman 1980) are found in many nearby bright galaxies (e.g., Ho, Filippenko, & Sargent 1997a). Extensive studies at various wavelengths have shown that type 1 LINERs (LINER 1s, i.e., those galaxies having broad H and possibly other broad Balmer lines in their nuclear optical spectra) are powered by a low-luminosity AGN (LLAGN) with a bolometric luminosity less than ergs s-1 (Ho et al. 2001; Terashima, Ho, & Ptak 2000a; Ho et al. 1997b). On the other hand, the energy source of LINER 2s is likely to be heterogeneous. Some LINER 2s show clear signatures of the presence of an AGN, while others are most probably powered by stellar processes, and the luminosity ratio / can be used to discriminate between these different power sources (e.g., Pérez-Olea & Colina 1996; Maoz et al. 1998; Terashima et al. 2000b). It is interesting to note that currently there are only a few LINER 2s known to host an obscured AGN (e.g., Turner et al. 2001). This paucity of obscured AGN in LINERs may indicate that LINER 2s are not simply a low-luminosity extension of luminous Seyfert 2s, which generally show heavy obscuration with a column density averaging cm-2 (e.g., Turner et al. 1997). Alternatively, biases against finding heavily obscured LLAGNs may be important. For example, objects selected through optical emission lines or X-ray fluxes are probably biased in favor of less absorbed ones, even if one uses the X-ray band above 2 keV.
In contrast, radio observations, particularly at high frequency, are much less affected by absorption. Although an optical spectroscopic survey must first be done to find the emission lines characteristic of a LLAGN, follow up radio observations can clarify the nature of the activity. For example, VLBI observations of some LLAGNs have revealed a compact nuclear radio source with K, which is an unambiguous indicator of the presence of an active nucleus and cannot be produced by starburst activity (e.g., Falcke et al. 2000; Ulvestad & Ho 2001). A number of surveys of Seyfert galaxies at sub arcsecond resolution have been made with the VLA (Ulvestad & Wilson 1989 and references therein; Kukula et al. 1995; Nagar et al. 1999; Thean et al. 2000; Schmitt et al. 2001; Ho & Ulvestad 2001) and other interferometers (Roy et al. 1994; Morganti et al. 1999), but much less work has been done on the nuclear radio emission of LINERs. Nagar et al. (2002) have reported a VLA 2 cm radio survey of all 96 LLAGNs within a distance of 19 Mpc. These LLAGNs come from the Palomar spectroscopic survey of bright galaxies (Ho et al. 1997a). As a pilot study of the X-ray properties of LLAGNs, we report here a Chandra survey of a subset, comprising 15 galaxies, of Nagar et al’s (2002) sample. Fourteen of these galaxies have a compact nuclear radio core with a flat or inverted radio spectrum (Nagar et al. 2000). We have detected 13 of the galactic nuclei with Chandra. We also examine the “radio loudness” of our sample and compare it with other classes of AGN. A new measure of “radio loudness” is developed, in which the 5 GHz radio luminosity is compared with the 2–10 keV X-ray luminosity (= (5 GHz)/(2–10 keV)) rather than with the B-band optical luminosity ((5 GHz)/(B)), as is usually done. has the advantage that it can be measured for highly absorbed nuclei ( up to several times cm-2) which would be totally obscured ( up to a few hundred mag for the Galactic gas to dust ratio) at optical wavelengths, and that the compact, hard X-ray source in a LLAGN is less likely to be confused with emission from stellar-powered processes than is an optical nucleus.
This paper is organized as follows. The sample, observations, and data reduction are described in section 2. Imaging results and X-ray source detections are given in section 3. Section 4 presents spectral results. The power source, obscuration in LLAGNs, and radio loudness of LLAGNs are discussed in section 5. Section 6 summarizes the findings. We use a Hubble constant of km s-1 Mpc-1 and a deceleration parameter of throughout this paper.
2 The Sample, Observations, and Data Reduction
Our sample is based on the VLA observations by Nagar et al. (2000). Their sample of 48 objects consists of 22 LINERs, 18 transition objects, which show optical spectra intermediate between LINERs and H II nuclei, and eight low-luminosity Seyferts selected from the optical spectroscopic survey of Ho et al. (1997a). The sample is the first half of a distance-limited sample of LLAGNs (Nagar et al. 2002), as described in section 1.
We selected 14 objects showing a flat to inverted spectrum radio core (, ) according to Nagar et al.’s (2000) comparison with longer wavelength radio data published in the literature. One object (the LINER 2 NGC 4550) has a flat spectrum radio source at a position significantly offset from the optical nucleus. This object was added as an example of a LINER without a detected radio core. The target list and some basic data for the final sample are summarized in Table 1. The distances are taken from Tully (1988) in which km s-1 Mpc-1 is assumed. The sample consists of seven LINER 1s, four LINER 2s, two Seyfert 1s, one Seyfert 2, and one transition 2 object. 12 out of these 15 objects have been observed with the VLBA and high brightness temperature ( K) radio cores were detected in all of them (Falcke et al. 2000; Ulvestad & Ho 2001; Nagar et al. 2002). Therefore, these objects are strong candidates for AGNs. Results of archival / scheduled Chandra observations of more LINERs with a compact flat/inverted spectrum radio core found by Nagar et al. (2002) will be presented in a future paper.
A log of Chandra observations is shown in Table 1. The exposure time was typically two ksec each. All the objects were observed at or near the aim point of the ACIS-S3 back-illuminated CCD chip. Eight objects were observed in our Guaranteed Time Observation program and the rest of the objects were taken from the Chandra archives. The eight objects were observed in 1/8 sub-frame mode (frame time 0.4 s) to minimize effects of pileup (e.g., Davis 2001). 1/2 sub-frame modes were used for three objects. CIAO 2.2.1 and CALDB 2.7 were used to reduce the data. In the following analysis, only events with ASCA grades 0, 2, 3, 4, 6 (“good grades”) were used. For spectral fitting, XSPEC version 11.2.0 was employed.
3 X-ray Images and Source Detection
3.1 Source Detection
An X-ray nucleus is seen in all the galaxies except for NGC 4550 and NGC 5866. Some off-nuclear sources are also seen in some fields. The source detection algorithm “wavdetect” in the CIAO package was applied to detect these nuclear and off-nuclear sources, where a detection threshold of and wavelet scales of 1, , 2, , 4, , 8, , and 16 pixels were used. Source detections were performed in the three energy bands 0.5–8 keV (full band), 0.5–2 keV (soft band), and 2–8 keV (hard band). The resulting source lists and raw images were examined by eye to exclude spurious detections. The source and background counts were also determined by manual photometry and compared with the results of wavdetect. In the few cases that the two methods gave discrepant results, we decided to use the results of the manual photometry after inspection of the raw images. Some sources were detected in only one or two energy bands. In such cases, we calculated the upper limits on the source counts in the undetected band(s) at the 95% confidence level by interpolating the values in Table 2 of Kraft, Burrows, & Nousek (1991).
Table 2 shows the positions, detected counts, band ratios (hard/soft counts), fluxes and luminosities in the 2–10 keV band of the nuclear sources. The same parameters for off-nuclear sources with signal-to-noise ratios greater than three are summarized in Table 3. For bright objects ( 40 counts), the fluxes were measured by spectral fits presented in the next section. For faint objects, fluxes were determined by assuming the Galactic absorption column density and power law spectra, with photon indices determined from the band ratios. When only lower or upper limits on the band ratio were available, a photon index of 2 was assumed if the limit is consistent with . When the band ratio is inconsistent with , the upper or lower limit is used to determine the photon index. Luminosities were calculated only if the source is spatially inside the optical host galaxy as indicated by comparing the position with the optical image of the Digitized Sky Survey. Possible identifications for off-nuclear sources are also given in the last column of Table 3.
The positions of the X-ray nuclei coincide with the radio core positions to within the positional accuracy of Chandra. The nominal separations between the X-ray and radio nuclei are in the range 0.05 – 0.95′′.
3.2 X-ray Morphology of the Nuclear Region
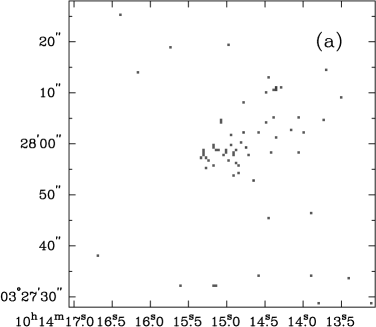
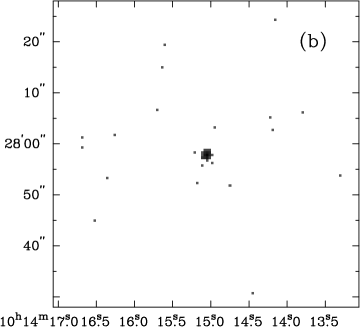
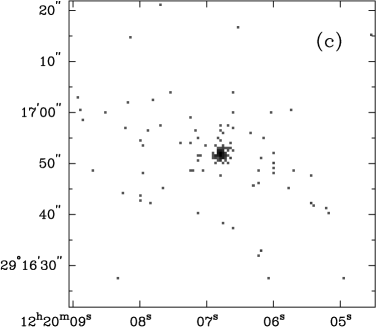
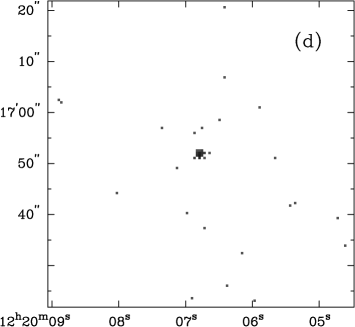
Inspection of the images shows that the nucleus in most objects appears to be unresolved, while some objects show faint extended emission. The soft and hard band images of the nuclear regions of NGC 3169 and NGC 4278 are shown in Fig 1 as examples of extended emission. In the soft band image of NGC 3169, emission in the nuclear region extending arcsec in diameter is clearly visible, while the nucleus itself is not detected (Table 2). About 25 counts were detected within a 10 pixel (4.9 arcsec) radius in the keV band. This extended emission is not seen in the hard band. The soft band image of NGC 4278 consists of a bright nucleus and a faint elongated feature with a length of and a position angle of . The hard band image is unresolved.
The nuclear regions (10 arcsec scale) of the other galaxies look compact to within the current photon statistics. More extended diffuse emission at larger scales () is seen in a few objects. The nuclei of NGC 2787 and NGC 4203 are embedded in soft diffuse emission with diameters of and , respectively. NGC 4579 shows soft diffuse emission with a similar morphology to the circumnuclear star forming ring, in addition to a very bright nucleus (see also Eracleous et al. 2002). NGC 4565 shows extended emission along the galactic plane. NGC 5866 has soft extended emission (2 kpc) in diameter and no X-ray nucleus is detected (Table 2). Any diffuse emission associated with the other galaxies is much fainter.
4 X-ray Spectra
Spectral fits were performed for the relatively bright objects — those with 40 detected counts in the 0.5–8 keV band. The spectrum of one fainter object (NGC 4548) showing a large (=hard) hardness ratio was also fitted. Some objects are so bright that pileup effects are significant. Column 7 of Table 1 gives the count rates per CCD read-out frame time and can be used to estimate the significance of pileup. In the two objects NGC 3147 and NGC 4278, the pileup is mild and we corrected for the effect by applying the pileup model implemented in XSPEC, where the grade morphing parameter was fixed at 0.5 (after initially treating it as a free parameter [Davis 2001] since is not well constrained). The pileup effect for the three objects with the largest count rate per frame (NGC 4203, NGC 4579, and NGC 5033) is serious and we did not attempt detailed spectral fits. Instead, we use the spectra and fluxes measured with ASCA for these three objects (Terashima et al. 2002b and references therein) in the following discussions. We confirmed that the nuclear X-ray source dominates the hard X-ray emission within the beam size of ASCA (see Appendix). The other objects in the sample are faint enough to ignore the effects of pileup.
X-ray spectra were extracted from a circular region with a radius between 4 pixels (2.0′′; for faint sources) and 10 pixels (4.9′′; for bright sources) depending on source brightness. Background was estimated using an annular region centered on the target. A maximum-likelihood method using the C-statistic (Cash 1979) was employed in the spectral fits. In the fit with the C-statistic, background cannot be subtracted, so we added a background model (measured from the background region)


with fixed parameters to the spectral models, after normalizing by the ratio of the geometrical areas of the source and background regions. The errors quoted represent the 90% confidence level for one parameter of interest (=2.7).
A power-law model modified by absorption was applied and acceptable fits were obtained in all cases (Fig. 2). The best-fit parameters for the nuclear sources are given in Table 4. The observed fluxes and luminosities (the latter corrected for absorption) in the 2–10 keV band are shown in Table 2. The results for a few bright off-nuclear sources are presented in the Appendix. The photon indices of the nuclear sources are generally consistent with the typical values observed in LLAGNs (photon index , e.g., Terashima et al. 2002a, 2002b), although errors are quite large due to the limited photon statistics. The spectral slope of NGC 6500 () is somewhat steeper than is typical of LLAGNs. This may indicate that there is soft X-ray emission from a source other than the AGN and/or the intrinsic slope of the AGN is steep. One galaxy (NGC 3169, a LINER 2) has a large absorption column (= cm-2), while two galaxies (NGC 4548, a LINER 2, and NGC 3226, a LINER 1.9) show substantial absorption ( cm-2, and cm-2, respectively). Others have small column densities which are consistent with ‘type 1’ AGNs. No meaningful limit on the equivalent width of an Fe K line was obtained for any of the objects because of limited photon statistics in the hard X-ray band.
One object — NGC 2787 — has only 8 detected photons in the 0.5–8 keV band and is too faint to obtain spectral information. A photon index of 2.0 and the Galactic absorption of cm-2 were assumed to calculate the flux and luminosity which are shown in Table 2.
5 Discussion
5.1 Power Source of LINERs
An X-ray nucleus is detected in all the objects except for NGC 4550 and NGC 5866. We test whether the detected X-ray sources are the high energy extension of the continuum source which powers the optical emission lines by examining the luminosity ratio /. The H luminosities () were taken from Ho et al. (1997a) and the reddening was estimated from the Balmer decrement for narrow lines and corrected using the reddening curve of Cardelli, Clayton, & Mathis (1989), assuming the intrinsic H/H flux ratio = 3.1. The X-ray luminosities (corrected for absorption) in the keV band are used.
The H luminosities and logarithm of the luminosity ratios / are shown in Table 5. The / ratios of most objects are in the range of AGNs ( / 1–2) and in good agreement with the strong correlation between and for LLAGNs, luminous Seyferts, and quasars presented in Terashima et al. (2000a) and Ho et al. (2001). This indicates that their optical emission lines are predominantly powered by a LLAGN. Note that this correlation is not an artifact of distance effects, as shown in Terashima et al. (2000a).
The four objects NGC 2787, NGC 4550, NGC 5866, and NGC 6500, however, have much lower / ratios ( / 0) than expected from the correlation ( / ), and their X-ray luminosities are insufficient to power the H emission (Terashima et al. 2000a). This X-ray faintness could indicate one or more of several possibilities such as (1) an AGN is the power source, but is heavily absorbed at energies above 2 keV, (2) an AGN is the power source, but is currently switched-off or in a faint state, and (3) the optical narrow emission lines are powered by some source(s) other than an AGN. We briefly discuss these three possibilities in turn.
If an AGN is present in these X-ray faint objects and absorbed in the hard energy band above 2 keV, only scattered and/or highly absorbed X-rays would be observed, and then the intrinsic luminosity would be much higher than that observed. This can account for the low / ratios and high radio to X-ray luminosity ratios ((5 GHz)/; Table 5 and section 5.3). If the intrinsic X-ray luminosities are about one or two orders of magnitude higher than those observed, as is often inferred for Seyfert 2 galaxies (Turner et al. 1997, Awaki et al. 2000), / and (5 GHz)/ become typical of LLAGNs.
Alternatively, the AGN might be turned off or in a faint state, with a higher activity in the past being inferred from the optical emission lines, whose emitting region is far from the nucleus (e.g., Eracleous et al. 1995). Also, the radio observations were made a few years before the Chandra ones. This scenario might thus explain their relatively low / ratios and their relatively high / ratios. If this is the case, the size of the radio core can be used to constrain the era of the active phase in the recent past. The upper limits on the size of the core estimated from the beam size ( 2.5 mas) are 0.16, 0.19, and 0.48 pc for NGC 2787, NGC 5866, and NGC 6500, respectively (Falcke et al. 2000). Therefore, the AGN must have been active until 0.52, 0.60, and 1.6 years, respectively, before the VLBA observations (made in 1997 June) and inactive at the epochs (2000 Jan – 2002 Jan, see Table 1) of the X-ray observations. This is an ad hoc proposal and such abrupt declines of activity are quite unusual, but it cannot be completely excluded.
It may also be possible that the ionized gas inferred from the optical emission lines is ionized by some sources other than an AGN, such as hot stars. If the observed X-rays reflect the intrinsic luminosities of the AGN, a problem with the AGN scenario for the three objects NGC 2787, NGC 5866, and NGC 6500 is that these galaxies have very large (5 GHz)/ ratios, and would thus be among the radio loudest LLAGNs. The presence of hot stars in the nuclear region of NGC 6500 is suggested by UV spectroscopy (Maoz et al. 1998). Maoz et al. (1998) studied the energy budget for NGC 6500 by using the H and UV luminosity at 1300 A and showed that the observed UV luminosity is insufficient to power the H luminosity even if a stellar population with the Salpeter initial mass function and a high mass cutoff of 120 are assumed. This result indicates that a power source in addition to hot stars must contribute significantly, and supports the obscured AGN interpretation discussed above.
The first possibility, i.e., an obscured low-luminosity AGN as the source of the X-ray emission, seems preferable for NGC 2787, NGC 5866 and NGC 6500, although some other source(s) may contribute to the optical emission lines. Additional lines of evidence which support the presence of an AGN include the fact that all three of these galaxies (NGC 2787, NGC 5866, and NGC 6500) have VLBI-detected, sub-pc scale, nuclear radio core sources (Falcke et al. 2000), a broad H component (in NGC 2787, and an ambiguous detection in NGC 5866; Ho et al. 1997b), a variable radio core in NGC 2787, and a jet-like linear structure in a high-resolution radio map of NGC 6500 with the VLBA (Falcke et al. 2000). Only an upper limit to the X-ray flux is obtained for NGC 5866. If an X-ray nucleus is present in this galaxy and its luminosity is only slightly below the upper limit, this source could be an AGN obscured by a column density cm-2 or larger. If the apparent X-ray luminosity of the nucleus of NGC 5866 is much lower than the observed upper limit, and the intrinsic X-ray luminosity conforms to the typical / ratio for LLAGN ( / ), then the X-ray source must be almost completely obscured. The optical classification (transition object) suggests the presence of an ionizing source other than an AGN, so the low observed / ratio could alternatively be a result of enhanced H emission powered by this other ionizing source.
The X-ray results presented above show that the presence of a flat (or inverted) spectrum compact radio core is a very good indicator of the presence of an AGN even if its luminosity is very low. On the other hand, NGC 4550, which does not possess a radio core, shows no evidence for the presence of an AGN and all the three possibilities discussed above are viable. If the ROSAT detection is real (Halderson et al. 2001), the time variability between the ROSAT and Chandra fluxes may indicate the presence of an AGN (see Appendix).
It is notable that type 2 LINERs without a flat spectrum compact radio core may be heterogeneous in nature. For instance, some LINER 2s without a compact radio core (e.g., NGC 404 and transition 2 object NGC 4569) are most probably driven by stellar processes (Maoz et al. 1998; Terashima et al. 2000b; Eracleous et al. 2002).
5.2 Obscured LLAGNs
In our sample, we found at least three highly absorbed LLAGNs (NGC 3169, NGC 3226, and NGC 4548). In addition, if the X-ray faint objects discussed in section 5.1 are indeed AGNs, they are most probably highly absorbed with cm-2. Among these absorbed objects, NGC 2787 is classified as a LINER 1.9, NGC 3169, NGC 4548, and NGC 6500 as LINER 2s, and NGC 5866 as a transition 2 object. Thus, heavily absorbed LINER 2s, of which few are known, are found in the present observations demonstrating that radio selection is a valuable technique for finding obscured AGNs. Along with heavily obscured LLAGNs known in low-luminosity Seyfert 2s (e.g., NGC 2273, NGC 2655, NGC 3079, NGC 4941, and NGC 5194; Terashima et al. 2002a), our observations show that at least some type 2 LLAGNs are simply low-luminosity counterparts of luminous Seyferts in which heavy absorption is often observed (e.g., Risaliti, Maiolino, & Salvati 1999). However, some LINER 2s (e.g., NGC 4594, Terashima et al. 2002a; NGC 4374, Finoguenov & Jones 2001; NGC 4486, Wilson & Yang 2002) and low-luminosity Seyfert 2s (NGC 3147; section 4 and Appendix) show no strong absorption. Therefore, the orientation-dependent unified scheme (e.g., Antonucci 1993) does not always apply to AGNs in the low-luminosity regime, as suggested by Terashima et al. (2002a).
5.3 Radio Loudness of LLAGNs
Combination of X-ray and radio observations is valuable for investigating a number of areas of AGN physics, including the “radio loudness”, the origin of jets, and the structure of accretion disks. Low-luminosity AGNs (LINERs and low-luminosity Seyfert galaxies) are thought to be radiating at very low Eddington ratios (/) and may possess an advection-dominated accretion flow (ADAF; see e.g., Quataert 2002 for a recent review). A study of radio loudness in LLAGNs can constrain the jet production efficiency by an ADAF-type disk. Earlier studies have suggested that LLAGNs tend to be radio loud compared to more luminous Seyferts based on the spectral energy distributions of seven LLAGNs (Ho 1999) and, for a larger sample, on the conventional definition of radio loudness (5 GHz)/(B) (the subscript “O”, which stands for optical, is usually omitted but we use it here to distinguish from — see below), with being radio loud (Kellermann et al. 1989, 1994; Visnovsky et al. 1992; Stocke et al. 1992; Ho & Peng 2001). Ho & Peng (2001) measured the luminosities of the nuclei by spatial analysis of optical images obtained with HST to reduce the contribution from stellar light. A caveat in the use of optical measurements for the definition of radio loudness is extinction, which will lead to an overestimate of if not properly allowed for. Although Ho & Peng (2001) used only type 1–1.9 objects, some objects of these types show high absorption columns in their X-ray spectra. In this subsection, we study radio loudness by comparing radio and hard X-ray luminosities. Since the unabsorbed luminosity for objects with cm-2 can be reliably measured in the 2–10 keV band, which is accessible to ASCA, XMM-Newton, and Chandra, and such columns correspond to 50 mag, it is clear that replacement of optical by hard X-ray luminosity potentially yields considerable advantages. In addition, the high spatial resolutions of XMM-Newton and especially Chandra usually allow the nuclear X-ray emission to be identified unambiguously, while the optical emission of LLAGN can be confused by surrounding starlight.
In the following analysis, radio data at 5 GHz taken from the literature are used since fluxes at this frequency are widely available for various classes of objects. We used primarily radio luminosities obtained with the VLA at resolution for the present sample. High resolution VLA data at 5 GHz are not available for several objects. For four such cases, VLBA observations at 5 GHz with 150 mas resolution are published in the literature (Falcke et al. 2000) and are used here. For two objects, we estimated 5 GHz fluxes from 15 GHz data by assuming a spectral slope of (cf. Nagar et al. 2001). The radio luminosities used in the following analysis are summarized in Table 5. Since our sample is selected based on the presence of a compact radio core, the sample could be biased to more radio loud objects. Therefore, we constructed a larger sample by adding objects taken from the literature for which 5 GHz radio, 2–10 keV X-ray, and measurements are available.
First, we introduce the ratio (5 GHz)/ as a measure of radio loudness and compare the ratio with the conventional parameter. The X-ray luminosity in the 2–10 keV band (source rest frame), corrected for absorption, is used 111Monochromatic X-ray luminosities can also be used to define the radio loudness instead of luminosities in the 2–10 keV band; such a definition would be analogous to , which utilizes monochromatic B-band luminosities. This alternative provides completely identical results if the X-ray spectral shape is known and the range of spectral slopes is not large. For example, the conversion factor (2 keV)/ is 0.31, 0.26, and 0.22 keV-1 for photon indices of 2, 1.8, and 1.6, respectively, and no absorption.. We examine the behavior of using samples of AGN over a wide range of luminosity, including LLAGN, the Seyfert sample of Ho & Peng (2001) and PG quasars which are also used in their analysis. parameters and radio luminosities were taken from Ho & Peng (2001) for the Seyferts and Kellermann et al. (1989) for the PG sample. The values of in Kellermann et al. (1989) have been recalculated by using only the core component of the radio luminosities. The optical and radio luminosities of the PG quasars were calculated assuming and (). The X-ray luminosities (mostly measured with ASCA) were compiled from Terashima et al. (2002b), Weaver, Gelbord, & Yaqoob (2001), George et al. (2000), Reeves & Turner (2000), Iwasawa et al. (1997, 2000), Sambruna, Eracleous, & Mushotzky (1999), Nandra et al. (1997), Smith & Done (1996), and Cappi et al. (1996). Note that only a few objects (NGC 4565, NGC 4579, and NGC 5033) in our radio selected sample have reliable measurements of nuclear (B).
Fig. 3. compares the parameters and for the Seyferts and PG sample. These two parameters correlate well for most Seyferts. Some Seyferts have higher values than indicated by most Seyferts. This could be a result of extinction in the optical band. Seyferts showing X-ray spectra absorbed by a column greater than cm-2 (NGC 2639, 4151, 4258, 4388, 4395, 5252, and 5674) are shown as open circles in Fig. 3. At least four of them have a value of larger than indicated by the correlation. The correlation between and for the less absorbed Seyferts can be described as = 0.88 + 5.0. According to this relation, the boundary between radio loud and radio quiet object ( = 1) corresponds to . The values of and for a few obscured Seyferts are consistent with the correlation, indicating that optical extinction is not perfectly correlated with the absorption column density inferred from X-ray spectra.
The PG quasars show systematically lower values than those of Seyferts at a given . For the former objects, corresponds to . This apparently reflects a luminosity dependence of the shape of the SED: luminous objects have steeper optical-X-ray slopes (; e.g., Elvis et al. 1994, Brandt, Laor, & Wills 2000), where is often measured as the spectral index between 2200 A and 2 keV, while less luminous AGNs have (Ho 1999). This is related to the fact that luminous objects show a more prominent “big blue bump” in their spectra. Fig. 8 of Ho (1999) demonstrates that low-luminosity objects are typically 1–1.5 orders of magnitude fainter in the optical band than luminous quasars for an given X-ray luminosity. Note that none of the PG quasars used here shows a high absorption column in its X-ray spectrum below 10 keV.
The definition of radio loudness using the hard X-ray flux () appears to be more robust than that using the optical flux because X-rays are less affected by both extinction at optical wavelengths and the detailed shape of the blue bump, as noted above. Further, measurements of nuclear X-ray fluxes of Seyferts and LLAGNs with Chandra are easier than measurements of nuclear optical fluxes, since in the latter case the nuclear light must be separated from the surrounding starlight, a difficult process for LLAGNs.
Fig. 4 shows the X-ray luminosity dependence of . In this plot, the LLAGN sample discussed in the present paper is


shown in addition to the Seyfert and PG samples used above. This is an “X-ray version” of the - plot (Fig. 4 in Ho & Peng 2001). Radio galaxies taken from Sambruna et al. (1999) are also added and we use radio luminosities from the core only. Our plot shows that a large fraction (%) of LLAGNs ( ergs s-1) are “radio loud”. This is a confirmation of Ho & Peng’s (2001) finding. Note, however, that our sample is not complete in any sense, and this radio-loud fraction should be measured using a more complete sample. Since radio emission in LLAGNs is likely to be dominated by emission from jets (Nagar et al. 2001; Ulvestad & Ho 2001), these results suggest that, in LLAGN, the fraction of the accretion energy that powers a jet, as opposed to electromagnetic radiation, is larger than in more luminous Seyfert galaxies and quasars. Since LLAGNs are thought to have an ADAF-type accretion flow, such might indicate that an ADAF can produce jets more efficiently than the geometrically thin disk believed present in more luminous Seyferts.
The three LLAGNs with the largest in Fig. 4 are the three X-ray faint objects discussed in section 5.1 (NGC 2787, NGC 5866, and NGC 6500) and which are most probably obscured AGNs. If their intrinsic X-ray luminosities are 1–2 orders of magnitude higher than those observed, their values of become smaller by this factor and are then in the range of other LLAGNs. Even if we exclude these three LLAGNs, the radio loudness of LLAGNs is distributed over a wide range: the radio-loudest LLAGNs have values similar to radio galaxies and radio-loud quasars, while some LLAGNs are as radio quiet as radio-quiet quasars.
A comparison with blazars is of interest to compare our sample with objects for which the nuclear emission is known to be dominated by a relativistic jet and thus strongly beamed. The average for high-energy peaked BL Lac objects (HBLs), low-energy peaked BL Lac objects (LBLs), and flat spectrum radio quasars (FSRQs) are –3.10, –1.27, and –0.95, respectively, where we used the average radio and X-ray luminosities for a large sample of blazars given in Table 3 of Donato et al. (2001). The average for HBLs is similar to that for LLAGNs in our sample, while the latter two classes are about two orders of magnitude more radio loud than LLAGNs. Although LLAGNs and HBLs have similar values of , the spectral slope in the X-ray band is different: LLAGNs have a photon index in the range 1.7–2.0 (see also Terashima et al. 2002), while HBLs usually show steeper spectra (photon index 2, e.g., Fig. 1 in Donato et al. 2001), and the X-ray emission is believed to be dominated by synchrotron radiation. Furthermore, blazars with a lower bolometric luminosity tend to have a synchrotron peak at a higher frequency and a steeper X-ray spectral slope than higher bolometric luminosity blazars (Donato et al. 2001).
We also constructed an - plot (Fig. 5) using the total radio luminosities of the radio source (i.e. including the core, jets, lobes, and hot spots, if present). The radio data were compiled from Véron-Cetty & Véron (2001), Kellermann et al. (1989), and Sambruna et al. (1999). The PG sample and other quasars are shown with different symbols. This plot appears similar to Fig. 4 for LLAGNs, Seyferts, and radio-quiet quasars since these objects do not possess powerful jets or lobes and off-nuclear radio emission associated with the AGN is generally of low luminosity (Ulvestad & Wilson 1989, Nagar et al. 2001, Ho & Ulvestad 2001, Kellermann et al. 1989). On the other hand, radio galaxies have powerful extended radio emission and consequently the values calculated using the total radio luminosities become higher than if only nuclear luminosities are used. We used the same X-ray luminosities as in Fig. 4, because jets, lobes, and hot spots are almost always much weaker than the nucleus in X-rays. In fact, in our observations of LLAGNs, we found no extended emission directly related to the AGN. Thus, the differences between Fig. 4 and Fig. 5 result from the extended radio emission.
6 Summary
Fourteen galaxies with a nuclear radio source having a flat or inverted spectrum have been observed with Chandra with a typical exposure time of 2 ksec. An X-ray nucleus is detected in all but one object (NGC 5866). 11 galaxies have X-ray and H luminosities in good accord with the correlation known for AGNs over a wide range of luminosity, which indicates that these objects are AGNs and that the AGN is the dominant power source of their optical emission lines. Their X-ray luminosities are between and ergs s-1. The three objects NGC 2787, NGC 5866, and NGC 6500 have significantly lower X-ray luminosities than expected from the - correlation. Various observations suggest that these objects are most likely to be heavily obscured AGNs. These observational results show that radio and hard X-ray observations provide an efficient way to find LLAGN in nearby galaxies, even if the nuclei are heavily obscured.
One object (the LINER 2 NGC 4550), which does not show a radio core, was also observed for comparison. No X-ray nucleus is detected. If the X-ray source detected in this galaxy with ROSAT is indeed the nucleus, the nucleus must be variable in X-rays, which would indicate the presence of an AGN.
We have used the ratio (5 GHz)/ as a measure of radio loudness and found that a large fraction of LLAGNs are radio loud. This confirms earlier results based on nuclear luminosities in the optical band, but our results based on hard X-ray measurements are much less affected by obscuration and the detailed shape of the “big blue bump”. We speculate that the increase in as decreases below ergs s-1 may result from the presence of an advection-dominated accretion flow in the inner part of the accretion flow in low-luminosity objects. However, the steep X-ray spectra in our sample of LLAGNs rule out high temperature thermal bremsstrahlung as the X-ray emission mechanism.
Appendix A Notes on Individual Objects
In this Appendix, we compare our results with previously published results particularly in the hard X-ray band obtained with ASCA and Chandra. The optical spectroscopic classification is given in parentheses after the object name.
NGC 2787 (L1.9). — A result on the same data set is presented in Ho et al. (2001). Our detected number of counts is in good agreement with their result.
NGC 3147 (S2). — This object was observed with ASCA in 1993 September and the observed flux was ergs s-1cm-2 in the 2–10 keV band (Ptak et al. 1996, 1999; Terashima et al. 2002b). Our Chandra image is dominated by the nucleus and shows that the off-nuclear source contribution within the ASCA beam is negligible. Therefore, a comparison between the observed Chandra flux ( ergs s-1cm-2), which is 2.3 times larger than that of ASCA, implies time variability providing additional evidence for the presence of an AGN.
In the ASCA spectrum, a strong Fe-K emission line is detected at keV (source rest frame) with an equivalent width of eV. One interpretation of this relatively large equivalent width is that the nucleus is obscured by a large column density and the observed X-rays are scattered emission (Ptak et al. 1996). However, the luminosity ratios / and / suggest small obscuration (Terashima et al. 2002b).
The observed variability supports the interpretation that the X-ray emission is not scattered emission from a heavily obscured nucleus. This galaxy is an example of a Seyfert 2 with only little absorption in the X-ray band.
NGC 3226 (L1.9). — This galaxy was observed with the Chandra HETG in 1999 December (George et al. 2001). They obtained an intrinsic luminosity of ( ergs s-1, 68% confidence limit) in the 2–10 keV band after conversion to a distance of 23.4 Mpc. This luminosity is consistent with our value of ( ergs s-1, 90% confidence range) after correction for absorption.
NGC 4203 (L1.9). — A result on the same data set is presented in Ho et al. (2001). The nucleus of this object has a large X-ray flux and pileup is severe in this observation. A bright source is seen 2′ SE of the nucleus which was also separated from the nucleus with ASCA SIS observations (Iyomoto et al. 1998; Terashima et al. 2002b). The Chandra observations show that there is no source confusing the ASCA observation of the nucleus. Therefore, we used an ASCA flux in the discussions.
NGC 4278 (L1.9). — A result on the same data set is presented by Ho et al. (2001).
We analyzed archival ASCA data observed on 1998 May 24. The effective exposure times after standard data screening were 19.6 ksec for each SIS and 23.9 ksec for each GIS. The ASCA spectrum is well fitted with a power law with a photon index 1.85 (1.771.94). The best-fit absorption column is =0, with an upper limit of cm-2. The observed flux in the 210 keV band is ergs s-1cm-2.
Our Chandra image in the hard energy band is dominated by the nucleus and no bright source is seen in the field. Therefore, the hard X-ray measurement with ASCA seems reliable. The Chandra flux in the 2–10 keV band ( ergs s-1cm-2) is about one-third of the ASCA flux indicating variability.
NGC 4550 (L2). — This source is not detected with the present Chandra observation. A detection with the ROSAT PSPC is reported by Halderson et al. (2001). The observed ROSAT flux in the 0.1–2.4 keV band is ergs s-1 cm-2. This ROSAT source is offset from the optical nucleus by 10′′. If this source is indeed the nucleus, our non detection by Chandra ( ergs s-1 cm-2) indicates time variability.
NGC 4565 (S1.9). — The nuclear region is dominated by two sources: the nucleus and an off-nuclear source which is brighter than the nucleus. The observed Chandra fluxes of these two source in the 2–10 keV band ( and ergs s-1cm-2) are slightly lower than those obtained with ASCA ( and ergs s-1cm-2; Mizuno et al. 1999; Terashima et al. 2002b), respectively. These differences appear not to be significant given the statistical, calibration, and spectral-modeling uncertainties. (The uncertainties on the Chandra fluxes are dominated by the statistical errors, which are % for the off-nuclear source and 50% for the nucleus, while the error in the ASCA fluxes is dominated by calibration uncertainties of %.)
The Chandra spectrum of the off-nuclear source can be fitted by an absorbed power law model with a photon index of and = cm-2. A multicolor disk blackbody model also provides a good fit with best-fit parameters keV and = cm-2.
NGC 4579 (L1.9/S1.9). — A result on the same data set is presented by Ho et al. (2001). The nucleus is significantly piled up in the Chandra observation. The Chandra hard band image is dominated by the nucleus and no bright source is seen in the field. Therefore, we used ASCA fluxes observed in 1995 and 1998. Detailed ASCA results are published in Terashima et al. (1998, 2000c).
A long (33.9 ksec exposure) Chandra observation performed in 2000 May is presented in Eracleous et al. (2002). The 2–10 keV flux reported is ergs s-1cm-2 which is similar to that of the second ASCA observation in 1998 ( ergs s-1cm-2).
NGC 5033 (S1.5). — A result on the same data set is presented in Ho et al. (2001). The nucleus is significantly piled up in the Chandra observation. The five off-nuclear sources shown in Table 3 are located within the ASCA beam. The sum of the counts from these sources is less than 44 counts in the 2–8 keV band, while 380 counts are detected from the nucleus before correction for pileup. Therefore, the ASCA flux ( ergs s-1cm-2; Terashima et al. 1999, 2002b) is probably larger than the true nuclear flux by % or less, unless the off-nuclear sources show drastic time variability. We used the ASCA flux without any correction for the off-nuclear source contribution. The 10% uncertainty does not affect any of the conclusions.
We performed a spectral fit to the brightest off-nuclear source (CXOU J131329.7+363523). An absorbed power law model was applied, and = 0.40 (1.2) cm-2 and a photon index were obtained.
NGC 5866 (T2). — Extended emission of diameter 30′′ (2 kpc) is seen. The spectrum of this emission may be represented by a MEKAL plasma model with 1 keV and abundance of 0.15 solar. This component could be identified with a gaseous halo of this S0 galaxy.
References
- (1) Antonucci, R. 1993, ARA&A, 31, 473
- (2) Awaki, H., Ueno, S., Taniguchi, Y., & Weaver, K. A. 2000, ApJ, 542, 175
- (3) Brandt, W. N., Laor, A., & Wills, B. J. 2000, ApJ, 528, 637
- (4) Cardelli, J. A., Clayton, G. C., & Mathis, J. S. 1989, ApJ, 345, 245
- (5) Cappi, M., Mihara, T., Matsuoka, M., Brinkmann, W., Prieto, M. A., & Palumbo, G. G. C. 1996, ApJ, 456, 141
- (6) Cash, W. 1979, ApJ, 228, 939
- (7) Davis, J. E. 2001, ApJ, 562, 575
- (8) Elvis, M., et al. 1994, ApJS, 95, 1
- (9) Eracleous, M., Livio, M., & Binette, L. 1995, ApJ, 445, L1
- (10) Eracleous, M., Shields, J. C., Chartas, G., & Moran, E. C. 2002, ApJ, 565, 108
- (11) Falcke, H., Nagar, N. M., Wilson, A. S., & Ulvestad, J. S. 2000, ApJ, 542, 197
- (12) Falcke, H., Lehár, J., Barvainis, R., Nagar, N. M., & Wilson, A. S. 2001, Probing the Physics of Active Galactic Nuclei by Multiwavelength Monitoring, Eds. B. M. Peterson, R. W. Pogge, & R. S. Polidan, ASP conf. series 224, p.265, (ASP: San Francisco)
- (13) Finoguenov, A. & Jones, C. 2001, ApJ, 547, L107
- (14) George, I. M., et al. 2000, ApJ, 531, 52
- (15) George, I. M., et al. 2001, ApJ, 559, 167
- (16) Halderson, E. L., Moran, E. C., Filippenko, A. V., & Ho, L. C., 2001, AJ, 122, 637
- (17) Heckman, T. M. 1980, A&A, 87, 152
- (18) Ho, L. C. 1999, ApJ, 516, 672
- (19) Ho, L. C., et al. 2001, ApJ, 549, L51
- (20) Ho, L. C., Filippenko, A. V., & Sargent, W. L. W. 1997a, ApJS, 112, 315
- (21) Ho, L. C., Filippenko, A. V., Sargent, W. L. W., & Peng, C. Y. 1997b, ApJS, 112, 391
- (22) Ho, L. C., & Peng, C. Y. 2001, ApJ, 555, 650
- (23) Ho, L. C., & Ulvestad, J. S. 2001, ApJS, 133, 77
- (24) Iwasawa, K., Fabian, A. C., Ueno, S., Awaki, H., Fukazawa, Y., Matsushita, K., & Makishima, K. 1997, MNRAS, 285, 683
- (25) Iwasawa, K., Fabian, A. C., Almaini, O., Lira, P., Lawrence, A., Hayashida, K., & Inoue, H. 2000, MNRAS, 318, 879
- (26) Iyomoto, N., Makishima, K., Matsushita, K., Fukazawa, Y., Tashiro, M., & Ohashi, T. 1998, ApJ, 503, 168
- (27) Kellermann, K. I., Sramek, R., Schmidt, M., Shaffer, D. B., & Green, R. 1989, AJ, 98, 1195
- (28) Kellermann, K. I., Sramek, R. A., Schmidt, M., Green, R. F., & Shaffer, D. B. 1994, AJ, 108, 1163
- (29) Kraft, R. P., Burrows, D. N., & Nousek, J. A. 1991, ApJ, 374, 344
- (30) Kukula, M. J., Pedlar, A., Baum, S. A., & O’Dea, C. P. 1995, MNRAS, 276, 1262
- (31) Maoz, D., Koratkar, A., Shields, J. C., Ho, L. C., Filippenko, A. V., & Sternberg, A. 1998, AJ, 116, 55
- (32) Mizuno, T., Ohnishi, T., Kubota, A., Makishima, K., & Tashiro, M. 1999, PASJ, 51, 663
- (33) Morganti, R., Tsvetanov, Z. I., Gallimore, J., & Allen, M. G. 1999, A&AS, 137, 457
- (34) Nagar, N. M., Wilson, A. S., Mulchaey, J. S., & Gallimore, J. F. 1999, ApJS, 120, 209
- (35) Nagar, N. M., Falcke, H., Wilson, A. S., & Ho, L. C. 2000, ApJ, 542, 186
- (36) Nagar, N. M., Falcke, H., Wilson, A. S., & Ulvestad, J. S. 2002, A&A, submitted
- (37) Nagar, N. M., Wilson, A. S., & Falcke, H. 2001, ApJ, 559, L87
- (38) Nandra, K., George, I. M., Mushotzky, R. F., Turner, T. J., & Yaqoob, T. 1997, ApJ, 477, 602
- (39) Pérez-Olea, D. E., & Colina, L. 1996, ApJ, 468, 191
- (40) Ptak, A., Serlemitsos, P. J., Yaqoob, T., & Mushotzky, R. F. 1999, ApJS, 120, 179
- (41) Ptak, A., Yaqoob, T., Serlemitsos, P.J., Kunieda, H., & Terashima, Y. 1996, ApJ, 459, 542
- (42) Quataert, E. 2002, “Probing the Physics of Active Galactic Nuclei”, eds. B. M. Peterson, R. W. Pogge, and R. S. Polidan, (San Francisco: Astronomical Society of the Pacific), ASP Conference Proceedings, Vol. 224, p.71
- (43) Reeves, J. N., & Turner, M. J. L. 2000, MNRAS, 316, 234
- (44) Risaliti, G., Maiolino, R., & Salvati, M. 1999, ApJ, 522, 157
- (45) Roy, A. L., Norris, R. P., Kesteven, M. J., Troup, E. R., & Reynolds, J. E. 1994, ApJ, 432, 496
- (46) Sambruna, R. M., Eracleous, M., & Mushotzky, R. F. 1999, ApJ, 526, 60
- (47) Schmitt, H. R., Ulvestad, J. S., Antonucci, R. R. J., & Kinney, A. L. 2001, ApJS, 132, 199
- (48) Smith, D. A., & Done, C. 1996, MNRAS, 280, 355
- (49) Stocke, J. T., Morris, S. L., Weymann, R. J., Foltz, C. B. 1992, ApJ, 396, 487
- (50) Terashima, Y., Ho, L. C., Iyomoto, N., & Ptak, A. F. 2002a, ApJ, in preparation
- (51) Terashima, Y., Ho, L .C., & Ptak, A. F. 2000a, ApJ, 539, 161
- (52) Terashima, Y., Ho, L .C., Ptak, A. F., Mushotzky, R. F., Serlemitsos, P. J., Yaqoob, T., & Kunieda, H. 2000b, ApJ, 533, 729
- (53) Terashima, Y., Ho, L .C., Ptak, A. F., Yaqoob, T., Kunieda, H., Misaki, K., & Serlemitsos, P. J. 2000c, ApJ, 535, L79
- (54) Terashima, Y., Iyomoto, N., Ho, L. C., & Ptak, A. F. 2002b, ApJS, 139, 1
- (55) Terashima, Y., Kunieda, H., & Misaki, K. 1999, PASJ, 51, 277
- (56) Thean, A., Pedlar, A., Kukula, M. J., Baum, S. A., & O’Dea, C. P. 2000, MNRAS, 314, 573
- (57) Tully, R. B. 1988, Nearby Galaxies Catalog (Cambridge: Cambridge Univ. Press)
- (58) Turner, M. J., et al. 2001, A&A, 365, L110
- (59) Turner, T. J., George, I. M., Nandra, K., & Mushotzky, R. M. 1997, ApJS, 113, 23
- (60) Ulvestad, J. S., & Ho, L. C. 2001, ApJ, 562, L133
- (61) Ulvestad, J. S., & Wilson, A. S. 1989, ApJ, 343, 659
- (62) Véron-Cetty, M.-P. & Véron, P. 2001, “A Catalogue of Quasars and Active Nucleus (10th edition)”, available at http://www.obs–hp.fr/www/calogues/veron2–10/veron2–10.html
- (63) Vogler, A., Pietsch, W., & Kahabka, P. 1996, A&A, 305, 74
- (64) Weaver, K. A., Gelbord, J., & Yaqoob, T. 2001, ApJ, 550, 261
- (65) Wilson, A. S. & Yang, Y 2002, ApJ, 568, 133
| Name | Class | Date | Exposure | Count rate | Notes | ||
|---|---|---|---|---|---|---|---|
| (Mpc) | (s) | (s-1) | (frame-1) | ||||
| (1) | (2) | (3) | (4) | (5) | (6) | (7) | (8) |
| NGC 266 | 62.4 | L1.9 | 2001 Jun 1 | 2033 | 0.020 | 0.0080 | a |
| NGC 2787 | 13.3 | L1.9 | 2000 Jan 7 | 1050 | 0.0075 | 0.024 | c |
| NGC 3147 | 40.9 | S2 | 2001 Sep 19 | 2202 | 0.54 | 0.21 | a |
| NGC 3169 | 19.7 | L2 | 2001 May 2 | 1953 | 0.081 | 0.033 | a |
| NGC 3226 | 23.4 | L1.9 | 2001 Mar 23 | 2228 | 0.094 | 0.038 | a |
| NGC 4143 | 17.0 | L1.9 | 2001 Mar 26 | 2514 | 0.063 | 0.025 | a |
| NGC 4203 | 9.7 | L1.9 | 1999 Nov 4 | 1754 | 0.17 | 0.54 | c |
| NGC 4278 | 9.7 | L1.9 | 2000 Apr 20 | 1396 | 0.18 | 0.33 | b |
| NGC 4548 | 16.8 | L2 | 2001 Mar 24 | 2746 | 0.0097 | 0.0039 | a |
| NGC 4550 | 16.8 | L2 | 2001 Mar 24 | 1885 | … | … | a |
| NGC 4565 | 9.7 | S1.9 | 2000 Jun 30 | 2828 | 0.045 | 0.081 | b |
| NGC 4579 | 16.8 | L1.9/S1.9 | 2000 Feb 23 | 2672 | 1.1 | 0.47 | a |
| NGC 5033 | 18.7 | S1.5 | 2000 Apr 28 | 2904 | 0.33 | 0.59 | b |
| NGC 5866 | 15.3 | T2 | 2002 Jan 10 | 2247 | … | … | a |
| NGC 6500 | 39.7 | L2 | 2000 Aug 1 | 2104 | 0.020 | 0.064 | c |
| Name | RA | Dec. | Counts | Hard/Soft | Flux | Luminosity | Notes | ||
|---|---|---|---|---|---|---|---|---|---|
| (J2000) | (J2000) | (0.5–8 keV) | (0.5-2 keV) | (2-8 keV) | Band ratio | (2–10 keV) | (2–10 keV) | ||
| (1) | (2) | (3) | (4) | (5) | (6) | (7) | (8) | (9) | (10) |
| NGC 266 | 0 49 47.81 | 32 16 40.0 | 40.76.4 | 29.85.5 | 10.93.3 | 0.370.13 | 1.6 | 7.5 | a |
| NGC 2787 | 9 19 18.70 | 69 12 11.3 | 7.92.8 | 12.0 | 6.4 | … | 0.25 | 0.053 | b |
| NGC 3147 | 10 16 53.75 | 73 24 02.8 | 1180.134.4 | 843.429.1 | 333.518.3 | 0.400.03 | 37 | 76 | a,c |
| NGC 3169 | 10 14 15.05 | 03 27 57.9 | 159.012.6 | 11.8 | 151.012.3 | 12.9 | 24 | 26 | a |
| 26 | 22 | a,d | |||||||
| NGC 3226 | 10 23 27.01 | 19 53 55.0 | 209.314.5 | 125.211.2 | 80.59.0 | 0.640.09 | 7.6 | 5.5 | a |
| NGC 4143 | 12 9 36.07 | 42 32 03.0 | 157.412.6 | 121.311.1 | 32.65.7 | 0.270.05 | 3.1 | 1.1 | a |
| NGC 4203 | 12 15 05.02 | 33 11 49.9 | 294.317.2 | 198.714.1 | 91.79.6 | 0.460.06 | … | … | e |
| NGC 4278 | 12 20 06.80 | 29 16 51.6 | 255.616.4 | 209.614.9 | 52.07.4 | 0.250.04 | 8.1 | 0.91 | a,c |
| NGC 4548 | 12 35 26.46 | 14 29 46.7 | 26.65.2 | 8.73.0 | 17.74.2 | 2.020.85 | 1.6 | 0.61 | a |
| NGC 4550 | … | … | … | ||||||
| NGC 4565 | 12 36 20.78 | 25 59 15.7 | 127.311.3 | 92.59.6 | 34.95.9 | 0.380.08 | 3.2 | 0.36 | a |
| NGC 4579 | 12 37 43.52 | 11 49 05.4 | 3067.955.6 | 2240.547.7 | 812.328.5 | 0.360.01 | … | … | e |
| NGC 5033 | 13 13 27.47 | 36 35 38.1 | 946.530.9 | 562.123.8 | 380.219.5 | 0.680.05 | … | … | e |
| NGC 5866 | … | … | … | b | |||||
| NGC 6500 | 17 55 59.78 | 18 20 18.0 | 42.46.6 | 41.56.5 | 7.6 | 0.18 | 0.28 | 0.55 | a |
| 0.69 | 1.3 | a,d |
| Name | RA | Dec. | CXOU Name | Counts | Hard/Soft | Flux | Luminosity | Notes | ||
|---|---|---|---|---|---|---|---|---|---|---|
| (J2000) | (J2000) | (0.5–8 keV) | (0.5-2 keV) | (2-8 keV) | Band ratio | (2–10 keV) | (2–10 keV) | |||
| (1) | (2) | (3) | (4) | (5) | (6) | (7) | (8) | (9) | (10) | (11) |
| NGC 2787 | 9 19 23.05 | 69 14 24.4 | J091923.1+691424 | 21.04.6 | 17.94.2 | 8.0 | 0.44 | 0.68 | … | a,b |
| NGC 3147 | 10 16 51.50 | 73 24 08.9 | J101651.5+732409 | 6.72.6 | 6.8 | 9.2 | … | 0.10 | 0.20 | b |
| NGC 3169 | 10 14 14.35 | 03 28 10.8 | J101414.3+032811 | 6.92.6 | 6.92.6 | 3.0 | 0.43 | 0.11 | 0.051 | b |
| 10 14 17.90 | 03 28 55.2 | J101417.9+032855 | 10.93.3 | 8.02.8 | 9.4 | 1.18 | 0.18 | 0.084 | b | |
| NGC 3226 | 10 23 26.69 | 19 54 06.8 | J102326.7+195407 | 8.93.0 | 7.92.8 | 4.7 | 0.59 | 0.13 | 0.085 | b |
| NGC 4203 | 12 15 09.20 | 33 09 54.7 | J121509.2+330955 | 240.115.5 | 196.414.0 | 40.86.4 | 0.210.04 | … | … | a,c, TON 1480 |
| 12 15 14.33 | 33 11 04.7 | J121514.3+331105 | 11.93.5 | 6.3 | 9.94.3 | 1.57 | 2.0 | … | a,d J121514.3+331105, g | |
| 12 15 15.34 | 33 13 54.0 | J121515.3+331354 | 6.02.4 | 6.02.4 | 3.0 | 0.50 | 0.10 | … | a,b | |
| 12 15 15.64 | 33 10 12.3 | J121515.6+331012 | 16.95.2 | 14.95.0 | 6.3 | 0.42 | 0.30 | … | a,b, star | |
| 12 15 19.84 | 33 10 12.2 | J121519.8+331012 | 15.94.0 | 10.93.3 | 4.7 | 0.43 | 0.29 | … | a,b | |
| NGC 4550 | 12 35 21.30 | 12 14 04.5 | J123521.3+121405 | 6.02.4 | 5.92.4 | 3.0 | 0.50 | 0.10 | … | a,b |
| 12 35 27.76 | 12 13 38.9 | J123527.8+121339 | 35.86.0 | 26.65.2 | 8.02.8 | 0.300.12 | 1.1 | 11000 | a,d, QSO 1232+125, h | |
| NGC 4565 | 12 36 14.65 | 26 00 52.5 | J123614.7+260052 | 14.95.0 | 8.94.1 | 6.03.6 | 0.670.51 | 0.76 | 0.086 | d, A30, i |
| 12 36 17.40 | 25 58 55.5 | J123617.4+255856 | 269.516.4 | 209.714.5 | 59.97.7 | 0.290.04 | 5.8 | 0.67 | e, f, A32, i | |
| 12 36 18.64 | 25 59 34.6 | J123618.6+255935 | 8.83.0 | 13.5 | 6.2 | … | 0.098 | 0.011 | b | |
| 12 36 19.02 | 25 59 31.5 | J123619.0+255932 | 6.92.6 | 10.7 | 6.2 | … | 0.077 | 0.009 | b | |
| 12 36 19.03 | 26 00 27.0 | J123619.0+260027 | 19.94.5 | 18.04.2 | 6.4 | 0.36 | 0.22 | 0.025 | b, A33, i | |
| 12 36 20.92 | 25 59 26.7 | J123620.9+255927 | 5.92.4 | 10.6 | 4.7 | … | 0.065 | 0.007 | b | |
| 12 36 27.39 | 25 57 32.7 | J123627.4+255733 | 15.94.0 | 14.93.9 | 4.8 | 0.32 | 0.18 | 0.020 | b,A37?, i | |
| 12 36 28.12 | 26 00 00.9 | J123628.1+260001 | 12.93.6 | 11.03.3 | 6.4 | 0.58 | 0.14 | … | a,b | |
| 12 36 31.28 | 25 59 36.9 | J123631.3+255937 | 12.04.6 | 18.9 | 4.8 | … | 0.13 | … | a,b, A43?, i | |
| NGC 5033 | 13 13 24.78 | 36 35 03.7 | J131324.8+363504 | 13.93.7 | 10.03.2 | 9.4 | 0.94 | 0.15 | 0.063 | b |
| 13 13 28.88 | 36 35 41.0 | J131328.9+363541 | 6.72.6 | 10.2 | 6.3 | … | 0.072 | 0.030 | b | |
| 13 13 29.46 | 36 35 17.3 | J131329.5+363517 | 34.65.9 | 31.75.7 | 7.9 | 0.25 | 0.37 | 0.16 | b | |
| 13 13 29.66 | 36 35 23.1 | J131329.7+363523 | 47.76.9 | 31.85.7 | 15.95.1 | 0.500.18 | 2.0 | 0.89 | f | |
| 13 13 35.56 | 36 34 04.4 | J131335.6+363404 | 7.02.6 | 6.02.4 | 4.8 | 0.80 | 0.075 | 0.031 | b | |
| NGC 6500 | 17 56 01.59 | 18 20 22.6 | J175601.6+182023 | 7.02.6 | 10.4 | 6.2 | … | 0.12 | 0.23 | b |
Note. — Col. (1): Galaxy Name. Col. (2): Adopted distance taken from Tully (1988). Col. (3): Spectral class of the nucleus taken from Ho et al. (1997a), where L = LINER, S = Seyfert, T = transition objects (LINER/H II), 1 = type 1, 2 = type 2, and a fractional number between 1 and 2 denotes various intermediate types. Col. (4): Observation start date. Col. (5): Exposure time. Col. (6): Count rate in the 0.5–8 keV band in units of counts s-1 (not corrected for pile up). Col. (7): Count rate in the 0.5–8 keV band in units of counts per frame readout (not corrected for pile up). Col. (8): Notes (a) 1/8 chip subarray mode used. (b) 1/2 chip subarray mode used. (c) full chip mode used.
Note. — Col. (1): Galaxy Name. Cols. (2–3): X-ray position (units of right ascension are hours, minutes, and seconds, and units of declination are degrees, arcminutes, and arcseconds). Cols. (4–6): Source counts in 0.5–8 keV, 0.5–2 keV, and 2–8 keV, respectively, not corrected for pile up. Errors are 1. Col. (7): Hard/Soft band ratio. Errors are 1. Col. (8): Flux in the 2–10 keV band in units of ergs s-1 cm-2 not corrected for absorption. Col. (9): Luminosity in the 2–10 keV band in units of ergs s-1 corrected for absorption. Col. (10): Notes. (a) Flux and luminosity measured by spectral fits presented in Table 4. (b) Photon index = 2 and the Galactic absorption are assumed to calculate the flux and luminosity. (c) Flux and luminosity corrected for slight pileup effect. (d) Photon index = 2 is assumed to calculate the flux and luminosity. (e) Significantly piled up.
Note. — Col. (1): Galaxy Name. Cols. (2–3): X-ray position (units of right ascension are hours, minutes, and seconds, and units of declination are degrees, arcminutes, and arcseconds). Col. (4): CXO source name. Cols. (5–7): Source counts in 0.5–8 keV, 0.5–2 keV, and 2–8 keV, respectively, not corrected for pile up. Errors are 1. Col. (8): Hard/Soft band ratio. Errors are 1. Col. (9): Flux in the 2–10 keV band in units of ergs s-1 cm-2 not corrected for absorption. Col. (10): Luminosity in the 2–10 keV band in units ergs s-1 corrected for absorption, where the source is assumed to be within the host galaxy. Col. (11): Notes and possible identifications. (a) Spatially outside the host galaxy. (b) Flux and luminosity measured by assuming a photon index of 2 and the Galactic absorption. (c) Significantly piled up. (d) Flux and luminosity measured by assuming the Galactic absorption and power law spectra, with photon indices determined from the band ratio. (e) Flux and luminosity corrected for slight pileup effect. (f) Flux and luminosity measured by spectral fits. (g) Radio counterpart given in Ho & Ulvestad (2001). (h) Luminosity calculated by assuming , =75 km s-1 Mpc-1, and =0.5. (i) ROSAT source presented in Vogler, Pietsch, & Kahabka (1996)
| Name | C-statistic (dof) | Notes | ||
|---|---|---|---|---|
| ( cm-2) | ||||
| NGC 266 | 10.6 (6) | |||
| NGC 3147 | 45.4 (41) | a | ||
| NGC 3169 | 21.3 (26) | |||
| NGC 3226 | 8.1 (12) | |||
| NGC 4143 | 12.2 (11) | |||
| NGC 4278 | 16.9 (18) | a | ||
| NGC 4548 | 3.7 (5) | |||
| NGC 4565 | 1.6 (4) | |||
| NGC 6500 | 8.5 (8) |
| Name | / | (5 GHz) | (5 GHz)/ | Notes | |
|---|---|---|---|---|---|
| (erg s-1) | (erg s-1) | ||||
| (1) | (2) | (3) | (4) | (5) | |
| NGC 266 | 39.36 | 1.52 | 37.87 | 3.00 | a |
| NGC 2787 | 38.56 | 0.16 | 37.22 | 1.50 | b |
| NGC 3147 | 40.02 | 1.86 | 38.01 | 3.87 | c |
| NGC 3169 | 39.52 | 1.82 | 37.19 | 4.16 | a |
| NGC 3226 | 38.93 | 1.81 | 37.20 | 3.54 | a |
| NGC 4143 | 38.69 | 1.34 | 37.16 | 2.87 | b |
| NGC 4203 | 38.35 | 2.02 | 36.79 | 3.59 | b, e |
| NGC 4278 | 39.20 | 0.76 | 37.91 | 2.05 | b |
| NGC 4548 | 38.48 | 1.31 | 36.31 | 3.48 | d |
| NGC 4550 | 38.50 | 0.09 | 36.07 | 2.34 | d |
| NGC 4565 | 38.46 | 1.10 | 36.15 | 3.41 | b |
| NGC 4579 | 39.48 | 1.82 | 37.65 | 3.59 | b, e |
| NGC 5033 | 39.70 | 1.67 | 36.79 | 4.57 | c, e |
| NGC 5866 | 38.82 | 0.56 | 36.89 | 1.18 | b |
| NGC 6500 | 40.48 | 0.37 | 38.90 | 1.21 | a |