Hot Molecular Gas in the Galactic Center
Abstract
Using the new 23 GHz receivers at the Very Large Array (VLA), we have detected NH3(6,6) emission ( GHz) from hot ( K) molecular clouds in the central 10 pc of the Galaxy. This is the first successful detection of NH3(6,6) with the VLA. The brightest emission comes from a region interior to the “circumnuclear disk” (CND), less than 1.5 pc in projected distance from Sgr A*. This region does not show molecular emission from lower energy transitions such as NH3(1,1) and (2,2), HCN(1-0) and HCO+(1-0). Line ratios of NH3(6,6) and (3,3) emission as well as NH3(6,6) line widths have peak values within 1.5 pc of Sgr A*, indicating that the gas is physically close to the nucleus. NH3(6,6) is also detected towards many features outside the CND observed in NH3(1,1), (2,2), and (3,3). These features tend to lie along ridges of gas associated with Sgr A East or the massive “molecular ridge” that connects the “20 km s-1” and “50 km s-1” giant molecular clouds (GMCs). {comment} Every feature we detect has a NH3(6,6) line width of at least 20 km s-1, significantly greater than the average value for cool molecular material in the inner 10 pc.
1 Introduction
At a distance of only kpc (Reid, 1993), the Galactic center provides a unique opportunity to study in detail the environment around a supermassive black hole. It is now generally accepted that a black hole of is located at the dynamical center of the Galaxy (Eckart & Genzel, 1997; Ghez et al., 1998). In the radio, emission from just outside the black hole is observed as the strong ( Jy) source, Sgr A*. Sgr A* is surrounded by arcs of ionized gas (Sgr A West) that appear to be feeding the nucleus (Lo & Claussen, 1983; Roberts & Goss, 1993). These arcs are, in turn, surrounded by an apparent “ring” of molecular material called the circumnuclear disk (CND, Güsten et al. (1987)). {comment} Observations of HCN(1-0) and HCO+(1-0) suggest that the CND is most likely composed of at least three distinct clouds in orbit about the nucleus (Wright et al., 2001).
Sgr A West and the CND are located in front of or just inside the front edge of the expanding supernova remnant (SNR), Sgr A East (Pedlar et al., 1989). The expansion of Sgr A East appears to be moving large amounts of material away from the nucleus, forming ridges of material on all sides (Genzel et al. 1990; Ho et al. 1991; Serabyn, Lacy, & Achtermann 1992; Zylka et al. 1999; McGary, Coil, & Ho 2001, hereafter MCH). However, some material may move towards the nucleus after being disrupted by the passing front and three filamentary “streamers” possibly feeding the nucleus have been detected in NH3 (Okumura et al. 1989; Ho et al. 1991; Coil & Ho 1999, 2000; MCH).
The metastable (J=K) NH3(J,K) rotation inversion transitions at GHz have proven to be useful probes of dense (104–105 cm-3) molecular material near the Galactic center. They tend to have a low optical depth and a high excitation temperature at the Galactic center, making them almost impervious to absorption effects. Satellite hyperfine lines separated by 10–30 km s-1 on either side of the main line enable a direct calculation of the optical depth of the NH3 emission and line ratios of different transitions can be used to calculate the rotational temperature, , of the gas.
Measurements of elevated temperatures may suggest mechanical heating through shocks between clouds or radiative heating by photons from the central stellar cluster as the gas approaches the nucleus.
We recently observed NH3(1,1), (2,2) and (3,3) emission from the central 10 pc of the Galaxy. {comment} and find NH3(3,3) to be the brightest tracer (MCH). NH3(3,3) has an energy of 125 K above ground, compared to 23 K and 65 K for NH3(1,1) and (2,2), respectively. The abundance of NH3(3,3) and high NH3(2,2) to (1,1) line ratios indicate that the turbulent environment near the Galactic center has produced molecular gas with high (Coil & Ho 1999, 2000; MCH). An important result from these studies is the apparent increase in line width and as gas approaches the nucleus (MCH; McGary & Ho in press). However, the reality of this effect has remained in doubt because the emission also becomes fainter near Sgr A*. We suspected that even the NH3(3,3) line becomes less sensitive to the extreme environment near Sgr A* and observed the central 4′ (10 pc) of the Galaxy in NH3(6,6), at 412 K above ground, using the new 23 GHz receivers at the Very Large Array111The National Radio Astronomy Observatory is a facility of the National Science Foundation operated under cooperative agreement by Associated Universities, Inc. (VLA) in order to detect the hottest molecular gas. These data represent the first successful observations of NH3(6,6) with the VLA. NH3(6,6) is detected in many of the features seen in lower NH3 transitions, but the velocity integrated map is dominated by emission less than 1.5 pc (40′′) in projected distance from the nucleus. Line ratios and extremely broad line widths (50–90 km s-1) indicate this molecular gas is physically close to the supermassive black hole. The remaining features lie predominantly along the edge of Sgr A East and have line widths greater than 20 km s-1 indicating interaction with the shell.
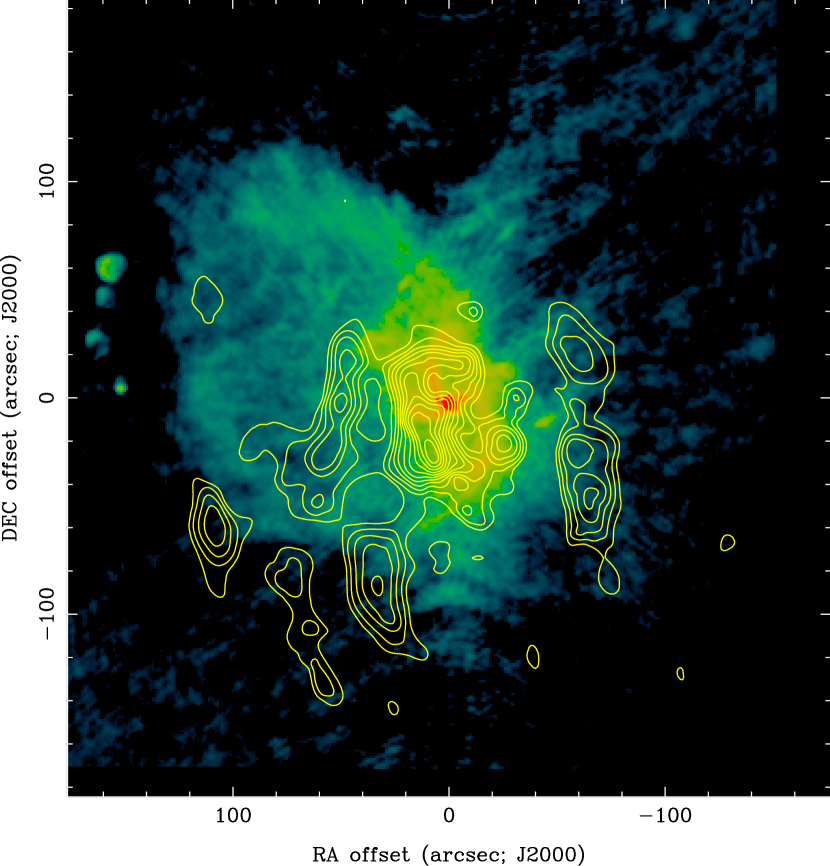
NH3(6,6) velocity integrated emission in contours overlaid on 6 cm continuum emission in color (Yusef-Zadeh & Morris, 1987). Contours are in steps of 3 where 1 Jy beam-1 km s-1.
2 Observations
Observations of NH3(6,6) were made with the VLA in the D north-C array on 2001 October 1 and November 16 and have an identical setup and spatial coverage to our previous NH3(1,1), (2,2), and (3,3) observations so that comparisons between images are straightforward (MCH). A five-pointing mosaic centered on Sgr A* (, ) fully samples the central 4′ (10 pc) of the Galaxy and a velocity coverage of km s-1 with a resolution of km s-1 includes most of the velocities observed near the nucleus (the features at –185 km s-1 observed by Zhao, Goss, & Ho (1995) are not covered). The data have been calibrated and images made using the same method as MCH. The final beam size after application of a Gaussian taper (FWHM=) to the data is with a PA of .
Observations at GHz have only recently become possible after the upgrade of the 23 GHz receivers at the VLA. {comment} Our previous attempts to observe this line so close to the edge of the old receiver band resulted in the failure of the local oscillator to lock for many of the receivers and degraded performance with system temperatures of many hundred Kelvins. At the time of our observations, 16 antennas were fitted with new receivers. At the low declination of Sgr A*, the new receivers have K, which is comparable to the noise at 23 GHz with the old receivers. Data are weighted by so that old receivers do not increase the noise. One hour of integration time was obtained for each pointing resulting in an rms noise per channel of mJy beam-1. For the velocity integrated image, the noise level is 0.23 Jy beam-1 km s-1 and is calculated in the same way as MCH assuming line emission typically appears in seven channels. {comment} As discussed in MCH, this underestimates the signal-to-noise for narrow-line features by a factor of where is the number of channels contain line emission greater than .
3 Results
Figure 1 shows velocity integrated NH3(6,6) emission in contours overlaid on a pseudo-color 6 cm continuum image (Yusef-Zadeh & Morris, 1987). The point source Sgr A* (, ) is the brightest feature in the 6 cm image. The arcs of Sgr A West can be seen in yellow and the large expanding shell, Sgr A East, is seen in blue. The contours for NH3(6,6) are in steps of . Figure 2 shows the velocity integrated map with labeled positions for twelve spectra shown to the right. The spectra have been Hanning smoothed to a resolution of km s-1. Spectrum L shows the noise at a position with no velocity integrated emission. Note the presence of many separate features at the position of Sgr A* (spectrum A). These features are due to separate clouds, and not satellite hyperfine lines which are only km s-1 from the main line. With the exception of the 70 km s-1 feature, the emission is not coincident with the velocities of known clouds in the region, nor do we expect line-of-sight (LOS) absorption associated with this high . For spectra B–K, the best fit to a Gaussian is overlaid and the line width (defined as the FWHM) in km s-1 is labeled in the upper right-hand corner of each panel. The NH3 (6,6) line widths are high throughout the central 10 pc. The typical line width for cool molecular gas at the Galactic center is km s-1(Armstrong & Barrett 1985; MCH), but none of the NH3(6,6) features has a line width of less than 20 km s-1, despite our sensitivity to FWHM km s-1.
The NH3 (6,6) line widths are high, even for the Galactic center region. The typical line width for cool molecular gas at the Galactic center is km s-1(Armstrong & Barrett 1985; MCH), but none of the NH3(6,6) features has a line width of less than 20 km s-1, despite our sensitivity to FWHM km s-1. The large line widths associated with NH3(6,6) emission indicate that the physical processes that produce the warm gas must also result in broadened line profiles.
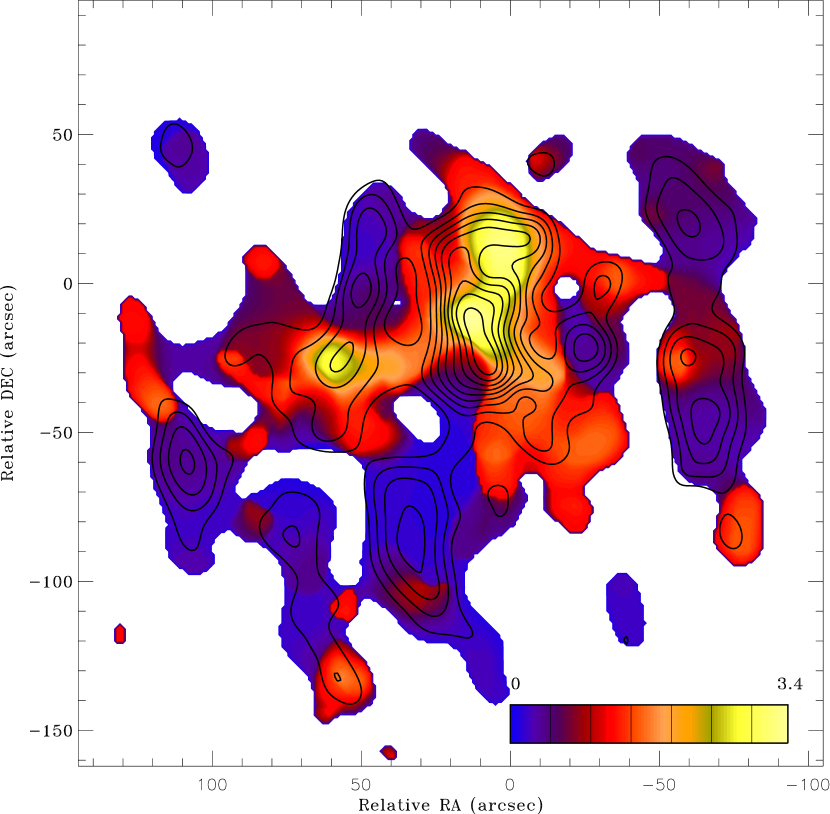
Finally, we show the line ratio of NH3(6,6) to (3,3) emission in color in Figure 3. To match the resolution of the NH3(3,3) image, the NH3(6,6) image was remade using a Gaussian taper resulting in resolution and mJy beam-1, which is equal to the noise in the (3,3) image, (MCH). The velocity channel corresponding to peak NH3(6,6) emission is used to measure both the (6,6) and (3,3) flux densities which are then used to calculate the line ratios. Only pixels with NH3(6,6) flux density greater than are included. For those pixels where NH3(3,3) emission is less than , the ratio of (6,6) emission to is used as a lower limit for the line ratio. Contours of the velocity integrated NH3(6,6) emission are overlaid for reference.
If NH3(6,6) and (3,3) are in thermal equilibrium, the line ratio gives an estimate of the rotational temperature of the gas. {comment} The line ratios are as high as 3.4 in the central 10 pc, but on average are closer to 1.0. From Townes & Schalow (1975), is related to the opacity of the NH3(3,3) main line and the ratio of NH3(6,6) and (3,3) antenna temperatures by
| (1) |
if equal beam filling factors are assumed. {comment} For optically thin gas, the rotational temperatures associated with line ratios of 0.5, 1.0, and 1.5 are 186, 340, and 658 K. For line ratios less than 1.0, the assumption that implies that the derived temperature is an upper limit. However, for line ratios greater than 1.0, the derived temperature is a lower limit (Ho & Townes, 1983). The exponential dependence of on the line ratio reduces the accuracy of the estimation for K. This is a significant improvement on NH3(2,2) to (1,1) line ratios which only give accurate estimations for K. The rotational temperature is thought to be a good indicator of kinetic temperature, , and we assume gives a lower limit for (Martin, Ho, & Ruf, 1982).
Line ratios greater than 2.3 are seen in Figure 3, but they give . These large line ratios may the the result of a larger filling factor for NH3(6,6), or the dynamic range of the NH3(3,3) data may be limited by nearby bright emission (MCH). It is unlikely that the gas is out of thermal equilibrium because the equilibration time is only s. Line widths are quite large in the region (50 – 80 km s-1) making it unlikely for the NH3(6,6) population to be inverted. The large line widths also make absorption of NH3(3,3) by an un-associated, cool foreground cloud unlikely. If the NH3(6,6) originates in a radiatively heated cloud, then it is possible that the NH3(3,3) is absorbed by cooler material in the same cloud that has been shielded from the radiation. The NH3(6,6) would be unaffected by absorption because the cooler gas would contain almost no NH3(6,6). For clouds near the nucleus, the radiation involved would most likely originate in the central stellar clusters and those clouds with line ratios would be located in front of the nucleus along the LOS.
3.1 The central 1.5 parsecs
The NH3(6,6) velocity integrated map is dominated by emission less than 1.5 pc (40′′) from Sgr A*, interior to the CND (spectra B, C, & D). Indications of molecular gas inside the CND have also been observed in NH3(3,3), but the emission was much fainter than surrounding features (MCH). Observations of 63 m emission from [Oi] with a resolution of indicate a central concentration of neutral gas interior to the CND, possibly associated with the arcs of Sgr A West (Jackson et al., 1993). The distribution of the NH3(6,6) does not mimic the shape of Sgr A West, and the line profiles do not show the high velocities associated with the ionized arcs and [Oi] emission (Jackson et al., 1993; Roberts & Goss, 1993).
The NH3(6,6) emission appears to be kinematically independent of material in the CND. To the north of Sgr A* (spectra B and C), the gas has a velocity of km s-1, but HCN(1-0) and HCO+(1-0) emission from nearby parts of the CND have velocities of km s-1 (Wright et al., 2001). To the southeast of Sgr A* (spectrum D) emission is coincident with a gap in the CND and possible origins for this cloud are discussed at the end of this section. Spectrum E has a velocity of –20 km s-1 in NH3(6,6) compared to –5 km s-1 in NH3(3,3). HCN(1-0) and HCO+(1-0) spectra at this position are affected by absorption and central velocities cannot be determined, but emission from the nearby southern lobe of the CND is centered at km s-1 (Wright et al., 2001). The NH3(6,6) line has a relatively small line width (48 km s-1) and low line ratio (0.3) compared to spectra B, C, and D and we assume this feature is not located in the central parsec.
The large line widths of 75–85 km s-1 in the central 1.5 pc (spectra B, C, and D) indicate that this gas is physically close to the nucleus. The line profiles are similar to those from the CND for other molecules (e.g. Wright et al. (2001)) and are well-fitted by Gaussians. The smooth profiles make turbulence an unlikely broadening mechanism. Observations of the expansion of SNRs into molecular material show that the resulting line profiles are often best fit by a combination of dissociative J-type and non-dissociative C-type shocks (Wang & Scoville, 1992; van Dishoeck, Jansen, & Phillips, 1993). If the material is traveling perpendicular to the LOS, the combination of the two shocks results in a symmetrically broadened profile (van Dishoeck, Jansen, & Phillips, 1993). Thus an expanding shock front perpendicular to our LOS may explain the large observed line widths.
The NH3(6,6) to (3,3) line ratios are very high for spectra B, C, and D and many of the features in the central 1.5 pc exceed the upper limit for the line ratio of 2.3. A direct calculation of is not possible, but the trends in Figure 3 indicate that gas near the nucleus is hot and we assume a warm kinetic temperature of 500 K. For an approximate mass estimate, we assume an optical depth of 0.1 and (Serabyn & Güsten, 1986) and find cm-2 for B, C, and D, and a total gas mass in the central 2 pc on the order of . This mass is similar to those calculated by (Coil & Ho, 1999, 2000) for cooler molecular clouds in the central 10 pc. The estimated virial mass is for a cloud of radius 15′′ and line width 80 km s-1(MacLaren, Richardson, & Wolfendale, 1988). Thus, it is safe to assume that these clouds are not gravitationally bound.
However, these broad line widths do imply that the gas is physically close to the nucleus. Figure 3 shows that the NH3(6,6) to (3,3) line ratio also peaks very close to Sgr A*. The average line ratio in the central parsec is 1.9, corresponding to K for optically thin gas. This is well below the NH3 dissociation energy of 4.3 eV (Å) (Herzberg, 1966). However, much gas in the central parsec has a line ratio greater than 2.3, which gives an infinite rotational temperature. We must assume that non-thermal processes including shocks dominate close to the nucleus.
In lower transitions of NH3, there is evidence for a connection of the “20 km s-1” GMC to the nucleus along the “southern streamer” (, ) (Ho et al., 1991; Coil & Ho, 1999, 2000). The gas appears to become warmer and line widths broaden as the southern streamer approaches the nucleus. However, the emission disappears within 2 pc of the nucleus. We detect significant NH3(6,6) to the southeast of Sgr A*, coincident with the “gap” in the CND seen in HCN(1-0) and HCO+(1-0) (Wright et al., 2001). This gas has a velocity of 40 km s-1and appears to be kinematically connected to the southern streamer (spectrum I). The large line ratios and broadened line widths (up to 80 km s-1) indicate that it may trace the continuation of the southern streamer towards the nucleus. The velocity is less than the escape velocity for a distance of 2 pc, but ambiguities in projected distance and velocity make it impossible to claim that it is definitely bound by the nucleus.
3.2 Features outside the CND
The “western streamer” is offset to the west of Sgr A* along the edge of Sgr A East (coincident with spectra G & H). It is known to have high ratios of NH3(2,2) to (1,1) emission (MCH) as well as large line widths (McGary & Ho, in press). In NH3(6,6), line widths range between 30 and 50 km s-1. The line ratios in the western streamer have an average value of 0.66 indicating K if the gas is optically thin. The velocity gradient of 25 km s-1 pc-1 observed in NH3 by MCH accounts for the line velocities of +30 km s-1 in spectrum G and –30 km s-1in spectrum H. The gradient is easily explained by a long filament highly inclined to the the LOS and moving out with the expanding shell. The impact of the shell perpendicular to the LOS could again explain the broad line widths in this feature.
The molecular ridge that connects the “20 km s-1” GMC in the south to the “50 km s-1” GMC in the east (Ho et al. 1991; Dent et al. 1993; Coil & Ho 1999; 2000, MCH) is composed of the southern part of the southern streamer, SE1 (, ), and SE2 (, ) (spectra I, J, & K, respectively). Emission from the molecular ridge has a typical velocity of 35 km s-1, line width of 25 km s-1, and an average line ratio of 0.41 (170 K), making it relatively cool compared to other features in our map. However, the line widths are roughly 10 km s-1 larger than that associated with the nearby, cold GMCs. The concave southeastern edge of Sgr A East seen in the 6 cm image is thought to result from an impact with SNR G359.92–0.09 (centered at , , (Coil & Ho, 2000)) and it is possible that the shocks from this collision have produced increased temperatures and densities (Coil & Ho, 2000). There is a lack of NH3(6,6) emission on the northeast edge of Sgr A East where it is impacting the massive, but relatively quiescent, “50 km s-1” GMC. The high density of this GMC may result in a faster cooling rate in this feature, limiting the production of NH3(6,6).
Within the outer edge of the Sgr A East shell is a well-known north-south ridge of continuum radio emission to the east of Sgr A* (coincident with spectrum F), roughly along the eastern edge of Sgr A West (Pedlar et al., 1989). Although the northern end of the ridge is coincident with the eastern edge of the CND, NH3(3,3) observations indicate that the 50 km s-1 gas is most likely an extension of SE1 (MCH). The NH3(6,6) line width along this ridge ranges from 40–60 km s-1 and has an average line ratio of 1.0 corresponding to K. The line ratio peaks in the south where there is a lack of emission from HCN (Wright et al., 2001). The similarity of the western streamer and this eastern ridge as well as the asymmetric line profile (spectrum F) indicates that it likely lies on the expanding front of Sgr A East (Pedlar et al., 1989).
4 Summary
With 25 GHz observations now practical at the VLA, NH3(6,6) is an excellent tracer of hot, dense molecular material. Velocity integrated NH3(6,6) images are dominated by emission less than 1.5 pc in projected distance from Sgr A*. High line ratios and line widths indicate that this molecular material is likely close to the supermassive black hole and is interior to the CND. In addition, the hottest emission to the southeast of Sgr A* appears to connect the southern streamer to the nucleus. The remaining NH3(6,6) emission tends to lie along the ridges that surround the Sgr A East shell, tracing features that show a high line width in earlier NH3(1,1), (2,2), and (3,3) data.
References
- Armstrong & Barrett (1985) Armstrong, J.T. & Barrett, A.H. 1985, ApJS, 57, 535
- Coil & Ho (1999) Coil, A.L. & Ho, P.T.P. 1999, ApJ, 513, 752
- Coil & Ho (2000) Coil, A.L. & Ho, P.T.P. 2000, ApJ, 533, 245
- Dent et al. (1993) Dent, W.R.F, Matthews, H.E., Wade, R. , & Duncan, W.D. 1993, ApJ, 410, 650
- Eckart & Genzel (1997) Eckart, A. & Genzel, R. 1997, MNRAS, 284, 576
- Genzel et al. (1990) Genzel, R., Stacey, G.J., Harris, A.I., Geis, N., Graf, U.U., Poglitsch, A. , & Sutzki, J. 1990, ApJ, 356, 160
- Ghez et al. (1998) Ghez, A.M., Klein, B.L., Morris, M. , & Becklin, E.E. 1998, ApJ, 509, 678
- Güsten et al. (1987) Güsten, R., Genzel, R., Wright, M.C.H., Jaffe, D.T., Stutzki, J. , & Harris, A.I. 1987, ApJ, 318, 124
- Herzberg (1966) Herzberg, G. 1966, Molecular Spectra and Molecular Structure (New York: Van Nostrand Reinhold Co.)
- Ho et al. (1991) Ho, P.T.P., Ho, L.C., Szczepanski, J.C., Jackson, J.M., Armstrong, J.T. , & Barrett, A.H. 1991, Nature, 350, 309
- Ho & Townes (1983) Ho, P.T.P. & Townes, C.H. 1983, ARA&A, 21, 239
- Jackson et al. (1993) Jackson, J.M., Geins, N., Genzel, R., Harris, A.I., Madden, S., Poglitsch, A., Stacey, G.J., & Townes, C.H. 1993, ApJ, 402, 173
- Lo & Claussen (1983) Lo, K.Y. & Claussen, M.J. 1983, Nature, 306, 647
- MacLaren, Richardson, & Wolfendale (1988) MacLaran, I., Richardson, K.M., & Wolfendale, A.W. 1988, ApJ, 333, 821
- Marshall et al. (1995) Marshall, J., Lasenby, A.N. , & Harris, A.I. 1995, MNRAS, 277, 594
- Martin, Ho, & Ruf (1982) Martin, R.N., Ho, P.T.P., & Ruf, K. 1982, Nature, 296, 632
- McGary, Coil, & Ho (2001) McGary, R.S., Coil, A.L., & Ho, P.T.P. 2001, ApJ, 559, 326 (MCH)
- McGary & Ho (in press) McGary, R.S. & Ho, P.T.P. 2002, ApJ, in press (astro-ph/0206077)
- Mezger et al. (1989) Mezger, P.G., Zylka, R. Salter, C.J., Wink, J.E., Chini, R. Kreysa, E. , & Tuffs, R. 1989, A&A, 209, 337
- Okumura et al. (1989) Okumura, S.K., et al. 1989, ApJ, 347, 240
- Pedlar et al. (1989) Pedlar, A., Anantharamaiah, K.R., Ekers, R.D., Goss, W.M., van Gorkom, J.H., Schwarz, U.J., & Zhao, J.-H. 1989, ApJ, 342, 769
- Reid (1993) Reid, M.J. 1993, ARA&A, 31, 345
- Roberts & Goss (1993) Roberts, D.A. & Goss, W.M. 1993, ApJS, 86, 133
- Serabyn & Güsten (1986) Serabyn, E. & Güsten, R. 1986, A&A, 161, 334
- Serabyn, Lacy, & Achtermann (1992) Serabyn, E., Lacy, J.H. , & Achermann, J.M. 1992, ApJ, 395, 166
- Townes & Schalow (1975) Townes, C.H. & Schalow, A.L. 1975, Microwave Spectroscopy, New York:Dover
- van Dishoeck, Jansen, & Phillips (1993) van Dishoeck, E.F., Jansen, D.J., & Phillips, T.G. 1993, A&A, 279, 541
- Wang & Scoville (1992) Wang, Z. & Scoville, N.Z. 1992, ApJ, 386, 158
- Wright et al. (2001) Wright, M.C.H.W., Coil, A.L., McGary, R.S., Ho, P.T.P. , & Harris, A.I. 2001, ApJ, 551, 254
- Yusef-Zadeh & Morris (1987) Yusef-Zadeh, F. & Morris, M. 1987, ApJ, 320, 545
- Zhao, Goss, & Ho (1995) Zhao, J.-H., Goss, W.M., & Ho, P.T.P. 1995, ApJ, 450, 122
- Zylka et al. (1999) Zylka, R., Güsten, R., Philipp, S., Ungerechts, H., Mezger, P.G. , & Duschl, W.J. 1999, in ASP Conf. Ser, 186, The Central Parsecs of the Galaxy, ed. H. Falcke et al. (San Francisco: ASP), 415