The Afterglow of GRB 010222: A Case of Continuous Energy Injection11affiliation: Based on observations made with the Nordic Optical Telescope, operated on the island of La Palma jointly by Denmark, Finland, Iceland, Norway, and Sweden, in the Spanish Observatorio del Roque de los Muchachos of the Instituto de Astrofisica de Canarias.
Abstract
The optical lightcurve of GRB 010222 exhibited one of the slowest decays of any gamma-ray burst to date. Its broadband properties have been difficult to explain with conventional afterglow models, as they either require the power law index of the underlying electron energy distribution to be low, , or that the outflow is quasi-spherical thus reviving the energy problem. We argue that the slow decay of GRB 010222 and a linear polarization of %, is naturally explained by a jet model with continuous energy injection. The electron energy distribution then has , fully consistent with the expectation from detailed modelling of acceleration in relativistic shocks, that , thus alleviating the “-problem”.
1 Introduction
GRB 010222 was a bright gamma-ray burst (GRB) localized by BeppoSAX
(Piro et al., 2001). X-ray observations were reported
by in ’t Zand et al. (2001). The optical afterglow
was discovered by Henden & Vrba henden01 (2001), 4.3 hours after the
burst and a redshift of was determined by Jha et al. jha01 (2001).
Further optical/near-infrared observations have been reported by
Stanek et al. stanek01 (2001), Lee et al. lee01 (2001),
Masetti et al. masetti01 (2001), Cowsik et al. (2001),
Sagar et al. sagar01 (2001) and Mirabal et al. (2002).
In our analysis we shall adopt
the light curve fit of Henden et al. (2002), that is based
on data extending up to 80 days after the burst. Their best fit in the
-band gives a pre-break power-law slope of
and a post-break slope of , with a break time
of days. The observed optical spectral index is
about (e.g. Stanek et al. 2001), but as it may be
strongly affected by host extinction, it can lead to ambiguous
inference of the afterglow properties.
In particular, the relationship between the light curve decay
indices, the ’s, and the spectral index, ,
that is predicted by synchrotron models of afterglows (e.g. Sari, Piran & Narayan 1998; Sari, Piran & Halpern 1999; Price et al. 2002), can lead to inconsistent interpretations due to the unknown host
extinction.
To date, interpretation of the GRB 010222 afterglow observations has mainly relied on two possible scenarios: i) A narrow sideways expanding jet propagating in a low-density medium (e.g. Stanek et al. 2001). ii) A wide jet or spherical fireball transiting from relativistic to non-relativistic regime (e.g. Masetti et al. 2001; in ’t Zand et al. 2001). The latter models require a very dense medium and implies a very large energy release, thus bringing back the energy problem (Kulkarni et al., 1999; Andersen et al., 1999). Both classes of models require a hard electron energy distribution, i.e. , in the first case even as low as . This is contrary to most other bursts that seem to be adequately fit with models where (van Paradijs, Kouvelioutu & Wijers 2000). Recently, Panaitescu & Kumar pankum02 (2002) presented fits to several afterglows, concluding that is smaller than 2 in a number of them. Such small inferred values of signal a departure from the standard fireball model (Mészáros, 2002), and introduce additional free parameters into the model, such as an upper cutoff in the electron energy distribution, or additional assumptions about the electron acceleration mechanism to facilitate generation of flat energy distributions (Dai & Cheng 2001; Bhattacharya 2001). The -problem then arises from the fact that detailed modelling of particle acceleration in relativistic shocks indicates that (Achterbeg et al., 2001).
In addition, if is assumed to be constant throughout the fireball evolution, the magnitude of the observed light curve break in the case of GRB 010222, , cannot be explained by the above models. The sideways expanding jet model predicts a break magnitude of , while the fireball transiting to the non-relativistic regime gives for slow cooling electrons. For fast cooling electrons the latter model predicts . The break magnitudes predicted by the models are in all cases very different from the observed value that is however, in perfect agreement with the prediction of a jet model with a fixed opening angle (Mészáros & Rees, 1999), , being essentially of geometrical origin.
In this Letter we use polarization measurements to argue against interpreatations based on spherical models transiting to the non-relativistic regime. Furthermore, we demonstrate that the observations of GRB 010222 can be naturally interpreted with a jet model with a small opening angle and continuous energy injection.
2 Observations
2.1 Polarimetry
Polarimetric imaging observations were obtained at the 2.56-m Nordic Optical Telescope (NOT) on La Palma, The Canary Islands, with the Andalucía faint object spectrograph (ALFOSC), using two calcite plates together with a -band filter. Each calcite plate provides the simultaneous measurement of the ordinary and the extraordinary components of two orthogonally polarized beams. Thus, one image gives either the 0∘ and 90∘ components or the 45∘ and 135∘ components simultaneously. The calcite plates produce a vignetted field of about 140″ in diameter. The detector was a thinned Loral pixel Charge-Coupled Device (CCD) giving a pixel scale of 0.188″. The ordinary and extraordinary beams appear as images separated by about 15″ on the CCD detector.
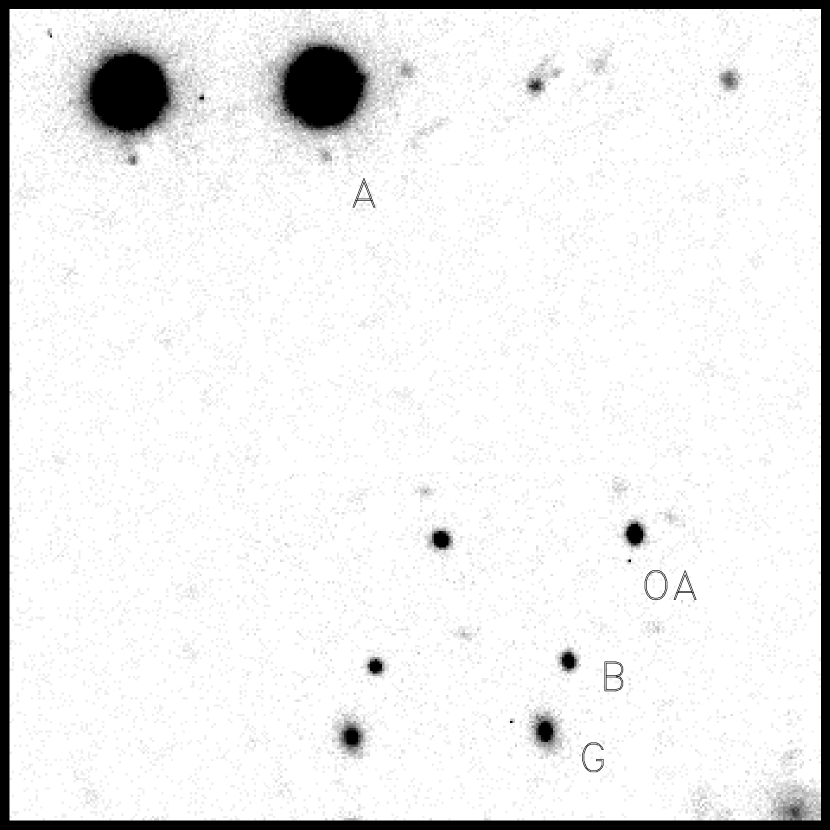
Observations began 21.88 hours after the burst with observing and reduction procedures similar to that used for GRB 990123 (Hjorth et al., 1999), each image providing fluxes in two of the four orientations required. Individual exposure times were 600 or 900 s resulting in total exposure times of 2400 s per orientation at a mean epoch of Feb 23.25169 2001 UT, 22.65 hours after the burst (see Table 1). No information on the position angle is available, as no polarization standards were observed. The images were flat fielded using standard procedures with appropriate dome flats in each of the two orientations. The three images in each orientation were combined. Absolute photometric calibration was performed relative to star A of Henden et al. (2002) which has . Meteorological conditions were fine and the measured resolution of the images was 0.8–. Figure 1a shows an excerpt of the combined images.
Aperture photometry was performed on the combined images with the DAOPHOT II/ALLSTAR (Stetson 1987, 1994) software package. Point-spread function (PSF) photometry turned out to be difficult due to the lack of suitable PSF stars and the strongly orientation-dependent PSF shape and width. Aperture growth curves were computed for the OA, star B and a galaxy (G) in the field (see Fig. 1a). Star A was saturated in these images. Aperture photometry of star A was therefore performed on the short exposures obtained immediately after the six long exposures (cf. Table 1).
In order to correct for possible interstellar polarization, polarization induced by the telescope and instrument, and the significant variations in stellar shape as a function of orientation, we computed aperture growth curves for OA, B and G relative to A.
The Stokes vector, the instrumental Q and U values, and the linear
polarization were computed from the derived fluxes in the four orientations
(Hjorth et al., 1999; Wijers et al., 1999; Rol et al., 2000) as a function of aperture radius.
The results are dependent on the aperture radii used.
For small radii the results are dominated by photon noise and small
variations in the shapes
and widths of the objects relative to star A. For large radii the noise
from and difficulty in subtracting the sky background dominates. Thus,
one can only hope for reliable results for intermediate aperture radii.
We used two criteria for selecting the aperture radius, namely
(i) minimizing photon noise which favored aperture radii between 4 and 6
pixels and (ii) insensitivity to the aperture radii of the Q and U values
which favored aperture radii between 5 and 7 pixels. We note that B never
reached independence of aperture radius and shows a variation in Q
larger than that expected from photon noise. We therefore consider the
results for B unreliable, probably due to relatively high photon noise
from the fainter star. Aperture radii between
5 and 7 pixels for the OA and G are shown as filled circles in Fig. 1b.
The mean of these give and
. We note that the polarization of the galaxy is
consistent with zero as it should if star A is unpolarized.
The effects of depolarization or interstellar polarization in the Milky Way are expected to be negligible at the high latitude of GRB 010222 () – well out of the Galactic plane. For the low Galactic extinction of E(BV) = 0.023 (Schlegel, Finkbeiner & Davis 1998), the maximum interstellar polarization or depolarization is less than 0.2% (Serkowski, Mathewson & Ford 1975; Berdyugin & Teerikorpi 1997). Thus the interstellar polarization or depolarization towards GRB 010222 is negligible.
At low significance levels of the computed afterglow polarization, a correction must be applied to account for the non-Gaussian nature of the underlying probability distribution (Wardle & Kronberg, 1974). When corrected for this effect the -band linear polarization of the optical afterglow of GRB 010222 is %, similar to the degree of polarization observed in a number of other bursts (e.g. Covino et al., 1999; Rol et al., 2000).
As seen in Table 1, the optical afterglow decayed during the observations. As a check on the reliability of our polarization measurements we computed the V-band magnitudes by taking the mean of the two orientations at each epoch. The resulting decay slope of is consistent with the observed lightcurve (e.g. Henden et al. 2002).
2.2 X-rays
We have also analyzed data from Chandra X-ray Observatory observations starting about 15 hours after the burst, yielding a net exposure time of 29.5 ksec. Due to the brightness of the -ray afterglow the data are severely affected by pile-up. Hence, the spectra were analyzed following the procedure suggested by Davis davis01 (2001), taking pile-up effects explicitly into account in the spectral modeling. We extracted a spectrum from a circular 4 arcsec diameter region centered on the -ray afterglow and fitted the 0.5-10 keV spectrum with three model components: i) An intrinsic power law, ii) Galactic absorption fixed at the nominal value cm-2 (Dickey & Lockman, 1990), and iii) intrinsic absorption in the GRB host fixed at the anticipated redshift of . This model provides an excellent fit ( for 204 d.o.f.), with a best fit spectral index and intrinsic GRB host absorption cm-2 ( errors). There is no evidence for additional spectral features. The 4 keV flux at the mean epoch of observations, , was Jy. The near contemporaneous BeppoSAX observations give (in ’t Zand et al., 2001). The difference between our spectral index and the BeppoSAX results is due to different derived values of . Using their method and fixing at their value, we find .
3 A Jet with Continuous Energy Injection
Sources of synchrotron radiation are generally expected to exhibit polarization in their emission, with the degree of polarization as high as (e.g. Rybicki & Lightman 1985). This is, however, strongly dependent on the degree of regularity in the magnetic field. In fireball models, the field is expected to be highly entangled with no preferred direction, hence little or no polarization is expected. This would also be the case in a spherical fireball, due to symmetry, even if the magnetic field had a regular component.
In a jet-like fireball, if the magnetic field has a regular component and the line of sight is at an angle with the center of collimation, some polarization may be observed (Ghisellini & Lazzati, 1999; Sari, 1999). The degree of polarization observed in GRB 010222 thus suggests that the fireball is slightly asymmetric. It follows that a transition to a non-relativistic regime of a spherical fireball or a wide jet, is not likely to be a correct description of this event.
On the other hand, the observed light curve break magnitude, , is exactly what is expected in a jet of fixed opening angle (Mészáros & Rees, 1999). We will henceforth adopt that geometry.
The isotropic energy release of GRB 010222, as estimated from the SAX data is (in units of erg), in a cosmology with , and (Amati et al., 2002). The initial Lorentz-factor, estimated from equation (10) in Sari & Piran sarpir99 (1999), is then , ignoring the weak dependence on the ambient number density, . Using the light curve break time days (Henden et al., 2002), we find that the corresponding collimation angle at is , reducing the estimate of the energy released in the burst to ergs, fully consistent with the results of Frail et al. frail01 (2001), although near the higher end of their distribution.
We advance the hypothesis that the exceptionally slow light curve decay of GRB 010222 is the consequence of continuous energy injection. If the fireball energy injection is continuous over an extended period of time rather than instantaneous, it may be modeled as a power law in ejected mass (Rees & Mészáros, 1998; Sari & Mészáros, 2000). The resulting time evolution of the Lorentz-factor can then be expressed as , where is the power law exponent of the ejected mass distribution and is the power law index of the ambient density distribution. We will henceforth assume a homogeneous environment (). Then reproduces the instantaneous case as the energy release is then constant, while implies that the energy is dominated by material with low Lorentz-factors (Rees & Mészáros, 1998). We will take as a representative case of moderate energy injection (Sari & Mészáros, 2000). Knowing the hydrodynamic evolution allows one to derive the corresponding light curve and spectral evolution as in the standard fireball model with instantaneous energy injection. General expressions, valid also for inhomogeneous external medium, can be found in Sari & Mészáros (2000). We will use their notation in what follows. It should be emphasized that a reverse shock is expected to produce substantial flux at low frequencies, especially at late times.
Interpreting the optical and -ray light curves as due to the forward shock we find, using and , that
| (1) |
in agreement with many other bursts. It follows that the intrinsic spectral index is . This is fully consistent with the -ray observations, if the cooling frequency, was above the -rays at the time of observations, but it requires moderate extinction in the optical (Lee et al. 2001; Masetti et al. 2001). It provides a consistent picture of the broadband spectrum from optical through the -rays. The uncorrected -flux at 0.81d is 45J, using the temporal index as inferred from our polarimetry. Adopting the SMC extinction correction of Lee et al. (2001), we find that corresponds to , consistent with the intrinsic spectral slope we inferred above and our -ray observations.
We note that if , when , then the pre-break slope would be in the range . For a jet with fixed , we would then have . It is not straight forward to estimate the post break slope in an expanding jet model, as it requires a knowledge of how the continuous energy injection modifies the jet evolution subsequent to the moment when . This is the subject of a separate paper (Björnsson et al. in preparation). We expect, however, a tranistion period where the temporal slope depends both on and . The asymptotic decay slope will in the end approach , but this may not be reached in all cases before the optical transient fades below detectability or the host galaxy starts to dominate the emission. The late time decay slope derived by Fruchter et al. (2001), , may indeed indicate that the afterglow continued to steepen at very late times. We suggest that the above scenario may also apply e.g. to GRB 020813 as its light curve decay is very similar to that of GRB 010222 (e.g. Bloom, Fox & Hunt 2002; Gladders & Hall 2002).
The flux from the forward shock has a maximum at the frequency , that in this interpretation is below the optical. The spectral region from optical through -rays is therefore represented by the same power-law, . From our -ray data at , we obtain
| (2) |
To solve for the model parameters, we need two more constraints. The optical and the -rays are degenerate in the sense, that they are both between and . The reverse shock is expected to produce substantial emission around the frequency , that is defined analogously to , and is related to it by , the peak flux of the reverse shock being a factor larger than the peak flux of the forward shock. For Hz, could be from a few hundred GHz to Hz. Furthermore the flux from the reverse shock may be expected to stay constant or even increase for a period of time (Panaitescu, Mészáros & Rees 1998), or decay as (Sari & Mészáros, 2000). The radio and sub-mm observations of Frail et al. frail02 (2002), show a constant flux onwards from about and at 350 and 250 GHz, respectively. They convincingly argue that this flux originates in the host galaxy rather than the afterglow. That sets an upper limit on the emission predicted by the model, in principle enabling us to further constrain the parameters. In practice, as is unknown, the constraints in this case are very weak. It is apparent though from eq. (2), that for reasonable values of , and , the magnetic field is very weak.
A generic property of extended injection models is that the afterglow fades more slowly than in the case of instantaneous injection. We have chosen a simple power-law distribution of as an example of such a scenario. Other, perhaps more detailed models, are of course possible (e.g. Zhang & Mészáros 2002), but would only affect the above interpretation in the details. The interpretation presented here, requires the introduction of an additional model parameter (), but this is also true in other models for the case of as discussed above. An inferred value of is furthermore supported by detailed modelling of particle acceleration in relativistic shocks (Achterbeg et al., 2001).
References
- Achterbeg et al. (2001) Achterbeg, A., Gallant, Y. A., Kirk, J. G., Guthmann, A. W., 2001, MNRAS 328, 393
- Amati et al. (2002) Amati, et al. 2002, A&A 390, 81
- Andersen et al. (1999) Andersen, M. I., et al. 1999, Science 283, 2075
- (4) Bhattacharya, D., 2001, Bull. Astr. Soc. India, 29, 107
- (5) Bloom, J. S., Fox, D. W. & Hunt, M. P., 2002, GCN, 1476
- Berdyugin & Teerikorpi (1997) Berdyugin, A., Teerikorpi, P., 1997, A&A 318, 37
- Cowsik et al. (2001) Cowsik, R., Prabhu, T. P., Anupama, G. C., Bhatt, B. C., Sahu, D. K., Ambika, S., Padmakar, Bhargavi, S. G. 2001, Bull. Astr. Soc. India, 29, 157
- e.g. Covino et al. (1999) Covino, S., et al. 1999, A&A 348, L1
- (9) Dai, Z. G. & Cheng, K. S., 2001, ApJ 558, L109
- (10) Davis, J. E., 2001, ApJ 562, 575
- Dickey & Lockman (1990) Dickey, J. M. & Lockman, F. J., 1990, ARA&A, 28, 215
- (12) Frail, D. A., et al. 2001, ApJ 562, L55
- (13) Frail, D. A., et al. 2002, ApJ 565, 829
- (14) Fruchter, A., Burud, I., Rhoads, J., Levan, A. 2001, GCN, 1087
- Ghisellini & Lazzati (1999) Ghisellini, G. & Lazzati, D. 1999, MNRAS, 309, L7
- (16) Gladders, M. & Hall, P., 2002, GCN, 1514
- (17) Henden, A. A. & Vrba, F. 2001, GCN, 967
- Henden et al. (2002) Henden, A. A., et al., 2002, in preparation
- Hjorth et al. (1999) Hjorth, J., et al. 1999, Science 283, 2073
- (20) Jha, S., et al. 2001, ApJ 554, L155
- Kulkarni et al. (1999) Kulkarni, S. R., et al., 1999, Nature 398, 389
- (22) Lee, B. C., et al. 2001, ApJ 561, 183
- (23) Masetti, N., et al. 2001, A&A 374, 382
- Mészáros (2002) Mészáros, P., 2002, ARA&A in press (astro-ph/0111170)
- Mészáros & Rees (1999) Mészáros, P., & Rees, M. J., 1999, MNRAS 306, L39
- (26) Mirabal, N., et al. 2002, astro-ph/0207009
- (27) Panaitescu, A., Mészáros, P., & Rees, M. J., 1998, ApJ 503, 314
- (28) Panaitescu, A., & Kumar, P., 2002, ApJ, 571, 779
- Piro et al. (2001) Piro, L. 2001, GCN, 959
- (30) Price, P. A., et al., 2002, astro-ph/0203467
- Rees & Mészáros (1998) Rees, M. J., & Mészáros, P., 1998, ApJ 496, L1
- Rol et al. (2000) Rol, E., et al. 2000, ApJ, 544, 707
- (33) Rybicki, G. B., Lightman, A. P., Radiative Processes in Astrophysics, Wiley-Interscience, 1985
- (34) Sagar, R., et al. 2001, Bull. Astr. Soc. India. 29, 91
- (35) Sari, R., Piran, T., & Narayan, R., 1998, ApJ 497, L17
- (36) Sari, R., Piran, T., & Halpern, J. P., 1999, ApJ 519, L17
- Sari (1999) Sari, R. 1999, ApJ, 524, L43
- (38) Sari, R., & Piran, T., 1999, ApJ 520, 641
- Sari & Mészáros (2000) Sari, R., & Mészáros, P., 200, ApJ 535, L33
- (40) Schlegel, D.J., Finkbeiner, D. P., & Davis, M., 1998, ApJ 500, 525
- (41) Serkowski, K., Mathewson, D. S., & Ford, V. L., 1975, ApJ 196, 261
- (42) Stanek, K. Z., et al. 2001, ApJ 563, 592
- (43) Stetson, P. B., 1987, PASP, 99, 191
- (44) Stetson, P. B., 1994, PASP, 106, 250
- in ’t Zand et al. (2001) in ’t Zand, J. J. M., et al. 2001, ApJ 559, 710
- (46) Zhang, B., & Mészáros, P., 2002, ApJ 566, 712
- (47) van Paradijs, J., Kouvelioutu, C. & Wijers, R. A. M. J., 2000, ARA&A, 38, 379
- Wardle & Kronberg (1974) Wardle, J. F. C., Kronberg, P. P., 1974, ApJ 194, 249
- Wijers et al. (1999) Wijers, R. A. M. J., et al. 1999, ApJ, 523, L33
| Time | orientation | exp. time | |
|---|---|---|---|
| (Feb 2001 UT) | (deg) | (s) | (mag) |
| 23.22499 | 900 | ||
| 23.23640 | 900 | ||
| 23.24782 | 900 | ||
| 23.25925 | 900 | ||
| 23.26894 | 600 | ||
| 23.27688 | 600 | ||
| 23.28154 | 30 | ||
| 23.28289 | 30 |
The photometric zero point was determined assuming for star A (cf. Henden et al. 2002).