Flux and spectral variations in the Circinus Galaxy
We report on a dramatic flux ( increase in the LECS and MECS band) and spectral variation between two BeppoSAX observations of the Circinus Galaxy performed almost three years apart. Through the analysis of all observations available in the archive, including a new DDT observation on May 2001, we show that a high flux state of an extremely variable Ultra Luminous X-ray source (CG X-1: Bauer et al. 2001), which is within the adopted BeppoSAX source extraction region of , is the most likely explanation for most of the observed variation. However, the presence of a high flux 6.7 keV line and the spectral variation of the PDS in the new BeppoSAX data could be partly due to intrinsic variation of the nucleus. Comparing the longest Chandra observation and the BeppoSAX one, we find that the long-term flux variability of CG X-1 is not accompanied by a significant spectral variability. We also re-analysed the HEG nuclear spectra and report on the presence of a Compton shoulder with a flux of about the line core, in agreement with theoretical expectations for Compton-thick matter.
Key Words.:
Galaxies: individual: Circinus - Galaxies: Seyfert - X-rays: galaxies - X-rays: individuals: CG X-1 - X-rays: individuals: CG X-21 Introduction
The Circinus Galaxy hosts one of the closest (3.8 Mpc) and X-ray brightest ( erg cm-2 s-1) Seyfert 2. The detailed HST images clearly reveal a compact ( pc) active nucleus seen through high obscuration, surrounded by extended and complex structures (Wilson et al. 2000).
The first X-ray observation was performed during the All Sky Survey (Brinkmann et al. 1994). A reflection dominated spectrum was revealed by , together with a prominent neutral iron K line and a number of other lines from lighter elements (Matt et al. 1996). The BeppoSAX observation added a precious piece of information, detecting the direct nuclear emission above keV, absorbed at lower energies by a Compton–thick ( cm-2) material, usually identified with the torus envisaged in unification models (Matt et al. 1999; Guainazzi et al. 1999).
The line spectrum above keV clearly originates from low ionized matter (Matt et al. 1996; Netzer et al. 1998; Sako et al. 2000). It was shown that it is fully compatible with reflection from the inner surface of a mildly ionized torus, the same matter likely responsible for the absorption of the nuclear radiation: this interpretation leads to an estimate of the inner radius of the torus of pc (Bianchi et al. 2001). The spectrum below keV is probably contaminated by an extended emission and/or off-nuclear sources within and BeppoSAX extraction regions.
This scenario was basically confirmed by . Two different regions are clearly observed: one compact and spatially unresolved (15 pc) which corresponds to the nucleus, where the reflection spectrum and the iron line is produced; the other, extended over about 50 pc, where most of the soft emission is produced (Sambruna et al. 2001a, b). Furthermore, a number of off-nuclear sources were detected, mostly concentrated within of the nucleus (Smith & Wilson 2001; Bauer et al. 2001; Sambruna et al. 2001a): at least one of them is likely to have contaminated and SAX observations during its high flux states (see below).
In this paper we report on a dramatic flux and spectral variation detected in a second BeppoSAX observation of the Circinus Galaxy performed on January 2001, almost three years later than the first one. In order to discriminate between a nuclear variation and the contamination of an off–nuclear source, we will make extensive use of all observations available in the archive, together with unpublished Director’s Discretionary Time (DDT) data taken on May 2001. We adopt the names after Bauer et al. (2001) (from now on B01) for the two sources discussed in this paper, CG X-1 (, ) and CG X-2 (, ).
2 Observations and data reduction
2.1 ROSAT
2.2 BeppoSAX
The Circinus Galaxy was observed for the first time by BeppoSAX (Boella et al. 1997) on 1998 March 24 and then again on 2001 January 7. Data from the first observation are discussed by Guainazzi et al. (1999) and Matt et al. (1999): we defer the reader to these papers for details.
Data from three instruments (LECS, MECS and PDS) aboard BeppoSAX will be discussed here. The MECS works in the 1-10 keV energy band, with an energy resolution of and an angular resolution of arcmin (FWHM) at 6 keV. The LECS covers a larger energy band, extending down to 0.1 keV, with characteristics similar to the MECS in the overlapping band. The PDS is a passively collimated detector with a field of view of approximately 1.5x1.5 degrees, working in the range 13-200 keV. The effective exposure times of the 2001 observation were s (LECS), s (MECS) and s (PDS).
As discussed in detail in Matt et al. (1999), there is a second bright source within from the Circinus Galaxy in the LECS and MECS images. Following Matt et al. (1999), we avoided contamination from this source extracting data for the LECS and the MECS in a conservative radius of centered on Circinus. A smaller radius implies a large fraction of lost photons: for , a loss of the total counts is measured in the MECS. A background was created using blank sky spectra from the same region for the detector field of view and then subtracted. PDS data have been reduced following the standard procedures described in Matt et al. (1997). The resulting net count rates are shown in Table 1. Data were reduced with HEAsoft 5.1 and spectra analysed with Xspec 11.1.0.
| LECS | MECS | PDS | Flux 2-10 keV (cgs) | |
|---|---|---|---|---|
| 1998-03-13 | ||||
| 2001-01-07 |
2.3 Chandra
Following the discovery of a large flux and spectral variation in the second SAX observation (see Sect. 3), a DDT observation was performed on 2001 May 2. The arcsec spatial resolution of allows us to resolve several different sources within the BeppoSAX adopted source extraction region. Circinus had been already observed several times by and a systematic study of the variability for all the sources present in the field over a period of 1.5 years is possible (Table 2).
All observations were performed with the Advanced CCD Imaging Spectrometer (ACIS-S: Garmire et al., in preparation). Only two (they are actually almost contiguous segments) used the High-Energy Transmission Grating Spectrometer (HETGS: Canizares et al., in preparation). Different configurations of subarray windows, resulting in different frame times, were selected, depending on the aims of the observations. A lower frame time reduces significantly the pileup of the nucleus, at the expense of a less efficient use of the exposure time and consequent lower statistics for all sources. Data were reduced with the Chandra Interactive Analysis of Observations software (CIAO 2.2.1), using the Chandra Calibration Database (CALDB 2.10). Spectra were analysed with Xspec 11.1.0, while grating data with 2.2.1. In the following, errors are at the 90% level of confidence for one interesting parameter ().
| Date | Instr. | Frame Time (s) | Exp (s) | Reference | Nucleus | CG X-1 |
|---|---|---|---|---|---|---|
| 2000-01-16 | ACIS-S | 3.2 | 964 | Smith & Wilson 2001 | ||
| 2000-03-14 | ACIS-S | 0.4 | 4974 | Smith & Wilson 2001 | ||
| 2000-03-14 | ACIS-S | 3.2 | 23076 | Smith & Wilson 2001 | ||
| 2000-06-15 | ACIS-S HETG | 2.1 | 7122 | Bauer et al. 2001 | ||
| 2000-06-16 | ACIS-S HETG | 2.1 | 60222 | Bauer et al. 2001; Sambruna et al. 2001a, b | ||
| 2001-05-02 | ACIS-S | 3.2 | 4401 | This paper |
3 Data analysis
3.1 Flux
3.1.1 BeppoSAX
The net count rates for the new observation are significantly higher than those of the 1998 one for the LECS and the MECS by a factor of . In contrast, the count rate for the PDS is slightly lower in the new observation, even if marginally consistent with that measured in the old one (Table 1).
To avoid possible systematic errors in the effective count rates of the new data, we performed a series of tests. First of all, we checked that the backgrounds for the two instruments were the same in the two observations. Then we looked at the lightcurves of the two sets of data in order to understand if the calculated mean count rates could be contaminated by short periods of anomalous high or low flux. Both tests indicate that the flux variation between the two observations is a real effect.
Another possible source of contamination could be the second source visible in the MECS and LECS images: a rise in its flux from the previous observation could affect the Circinus flux even within the conservative region adopted. We then extracted the spectrum in a radius of centered on the second source both for the LECS and the MECS. The net count rates are indeed higher for both instruments in the 2001 observation, but the change is not statistically significant ( against for the MECS and against for the LECS). It seems more reasonable that it is indeed the higher flux of Circinus that contaminates the second source, and not the contrary.
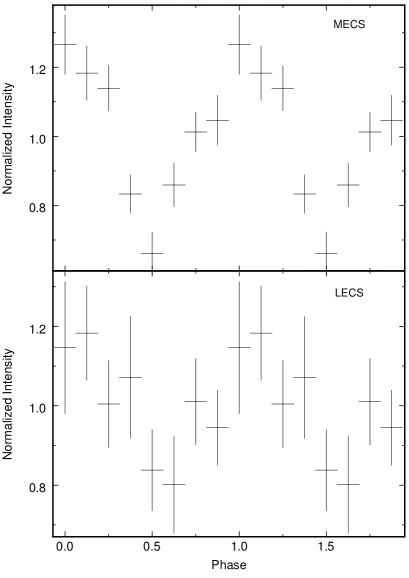
The lightcurve of the new data shows a larger variability than the old one. In particular, the MECS data in the soft band (below 3 keV) seems to vary periodically, as expected if the observed excess has to be ascribed to a high-flux state of an off-nuclear source, CG X-1, which is strongly periodic (B01; see Sect. 4.1). To test this possibility, we folded the MECS soft band lightcurve with the period of CG X-1 (27 ks): the result, shown in Fig. 1, clearly indicates the presence of such a periodicity, with an amplitude between maximum and minimum which is of the mean value. A similar behaviour is found in the LECS data, when folded with the same period: the amplitude is of the same order of that observed in the MECS data (Fig. 1). Evidence of the same periodicity is also present in the old data, but the variation amplitude is less, indicating a contamination from CG X-1 by only a factor of , in agreement with the low flux state in which the source was generally observed by Chandra (see Sect. 3.1.2).
3.1.2 Chandra
We analysed all the bright sources within of the nucleus (see Fig. 1 in B01, ) in all observations (see Table 2). To establish if the nucleus has remained constant, it must be noted that a direct comparison between observations with different frame time is not possible, because of the high pileup the source suffers with high frame times. The count rates for the nucleus in the three observations with frame time 3.2 s (which span a period of 1.5 years) are remarkably constant with one another. Moreover, the two contiguous observations with frame time 2.1 s are also consistent to each other. The only observation free of pileup is that with frame time 0.4 s (5% according to WebPIMMS111http://heasarc.gsfc.nasa.gov/Tools/w3pimms.html).
Unfortunately, it is not possible to compare the 2.1 s frame time observations with the others, because WebPIMMS does not support HETGS count rates with frame time other than 3.2 s. On the other hand, if we use the count rate for the 0.4 s observations to calculate the expected count rate with 3.2 s, we get a value somewhat lower than the observed one, but the predicted pileup is higher than 40%, where WebPIMMS results are probably no longer reliable. Therefore, even if, when comparison may be done, no evidence for variations is found, it is not possible to establish that the nucleus remained constant in all the observations, due to the above-mentioned problems.
All the analysed sources are always much fainter than the nucleus but CG X-1, which, on March 2000, reached the count rate of the AGN (Table 2). In all the other observations, instead, its count rate is much lower than that of the nucleus. The flux observed during its peak in March ( erg cm-2 s-1) is fully consistent with the LECS and MECS excess in the second SAX observation.
3.2 Spectral analysis
3.2.1 BeppoSAX
Figure 2 shows the data from the new observation superimposed on the best fit for the old one (Matt et al. 1999; Guainazzi et al. 1999). A huge excess both in the LECS and MECS is evident, together with large residuals around the iron line energy and a decrease in the PDS. We subtracted each other the two BeppoSAX spectra (PDS excluded) and performed a fit on the resulting spectrum. An absorbed powerlaw () is a good model (see Table 3), together with a huge (EW=1.9 keV) iron line at keV. The required column density ( cm-2) is higher than the Galactic one ( cm-2: Bauer et al. 2001). The 0.1–10 keV flux for this model is erg cm-2 s-1 and the line flux is ph cm-2 s-1. Alternatively, the spectrum can be fitted equally well by a multicolour disk blackbody emission (see Table 3), with an inner-disk temperature of keV and cm-2. A 6.7 keV line with the same flux as for the previous model is still required.

3.2.2 The Chandra spectrum of CG X-1
We then analysed the spectrum of CG X-1 in its high flux observation, in March 2000 (Table 2), in order to see if the spectral shape of the excess in the LECS and MECS data is compatible with the spectrum of CG X-1 as observed by . Because of the selected frame time of 0.4 s, this observation is almost free of pileup for CG X-1 (5% according to WebPIMMS). We get a good fit ( d.o.f.) with an absorbed powerlaw, cm-2 and (in good agreement with Smith & Wilson 2001). No iron line is required by the data: an upper limit to the flux of a 6.67 keV gaussian line is ph cm-2 s-1, which is not compatible with that measured by SAX.
A multicolour disk blackbody emission fits the spectrum equally well ( d.o.f.), with an inner-disk temperature of keV and cm-2. This kind of spectrum represents emission from an optically thick accretion disk around a black hole, generally a good model for Ultra-Luminous X-ray sources (Makishima et al. 2000).
In order to see if the flux variation of this source is associated with spectral variations, we extracted the spectra of CG X-1 for all observations. We decided to exclude from our analysis the second observation of March 2000, because the combination of a high flux state of the source and a frame time of 3.2 strongly affects its spectrum with pileup, and the shorter one of June 2000, because the source was in the same flux state as the contiguous observation, which was longer by a factor 10 (see Table 2). In each case, we tried the two models described above, a simple powerlaw and a disk black body. The results are summarized in Table 3.
| Parameter | BeppoSAX | JAN00 | MAR00a | JUN00b | MAY01 |
|---|---|---|---|---|---|
| (cm-2) | |||||
| 15 (35 dof) | 9 (7 dof) | 77 (92 dof) | 67 (56 dof) | 27 (17 dof) | |
| (cm-2) | |||||
| (keV) | |||||
| 16 (35 dof) | 9 (7 dof) | 81 (92 dof) | 60 (56 dof) | 21 (17) | |
| Flux 0.1–10 keV (cgs) |
There is indeed evidence of spectral variations, between hard and soft states, in terms either of different photon indexes or disk temperatures. B01 found that in the June observation there is a possible hardening of the spectrum during the rising phase of the period, suggesting that it could be the effect of an absorption at soft energies associated with that phase. Because of the short exposure times of the other observations, it is not possible to confirm this behaviour and ascribe the spectral variability to it. The only observation which is long enough is the second one performed in March but, because of the high flux state and the selected frame time, it is piled up so heavily that it lacks significant spectral informations. However, it should be noted that the only observation in which the spectrum appears soft is the longest one, where we analyse the mean spectral shape of all phases of the period. Moreover, this spectrum is fully compatible with that of the SAX residuals, as expected since the BeppoSAX observation (an exposure time of 51 ks distributed over 60 hours) also includes a number of periods of CG X-1.
3.2.3 The Compton shoulder
We re-analysed the HEG spectrum of the nucleus to look for a Compton shoulder in the iron K line, which is not reported in Sambruna et al. (2001b), possibly because the response matrix included with the version of CIAO available at that time was less accurate than the new one. However, this feature is predicted on theoretical grounds as a product of Compton scattering of the fluorescent line photons from optically thick matter (e.g. George & Fabian 1991; Matt et al. 1991; Reynolds et al. 1994; Matt 2002). Iwasawa et al. (1997) observed the Compton shoulder in the spectrum of NGC 1068. Later on, Kaspi et al. (2002) detected this feature in the HETG spectrum of NGC 3783. We expected it to be visible in the 60ks grating observation.
Indeed, residuals in excess of the red wing of the 6.4 keV iron line are clearly visible in the data, if we use a powerlaw as the continuum between 5 and 8 keV and put three gaussian lines at 6.40, 6.67 and 7.04 keV, as required by the data (Fig. 3). We tried to fit this feature with the box1D function in , which has a constant value in a given energy range and is identically null outside. This is a reasonable approximation of the theoretical profile (e.g. Fig. 2 in Matt 2002). The best fit boundaries for the box are 6.15 keV and 6.40 keV, while the flux is ph cm-2 s-1, that is that of the iron K line. If we keep the box boundaries fixed at the values expected from theoretical models (see below), the flux of the Compton shoulder is ph cm-2 s-1, that is that of the iron K line core.

These values are fully consistent with the theoretical expectations. If it originated by reflection from a Compton-thick material ( cm-2), the first order Compton shoulder is expected to extend from 6.2436 keV to the core of the iron line, with a centroid at 6.31-6.32 keV and a flux of that of the core (Matt 2002).
As a further test, we also fitted the Compton shoulder with Xspec, adopting a simple gaussian line. We obtain a good correction of the residuals, with a centroid at keV and a FWHM keV. The flux of the Compton shoulder modelled in this way ( ph cm-2 s-1) is fully compatible with that measured with .
4 Discussion
4.1 The nature of CG X-1
Off-nuclear Ultra-Luminous X-ray sources (ULXs) have been observed in several nearby galaxies by , , and now by (e.g. Colbert & Mushotzky 1999; Mizuno et al. 2001; La Parola et al. 2001; Fabbiano et al. 2001). Their luminosities are in the range erg s-1, largely super-Eddington for stellar mass objects. Even if some of them can be explained as the product of young supernova remnants (e.g. B01, and references therein), the basic idea is that such luminosities are achieved through accretion onto black-holes with masses of 50-500 M☉, i.e. intermediate between the masses of BH in Galactic binaries and those in AGNs.
CG X-1 was first observed by /HRI in 1995 (source 3 in Guainazzi et al. 1999), with a 0.5-2 keV flux of erg cm-2 s-1, fully consistent with that of the low state of the June 2000 observation. The Circinus Galaxy was observed again by /HRI in the following years: we downloaded the data from the archive and analysed the count rates of CG X-1 for each of them (Table 4). There is evidence of some variability, but the source seems always to be caught in a low flux state. On the other hand, a short-term, periodic variability is observed in the observations with the highest exposure times. The clearest evidence comes from the longest observation, in August 1997, whose lightcurve power spectrum shows a peak at a frequency corresponding to a period of ks, as observed by B01 in data (see below). The 1990 /PSPC observation could not be used to study CG X-1 because of its poorer spatial resolution (), which is actually larger than the distance between the source and the nucleus.
| Date | Exp. (s) | c/s | Flux 0.1-10 keV (cgs) |
|---|---|---|---|
| SEP95 | 4193 | ||
| FEB96 | 1081 | ||
| SEP96 | 1850 | ||
| MAR97 | 26673 | ||
| AUG97 | 46367 |
CG X-1 was then observed by and studied in detail by Smith & Wilson (2001), Sambruna et al. (2001a) and, in particular, B01. Indeed, the best spectral information come from the longest observation, in June 2000, which also gives the clearest evidence of a short-term, periodical behaviour of the source (B01). Therefore, we will mainly refer to the results presented by B01 and to their proposed interpretations of the nature of CG X-1, adding further insights using our analysis of all observations (see Table 3). Moreover, since it was shown in Sect. 3.2 that this source is likely to be the origin of most of the flux excess in the second BeppoSAX observation (with the exception of the 6.7 keV line and the PDS variation: see next section), we can assume that the spectrum resulting from the subtraction of the two BeppoSAX observations is a genuine spectrum of CG X-1. This spectrum can give valuable information, because, together with the June 2000 observation, is the only one which includes more than a period of the source.
There are several pieces of evidence which strongly suggest that CG X-1 lies in the disk of the Circinus Galaxy (B01). At the distance of 3.8 Mpc, the flux peak measured in March 2000 corresponds to a luminosity of erg s-1: this implies an object with a mass M 80 M☉, if radiating at or below its Eddington limit.
An optical counterpart is not detectable down to mag (B01). One of the most characteristic feature of CG X-1 is its clear periodic behaviour: in the June 2000 observation it was found to display a flux variability by a factor in a period of hr (B01). However, long-term variability is also observed, as already pointed out in Sect. 3.1.2: the flux peak in the June observation, for example, is about 1/4 of the observed mean in March. Periodic behaviour was also found in our analysis of the high flux state of March 2000, but the shorter exposure time prevented from confirming the above-mentioned period. The shape of the lightcurve during a period could be simply explained with an eclipse by a binary companion, but in order to make this model self-consistent an unphysically large companion would be required (B01).
Another possibility, again suggested by B01, is the modulation of the accretion rate from accretion-disk instabilities, as observed in the quasi-periodic episodes of the Galactic microquasar GRS 1915+105 (Greiner et al. 1996; Belloni et al. 1997). The statistical quality of the available observations of CG X-1 is not good enough to perform a spectral variability analysis as detailed as the one performed by Belloni et al. (1997), which led them to explain the variability in GRS 1915+105 in terms of cyclical emptying and refilling of the inner accretion disk. However, B01 claim a possible variation of the spectral shape during the different phases of the periodical lightcurve and the different temperatures needed in our fits of all observations of CG X-1 (see Table 3) could be due to the fact that we are observing the source in different phases of the period.
Regarding the long-term variability of CG X-1, if we compare the only two observations with a spectral shape averaged over more than a period (BeppoSAX and June 2000), we see that, despite a change in flux of a factor , the temperatures for the disk black body model are consistent with each other (see Table 3). This suggests that the long term variability is not associated with significant variations of the inner radius of the accretion disc.
4.2 The ionized iron line and the PDS variation
The spectral and flux properties of CG X-1 are clearly the best explanation for the variations observed in the Circinus Galaxy. However, no iron line is present in the spectrum of CG X-1, while large residuals are clearly detected in the new BeppoSAX data in excess of the iron line observed in the old data. The centroid energy of the residuals is strongly shifted to 6.7 keV, indicating ionized iron. The flux required by the SAX data is much larger than the upper limit in the spectrum of CG X-1, also when the source was as bright as supposedly was in BeppoSAX.
We re-analysed data from the old BeppoSAX observation and added a line at 6.67 keV: the upper limit for its flux is ph cm-2s-1, which is indeed a factor of 3 lower than in the new data (Sect. 3.2.1). On the other hand, the above-mentioned upper limit is fully consistent with the flux observed by the gratings aboard ( ph cm-2s-1: Sambruna et al. 2001b) in the nuclear region.
Contamination from another off-nuclear source is a possible explanation. CG X-2 (see Fig. 1 in B01, ) is an object with a flux comparable to that of CG X-1 in its low state, but fairly constant during all observations, being erg cm-2 s-1. Since it was completely absent in the 1995 /HRI observation and has optical and radio counterparts, B01 suggested it could be a young SNR. Our analysis of the other /HRI observations shows the source is not present up to at least September 1997, i.e. six months before the first BeppoSAX observation.
As observed by B01, CG X-2 has a huge iron line (EW=1.59 keV) at keV which is likely the blend of two lines (at 6.7 and 6.97 keV), as suggested by its intrinsic width of 190 eV. The flux of the line, which we calculated in the longest observation, is ph cm-2 s-1, which is almost a factor 5 lower than required in the new BeppoSAX data. The shorter exposure times of the other observations do not allow to search for variability of the flux of the line.
Therefore, it is not possible to exclude that the ionized iron line observed in the second SAX observation, even if clearly including the line of CG X-2 that was probably not present in the previous observation, could be an effect of a variation in the nuclear emission.
The same explanation can be adopted for the variation in the PDS spectral shape. Although the total count rates are consistent with each other (see Table 1), there is clearly a decrease in the lower part of the PDS band (Fig. 2). A possible interpretation is in terms of a change of the column density of the absorbing matter (the torus). However, it must be noted that the PDS field of view is very large (1.5x1.5 degrees) and so the emission from the nucleus could be contaminated by a number of sources in an unpredictable way. Among these sources, an important contribution could come from the second source present in the LECS and MECS images (see Sect. 3.1.1): it may be that its flux over 10 keV was higher in the first SAX observation. Unfortunately, there is no way to test this hypothesis.
5 Conclusions
The most likely explanation of at least most of the flux and spectral variation observed between two BeppoSAX observations taken almost three years apart is in terms of a high-flux state of CG X-1, which is located well within the adopted BeppoSAX source extraction region of . There are several pieces of evidence:
-
•
CG X-1 shows a strong, long-term variation, reaching a flux which is comparable with that of the nucleus and is consistent with that measured in the residuals of the two SAX observations.
-
•
The spectral shape of CG X-1, when averaged over more than a period, is fully consistent with the spectrum of the LECS and MECS BeppoSAX residuals.
-
•
Finally, the strongest evidence comes from the short-term variation of CG X-1, on a period of 27 ks: the MECS lightcurve of the new observation clearly varies with the same period, indicating that a significant part of the observed flux originates from CG X-1. The periodic behaviour was also present in the data from the old SAX observation, but the variation amplitude was much less, being consistent with contamination from a low-flux state of CG X-1.
The best interpretation for the nature of CG X-1 is in terms of a 80 M☉ black hole in an accreting binary system in Circinus, as previously suggested by B01. Our analysis of all observations and the BeppoSAX spectrum shows that the long-term variability of this source is not associated to spectral variations, indicating that it is not due to changes of the inner radius of the disk.
However, CG X-1 cannot be the cause of the variation of the PDS and the presence of an ionized iron line in the residuals between the two BeppoSAX observations. In both cases, a variation of the properties of the circumnuclear matter in the AGN environment is a possible explanation: an increase of the column density of the torus, for example, would cause the observed decrease of the PDS count rates at lower energies. However, it is difficult to imagine the physical cause to support such an increase.
As for the ionized iron line, it should be noted that the SAX residuals must include a line from CG X-2, which was likely not present in the old observation. Nevertheless, the contribution of the flux of this line is too low to exclude a variation of the 6.7 keV iron line originating from the nucleus.
Finally, our new analysis of the HEG nuclear spectrum has led to the detection of a Compton shoulder in the 6.4 keV iron line. Its flux is about 20 the line core, in agreement with theoretical expectations for Compton-thick matter, providing one more argument in favour of the association of the matter producing the iron line with the cm-2 neutral absorber.
Acknowledgements.
We would like to thank Harvey Tananbaum for his generous grant of a Chandra DDT observation, and the anonymous referee for his valuable suggestions which helped us improving the clarity of the paper.References
- Bauer et al. (2001) Bauer, F. E., Brandt, W. N., Sambruna, R. M., et al. 2001, AJ, 122, 182 (B01)
- Belloni et al. (1997) Belloni, T., Mendez, M., King, A. R., van der Klis, M., & van Paradijs, J. 1997, ApJ, 488, L109
- Bianchi et al. (2001) Bianchi, S., Matt, G., & Iwasawa, K. 2001, MNRAS, 322, 669
- Boella et al. (1997) Boella, G., Butler, R. C., Perola, G. C., et al. 1997, A&AS, 122, 299
- Brinkmann et al. (1994) Brinkmann, W., Siebert, J., & Boller, T. 1994, A&A, 281, 355
- Colbert & Mushotzky (1999) Colbert, E. J. M. & Mushotzky, R. F. 1999, ApJ, 519, 89
- Fabbiano et al. (2001) Fabbiano, G., Zezas, A., & Murray, S. S. 2001, ApJ, 554, 1035
- George & Fabian (1991) George, I. M. & Fabian, A. C. 1991, MNRAS, 249, 352
- Greiner et al. (1996) Greiner, J., Morgan, E. H., & Remillard, R. A. 1996, ApJ, 473, L107
- Guainazzi et al. (1999) Guainazzi, M., Matt, G., Antonelli, L. A., et al. 1999, MNRAS, 310, 10
- Iwasawa et al. (1997) Iwasawa, K., Fabian, A. C., & Matt, G. 1997, MNRAS, 289, 443
- Kaspi et al. (2002) Kaspi, S., Brandt, W. N., George, I. M., et al. 2002, accepted for publication in ApJS (astro-ph/0203263)
- La Parola et al. (2001) La Parola, V., Peres, G., Fabbiano, G., Kim, D. W., & Bocchino, F. 2001, ApJ, 556, 47
- Makishima et al. (2000) Makishima, K., Kubota, A., Mizuno, T., et al. 2000, ApJ, 535, 632
- Matt (2002) Matt, G. 2002, MNRAS in press (astro-ph/0207615)
- Matt et al. (1996) Matt, G., Fiore, F., Perola, G. C., et al. 1996, MNRAS, 281, L69
- Matt et al. (1997) Matt, G., Guainazzi, M., Frontera, F., et al. 1997, A&A, 325, L13
- Matt et al. (1999) Matt, G., Guainazzi, M., Maiolino, R., et al. 1999, A&A, 341, L39
- Matt et al. (1991) Matt, G., Perola, G. C., & Piro, L. 1991, A&A, 247, 25
- Mizuno et al. (2001) Mizuno, T., Kubota, A., & Makishima, K. 2001, ApJ, 554, 1282
- Netzer et al. (1998) Netzer, H., Turner, T. J., & George, I. M. 1998, ApJ, 504, 680+
- Reynolds et al. (1994) Reynolds, C. S., Fabian, A. C., Makishima, K., Fukazawa, Y., & Tamura, T. 1994, MNRAS, 268, L55
- Sako et al. (2000) Sako, M., Kahn, S. M., Paerels, F., & Liedahl, D. A. 2000, ApJ, 542, 684
- Sambruna et al. (2001a) Sambruna, R. M., Brandt, W. N., Chartas, G., et al. 2001a, ApJ, 546, L9
- Sambruna et al. (2001b) Sambruna, R. M., Netzer, H., Kaspi, S., et al. 2001b, ApJ, 546, L13
- Smith & Wilson (2001) Smith, D. A. & Wilson, A. S. 2001, ApJ, 557, 180
- Voges et al. (1996) Voges, W., Boller, T., Dennerl, K., et al. 1996, in Röntgenstrahlung from the Universe, 637–640
- Wilson et al. (2000) Wilson, A. S., Shopbell, P. L., Simpson, C., et al. 2000, AJ, 120, 1325