Simulated X-ray Cluster Temperature Maps
Abstract
Temperature maps are presented of the 9 largest clusters in the mock catalogues of Muanwong et al. for both the Preheating and Radiative models. The maps show that clusters are not smooth, featureless systems, but contain a variety of substructure which should be observable. The surface brightness contours are generally elliptical and features that are seen include cold clumps, hot spiral features, and cold fronts. Profiles of emission-weighted temperature, surface brightness and emission-weighted pressure across the surface brightness discontinuities seen in one of the bimodal clusters are consistent with the cold front in Abell 2142 observed by Markevitch et al.
keywords:
galaxies: clusters; general - cosmology: large-scale structure of the Universe1 INTRODUCTION
Observations of X-ray clusters of galaxies over the last few years have shown that clusters are not the smooth, featureless systems they were expected to be. X-ray surface brightness and temperature observations indicate the presence of substructure and support the view that cluster formation occurs through the infall and merger of subclusters.
Merger shocks would be expected to occur in such a scenario (e.g. Markevitch & Vikhlinin, 2001; Markevitch et al., 2002) but additionally Chandra observations have revealed a new phenomenon of ‘cold fronts’ (Markevitch et al, 2000; Forman et al., 2001; Mazzotta, Fusco-Femiano & Vikhlinin, 2002). At a cold front, the entropy jump across the sharp gas density discontinuity is in the opposite sense to that expected for a shock, with the high surface brightness side of the dense edge corresponding to low temperature.
The variety of features that have been observed in the clusters mapped so far are of great interest since they may shed light on the physical processes which are occurring as well as containing information on the stage, geometry, scale and velocity of the mergers. A number of authors have carried out simulations of controlled, single mergers (see Ritchie & Thomas 2002 for a review). For example, Ritchie & Thomas (2002) carried out high-resolution simulations of the merger of idealized clusters containing both dark matter and gas. They studied the effect on the observable properties of clusters of single head-on and off-centre mergers between both equal and unequal mass objects. A sequence of maps of emission-weighted temperature with superimposed X-ray surface brightness and velocity fields for mergers between equal mass systems showed the compression and shocking of the gas as the merger progressed. Recently Nagai & Kravtsov (2002) carried out a detailed study of cold fronts in high resolution simulations of two clusters forming in different Cold Dark Matter models (standard CDM and CDM). Their results indicate that cold fronts are probably fairly common but are non-equilibrium transient phenomena.
In this paper, we present preliminary results from temperature maps of an ensemble of clusters that form within a cosmological simulation, already shown to reproduce the observed X-ray scaling relations at low redshift (Muanwong et al. 2002). This way, we are able to directly assess the range of substructure present in the cluster population. In common with observations, we see significant temperature fluctuations in the hot gas, even when there is little information present in the surface brightness distribution. In particular, we discuss the presence of a cold front in one of our bimodal clusters, which has properties consistent with the cold front in Abell 2142 (Markevitch et al. 2000).
2 The simulations
Simulation data were generated using a parallel version of the hydra -body/hydrodynamics code (Couchman, Thomas & Pearce 1995; Pearce & Couchman 1997) on the Cray T3E supercomputer at the Edinburgh Parallel Computing Centre. Full details of the simulations have already been presented elsewhere (Thomas et al. 2002; Muanwong et al. 2002, hereafter M2002), so we summarize pertinent details only.
Results are presented for a flat, low-density cosmology (), using each of gas and dark matter particles within a box of comoving length, Mpc. We consider 2 models: the Radiative model includes radiative cooling of the gas, and the Preheating model for which we additionally preheat the gas by raising its specific thermal energy by 1.5 keV per particle at . In both models, we adopted a time-dependent global metallicity, , where Gyr is the current age of the universe. As discussed in M2002, both models reproduce the X-ray cluster scaling relations, although the Radiative model contains a significantly higher cooled fraction than the Preheating model (15 per cent, as opposed to per cent). In the former model, cooling is limited by numerical resolution. The cooled gas fraction is larger than that determined by Balogh et al. (2001), using results from the 2MASS and 2dF galaxy surveys (Cole et al. 2001), but in close agreement with the observed value from the SDSS (Blanton et al. 2001).
Simulated cluster catalogues were produced using the same method as described in M2002. In summary, clusters were identified as clumps of particles within spheres of average overdensities compared to the comoving critical density, centred on the position of the densest dark matter particle. For this paper, we adopt an overdensity of 1000; the associated radius, is approximately half the size of the virial radius, and is comparable to the extent currently probed by Chandra.
3 The temperature and surface brightness maps
Maps of emission-weighted temperature were made for each of the 9 most massive clusters () in the Preheating catalogue, and for the corresponding clusters in the Radiative catalogue. Each map was produced by first locating all hot (K) gas particles within a cube of length, along each side, centred on the cluster of interest. The desired quantity was then smoothed onto a 3D array using the SPH interpolation method (e.g. Monaghan 1992)
| (1) |
where
| (2) |
The sums extend over all particles and over all voxels. is the value of the quantity for particle at position , is the centroid position of voxel , , is a weight factor, is the same SPH smoothing kernel used by hydra (Thomas & Couchman 1992) and is the smoothing length of particle ( as ). Equation 2 normalizes the contribution of each particle to be when summed over all voxels. For all mass-weighted quantities, and for emission-weighted quantities, , for particle with mass , density , temperature and X-ray emissivity, ; the cooling function, is the same function adopted for our simulations, using tables published in Sutherland & Doptia (1993). The smoothed distribution was then projected onto a grid, with the width of each pixel being approximately 7 to 10 , smaller than the gravitational softening length used in the simulations (25 ).
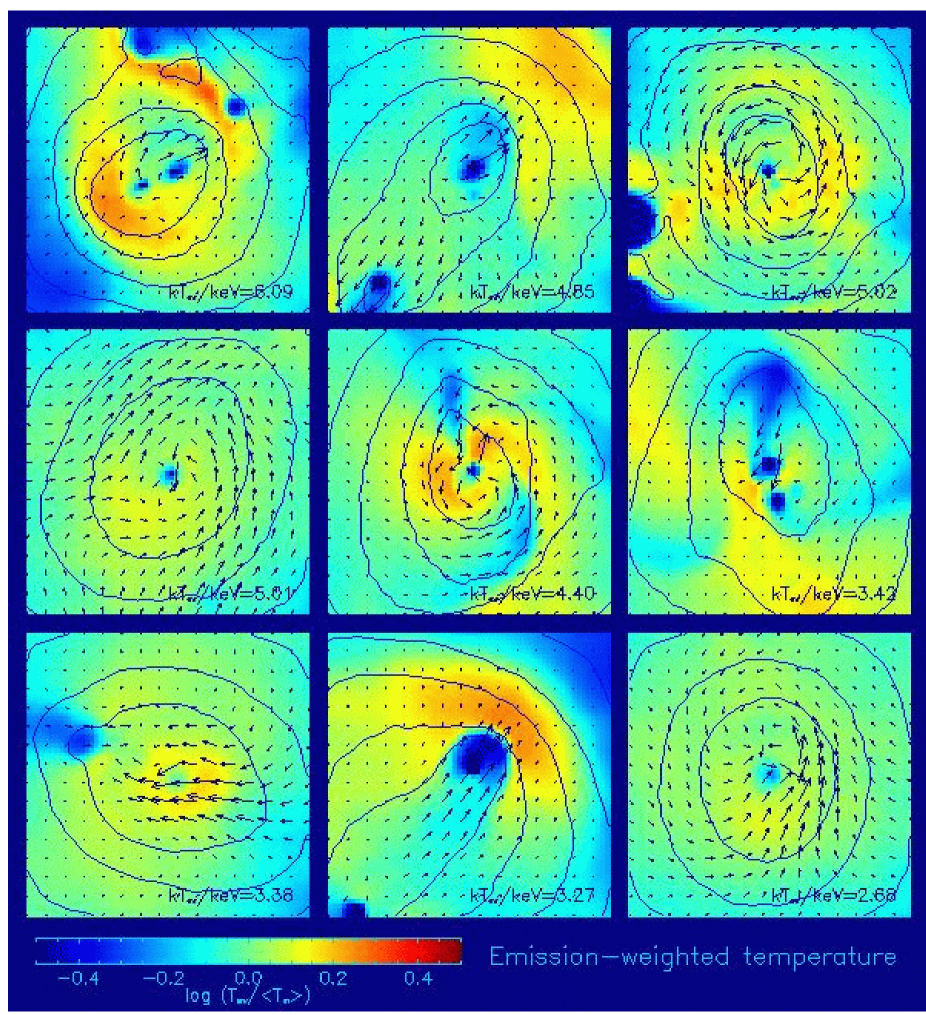
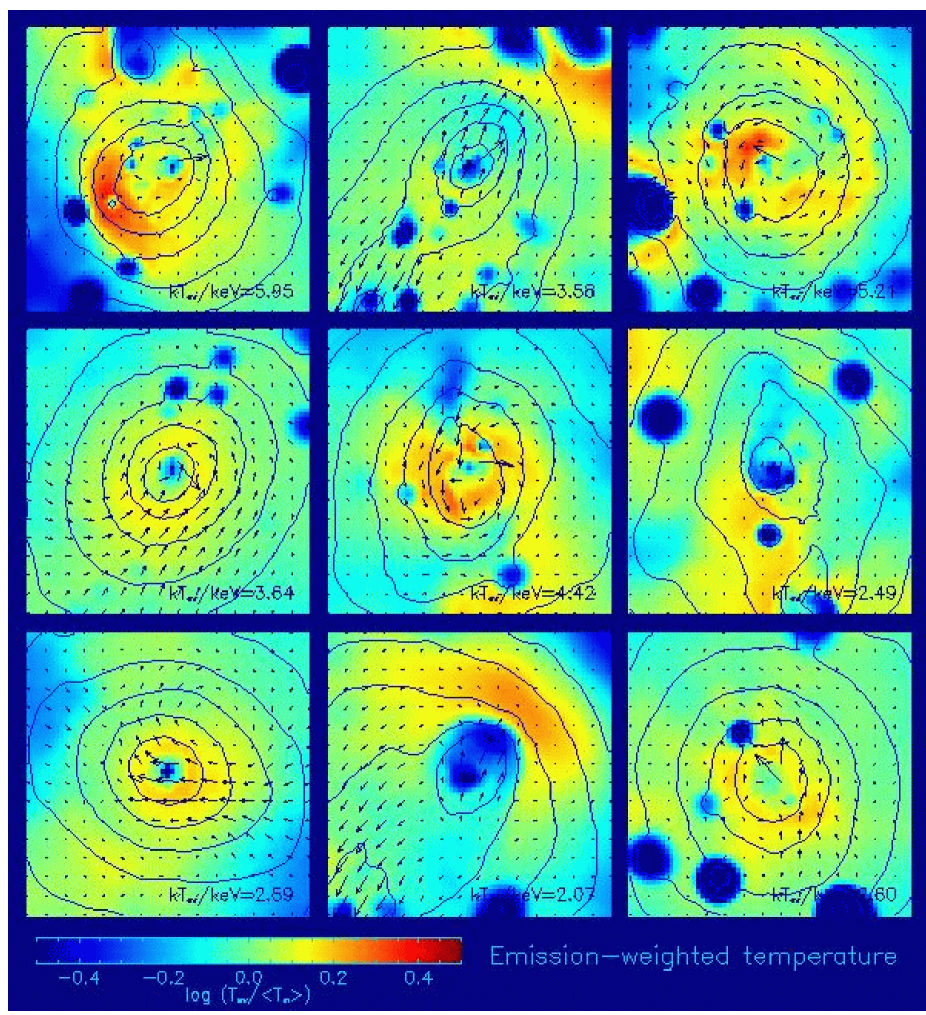
Figs. 1 & 2 show the emission-weighted temperature maps (with superimposed X-ray surface brightness contours and projected velocity vectors) for the Preheating and Radiative runs respectively. Surface brightness contours are normalized to the maximum value, with each contour representing variation by an order of magnitude. Velocities (in km/s) are mass-weighted and the length of each velocity vector represents the tangential speed (i.e. across the map plane) of the gas at that point.
Positive temperature fluctuations are evident of up to 3 times the average, associated with compression of the gas. There also exists bright clumps of cool gas, with temperatures less than half the mean value. These features are far more abundant in the Radiative maps than in the Preheating maps because the energy injection in the Preheating run was large enough to erase a significant amount of substructure.
Among the 9 clusters shown in Fig. 1, several show clear bimodal structure (clusters 1, 2 and 8). This is most clear for the 2nd and 8th maps, in each of which 2 cold clumps appear to be moving away from one another. In the Radiative maps (Fig. 2) the bimodal structure of map 1 is not so clear. The 8th cluster shows evidence of a sharp boundary at the leading edge of the cold clump in the upper right quadrant; when the maps for this cluster are re-centred to show the cold clump in the lower right of the map, a similar sharp edge can be seen. These features are indicative of observed cold fronts and this is investigated in the next section.
The velocity vectors superimposed on the cluster maps show clear evidence for rotation in some cases (for example maps 3, 5 and 9). Ritchie & Thomas (2001) found similar rotation of the velocity field in their simulated off-centre merger of two equal mass clusters. Except for map 9. where the surface brightness contours are essentially round, the contours are generally elliptical, again as found for merging clusters. The spiral patterns seen in some of the temperature maps (e.g. 3 & 5) may be due to heating by shocks produced during the merger as was seen in the simulations of Ritchie & Thomas during the interaction of cluster cores. With its rounder surface brightness contours, cluster 9 may be in a later, more relaxed state.

The centres of all clusters show a decline in temperature. This is in contrast to the simulated temperature maps of Loken et al. (2002), produced using an Adaptive Mesh-Refinement code, where the radial temperature profiles continue to rise at small radii. The Santa Barbara cluster comparison project (Frenk et al., 1999) found the general result that for non-radiative gas, SPH codes produce a central flat or slightly declining temperature profile, while all of the grid codes produce a temperature profile which continues to rise to the resolution limit. This conflict between results using the different codes still needs to be resolved. However, Fabian (2002) noted that all of the cores mapped so far by Chandra with radiative cooling times of a few Gyr show significant central temperature drops. This temperature drop of a factor of about 3 or more in the central region of the clusters was explained by Fabian as possibly due to a combination of radiative cooling and gas introduced from dense cooling subclusters, as we see here.
We present circularly-averaged emission-weighted temperature profiles for the Radiative maps in Fig. 3. The more regular of our clusters (4, 7, 9) exhibit the type of gradually declining temperature profile found by Loken et al. (2002). The others exhibit a variety of profiles with the irregular clusters (2, 6) even appearing approximately ishothermal when circularly averaged. It therefore seems doubtful that a universal temperature profile can be applied to galaxy clusters, at least in the inner regions (out to about 500 kpc, approximately half the virial radius).
4 Identification of a possible cold front in map 8


Of the nine cluster maps produced here, map 8 appeared to have the strongest visual evidence for the presence of cold fronts. To investigate whether the physical properties are consistent with a cold front, profiles were produced of emission-weighted temperature, X-ray surface brightness, pressure and density across the surface brightness and temperature discontinuity in the upper right quadarant of the Radiative map. The pixels with position angles between 30∘ and 60∘ with respect to the image centre were binned as a function of radius for each of the four parameters. The profiles are shown in Fig. 4.
A sharp rise in temperature by a factor of about 3 over a radial distance of Mpc was found, corresponding to a sudden change in the slope of the surface brightness profile. Comparison with the observed temperature profile across the northwestern edge of the X-ray image for Abell 2142 in Markevitch et al. (2000) shows that the radial scale is very similar and the temperature for both increases by approximately the same factor. In the region of the cold front, the pressure profile of the simulated cluster was smooth and fairly flat, falling off at larger radius. For the pressure profile to flatten in this region, where the temperature is rising sharply, implies that the gas density must be dropping sharply, again similar to the profile in Markevitch et al. (2000). The radial velocity of the gas in the cold clump is highly subsonic with respect to the gas to the right of the cold front.
Similar profiles, consistent with cold fronts, were found when the binning was repeated across the surface brightness edge in the lower left quadrant, and also for the Preheating run for the same cluster. The overall picture for this cluster, taking into account also the direction of the velocity vectors, is of two cold subclumps moving away from each other which fits in with the merger scenario suggested by Markevitch et al. (2000) of subclumps falling in along filaments. The cold cores are undisrupted by the merger and continue on through the cluster.
5 Discussion
Temperature maps of the 9 largest clusters in the simulated cluster catalogues of M2002 show clearly that the clusters do contain substructure. Features that are seen include cold clumps, some of which may be consistent with the infall of cold subclusters, hot spiral features consistent with shocks produced in mergers, and at least one map containing cold fronts. Elliptical surface brightness contours are the norm, and rotation as expected in off-centre mergers is common. The Preheating maps appear ’cleaner’, with fewer cold clumps present than for the Radiative maps, since the gas has been heated at z=4, wiping out many of the colder blobs. The remaining cold clumps seen in these maps did seem to be associated with motion into or through the cluster.
In this preliminary paper our main aim has been to demonstrate that simulated maps contain a variety of substructure. The scale of the structure is similar to that seen observationally and so gives some indication of the features which should be observable. Future work will focus on the evolution of structure in clusters and on a larger range of cluster masses extending down to the size of groups.
6 Acknowledgements
The simulations used in this paper were carried out on the Cray T3E at the EPCC as part of the Virgo Consortium programme of investigations into the formation of structure in the Universe. LIO was supported in part by the Leverhulme Trust and STK by PPARC; PAT is a PPARC Lecturer Fellow.
References
- [] Balogh M. L., Pearce F. R., Bower R. G., Kay. S. T., 2001, MNRAS, 326, 1228
- [] Blanton M. R., et al., 2001, AJ, 121, 2358
- [] Cole S., et al., 2001, MNRAS, 326, 255
- [] Couchman H. M. P., Thomas P. A., Pearce F. R., 1995, ApJ, 452, 797
- [] Fabian A. C., Allen S. W., Crawford C. S., Johnstone R. M., Morris R. G., Sanders J. S., Schmidt R. W., 2002, MNRAS, 332, L50
- [] Forman W., Jones C., Markevitch M., Vikhlinin A., Churazov E., 2001, astro-ph/0111526
- [] Frenk C.S. et al., 1999, ApJ, 525, 554
- [] Loken C., Norman M. L., Nelson E., Burns J., Bryan G. L., Motl P., 2002, astro-ph/0207095
- [] Markevitch M., Vikhlinin A., 2001, ApJ, 563, 95
- [] Markevitch M., Gonzalez A. H., David L., Vikhlinin A., Murray S., Forman W., Jones C., Tucker W., 2002, ApJ, 567, 27
- [] Markevitch M., et al., 2000, ApJ, 541, 542
- [] Mazzotta P., Fusco-Femiano R., Vikhlinin A., 2002, ApJ, 569, L31
- [] Monaghan J. J., 1992, ARA&A, 30, 543
- [] Muanwong O., Thomas P. A., Kay S. T., Pearce F. R., 2002, MNRAS, in press (astro-ph/0205137)
- [] Nagai D., Kravtsov A.V., 2002, astro-ph/0206469
- [] Pearce F. R., Couchman H. M. P., 1997, NewA, 2, 411
- [] Ritchie B., Thomas P. A., 2002, MNRAS, 329, 675
- [] Sutherland R. S., Dopita M. A., 1993, ApJS, 88, 253
- [] Thomas P. A., Couchman H. M. P., 1992, MNRAS, 257, 11
- [] Thomas P. A., Muanwong O., Kay S. T., Liddle A. R., 2002, MNRAS, 330, L48