The Black Hole Masses and Host Galaxies of BL Lac Objects
Abstract
We have measured the central stellar velocity dispersion in the host galaxies of 11 BL Lac objects with redshifts . The range of velocity dispersions, km s-1, is similar to that of nearby radio galaxies. Using the correlation between stellar velocity dispersion and black hole mass defined for nearby galaxies, we derive estimates of the black hole masses in the range . We do not find any significant difference between the black hole masses in high-frequency-peaked and low-frequency-peaked BL Lac objects. Combining the velocity dispersions with previously measured host galaxy structural parameters, we find that the host galaxies lie on the fundamental plane of elliptical galaxies. This supports the conclusions of imaging studies that the majority of BL Lac hosts are normal giant ellipticals.
1 Introduction
One of the goals of AGN research is to develop a unified framework in which the diversity of the AGN family might be understood in terms of variations in a few fundamental parameters such as the black hole mass, the ratio of the accretion rate to the Eddington accretion rate, and the orientation relative to our line of sight (e.g., Laor, 2000; Boroson, 2002). Determining the masses of the central black holes in different classes of AGNs is an important step toward this goal. An key advance in this area was the recent discovery of the relation, a tight correlation between black hole mass and stellar velocity dispersion in the host galaxy bulge (Ferrarese & Merritt, 2000; Gebhardt et al., 2000a). The relation has provided an important consistency check for black hole masses determined from reverberation mapping of Seyfert nuclei (Nelson, 2000; Gebhardt et al., 2000b; Ferrarese et al., 2001). The tightness of the correlation over a wide range of host galaxy types, both elliptical and spiral, makes it tremendously useful as a means to determine the black hole masses in AGNs. While stellar-dynamical or gas-dynamical black hole mass measurements are particularly difficult for AGNs, stellar velocity dispersions can be measured relatively easily in some classes of active galaxies. Furthermore, black hole mass estimates based on velocity dispersions are expected to be much more accurate than estimates derived from the loose correlation between and bulge luminosity (Magorrian et al., 1998; Kormendy & Gebhart, 2001).
We recently began a program to measure the stellar velocity dispersions in the host galaxies of low-redshift BL Lac objects in order to apply the relation and determine their black hole masses. The first measurement of a velocity dispersion in a BL Lac object, for the TeV -ray source Markarian 501, indicated a likely black hole mass of (Barth, Ho, & Sargent, 2002a, Paper I). In this paper, we report on measurements for a sample of 11 objects and discuss the results in the context of unification models for radio-loud AGNs. We also compare our results with measurements of stellar velocity dispersions for BL Lac objects reported recently by Falomo, Kotilainen, & Treves (2002, hereinafter FKT).
2 Observations and Reductions
The spectra were obtained at the Hale 5m telescope at Palomar Observatory, and at the 2.5m du Pont and 6.5m Baade (Magellan 1) telescopes at Las Campanas Observatory. We used the Double Spectrograph at Palomar (Oke & Gunn, 1982), the ModSpec Spectrograph at the du Pont telescope, and the Boller & Chivens Spectrograph at Magellan. Details of the instrumental setups are given in Table 1; Table 2 describes the exposures for each object. Conditions were mediocre during the Palomar nights, with typical seeing of 15 to 20 and thick clouds at times, while the Las Campanas nights were clear. The gratings and grating angles were chosen to cover the most useful spectral regions for measuring velocity dispersions: the Mg Ib region in the blue, and the Ca II near-infrared triplet in the red. The values for the seeing listed in Table 2 were measured from observations of template and standard stars, but these were mostly observed during twilight and the seeing during the BL Lac observations may have been somewhat different. For each galaxy, the slit was oriented close to the parallactic angle at the midpoint of the observation, and the total exposure time was divided into individual exposures of typically 1800 s.
Bias subtraction, flat-fielding, spectral extractions, and wavelength calibration were done using standard routines in IRAF, and the flux calibration and subsequent measurements were performed in IDL. Spectra were extracted using the optimal algorithm of Horne (1986) as implemented in IRAF; the extraction widths are listed in Table 2. The strongest telluric absorption bands were removed by division by the normalized spectrum of a nearly featureless star following methods similar to those of Wade & Horne (1988). After wavelength calibration, a final shift to the wavelength scale was applied to each exposure based on the wavelengths of night sky emission lines. This step ensured that the stellar absorption features were not artificially broadened by summing exposures with slightly offset wavelength scales.
During each observing run, several stars were observed for use as velocity templates. The template stars were chosen to be primarily giants of spectral type between G8 and K5, but we also observed some subgiants and dwarfs and also a few F and early-G stars. In the following analysis, we consider only the G and K giant templates, since they give the best match to the dominant stellar populations in the blazar host galaxies.
In addition to the sample listed in Table 1, we also observed the object BL Lac at Palomar, but were unable to measure its velocity dispersion. The stellar absorption lines were only barely detected in a total exposure of 7200 s due to overwhelming AGN contamination. Also, BL Lac has a Galactic extinction of mag (Schlegel, Finkbeiner, & Davis, 1998), and the dominant features over much of its optical spectrum are the Galactic diffuse interstellar bands (Vermeulen et al., 1995).
3 Measurement of Velocity Dispersion
Measurement of the velocity dispersion of a BL Lac host galaxy is straightforward in principle, but there are some complications arising from the dilution of the host galaxy starlight by nonthermal emission. For the observations presented here, the detected flux within the spectroscopic aperture is nonthermal continuum emission. As a result, a BL Lac object spectrum yields a more uncertain velocity dispersion than a normal galaxy spectrum of the same signal-to-noise (S/N) ratio. Furthermore, Galactic or telluric absorption features, if not corrected for, will have a relatively larger impact on the velocity dispersion measurements for the BL Lac objects.
We measured the velocity dispersions of the BL Lac hosts by fitting broadened stellar spectra to the object spectra, following a method similar to those described by van der Marel (1994), Rix et al. (1995), and Kelson et al. (2000). The object and template spectra are first rebinned to a wavelength scale that is linear in , and the object spectrum is transformed to zero redshift. The template spectrum is broadened by convolution with a Gaussian, and adjusted to match the galaxy spectrum by adding a linear featureless continuum and multiplying by a low-order polynomial. The fit includes six free parameters: the systemic velocity of the galaxy, the width of the Gaussian broadening function, the normalization and slope of the featureless continuum, and the three coefficients of a quadratic polynomial. Multiplication by the polynomial allows the fit to account for any reddening or other differences in overall spectral shape between the galaxy and the template, without introducing any high-frequency structure that might affect the dispersion measurement. The fit is optimized using a downhill simplex algorithm (Press et al., 1988). For each template, the fit is repeated several times with a range of initial parameter values to ensure that the global minimum of is found. The uncertainty for each template is determined by finding how far the velocity dispersion must be varied from its best-fit value (with all other parameters allowed to float freely) in order to increase by unity relative to its minimum value.
The wavelength range for the fits was selected to include the regions most sensitive to the stellar velocity dispersion. For each object, we attempted to use the largest wavelength range over which a good fit could be achieved, excluding emission lines or regions that consistently gave poor fits with a range of template stars. In general, velocity dispersions measured from the Ca triplet lines are preferred, if they can be observed, because the Ca triplet is less sensitive to template mismatch than the blue spectral region (Dressler, 1984). Also, the Ca triplet lines are intrinsically strong and well isolated from neighboring lines, and can be detected even in highly diluted spectra. For the lowest-redshift objects (Mrk 421, Mrk 501, and 2201+044), we used the Ca triplet lines to measure .
At recession velocities beyond km s-1, the Ca II line is redshifted into deep telluric water vapor absorption bands that begin at about 8925 Å. Reliable velocity dispersions can still be measured using the Ca lines at 8498 and 8542 Å out to km s-1. For the objects having larger redshifts, we used the region around Mg Ib to measure the velocity dispersions. Best results were obtained for the region Å, which contains reasonably strong features due to Ca and Fe. We also included a wavelength range just blueward of Mg Ib in the fit, typically Å, for four objects having sufficient S/N in this region. The wavelength region was adjusted for some objects to exclude Galactic absorption features or bad pixels, or to include a wider wavelength range when a good fit could be obtained.
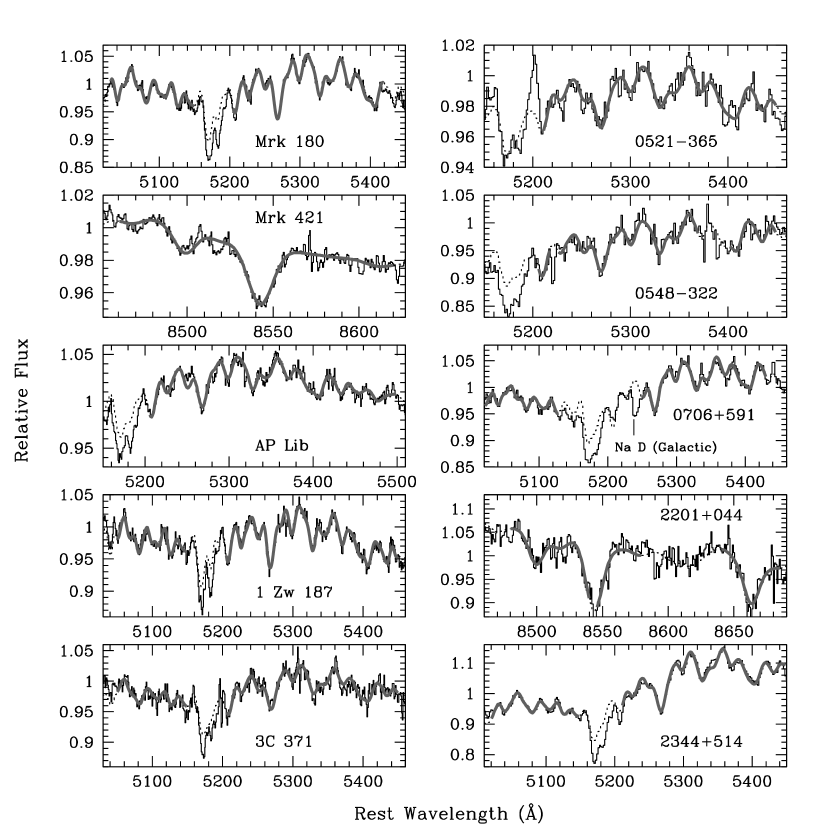
It proved impossible to fit both the Å region (which contains the Fe 5270 and Fe 5335 blends) and the Mg Ib line simultaneously. This is a consequence of the correlation between the [Mg/Fe] ratio and velocity dispersion in elliptical galaxies (Worthey, Faber, & Gonzalez, 1992; Trager et al., 1998; Kuntschner et al., 2001). Since the Mg lines increase in strength more steeply than do the Fe lines as a function of , it is difficult to find local template stars that will provide an exact match to the [Mg/Fe] ratio of any individual giant elliptical galaxy. This source of template mismatch is a particular problem for direct fitting measurements, since the calculation of is sensitive to both the width and the depth of absorption lines. Thus, we excluded the Mg Ib line from the fits, preferring to fit the larger surrounding region. Barth et al. (2002b) discuss the [Mg/Fe] template matching problem in further detail, using spectra of nearby galaxies obtained during the same observing runs. The best fits for each object are shown in Figure 1.
The dominant contribution to the measurement uncertainty in most cases is template mismatch, since the scatter in measurements for different templates is generally larger than the fitting uncertainty for a single template. The final velocity dispersions listed in Table 2 are the weighted mean of values measured with several templates of type G8–K5. To account for template matching errors, the measurement error for each galaxy is the sum in quadrature of the fitting error for the best-fitting template and the standard deviation of the measurements for all templates.
There is one additional source of systematic uncertainty that contributes significantly to the error budget. As discussed by Barth et al. (2002b), tests on high S/N spectra of nearby galaxies demonstrate that our fitting results for the Mg Ib region are somewhat sensitive to the order of the polynomial that is used to match the continuum shape of the template to the galaxy. For polynomial orders of 2, 3, or 4, we find variations in the derived value of at the 5% level. To account for this systematic uncertainty in the model fits, we add in quadrature to the uncertainties on each measurement of derived from the blue spectral region. The Ca triplet measurements are much less sensitive to the polynomial order, with variations at the level of .
Another potential source of systematic error is the variation of the instrumental linewidth across the detector, since a given spectral feature will fall on a different portion of the CCD for different redshifts. This would have the largest effect on the Palomar blue side measurements with the 600 line grating, which was the setting with the lowest spectral resolution, and also with the largest focus variations across the detector. From examination of comparison lamp spectra, we estimate that the maximum variation in instrumental dispersion over the region used for the measurements is km s-1 in this setting. Since the instrumental dispersion contributes in quadrature to the total observed linewidth, these variations will have a very small impact on the final measurements. For the higher-dispersion settings the impact of focus variations on the measurements will be negligible.
3.1 Tests of the Measurement Routine
At Palomar, we also observed six velocity dispersion standard galaxies from the catalog of McElroy (1995), with ranging over km s-1, as a check on the fitting routine. The results are listed in Table 3. The blue and red side measurements for each galaxy agree within their uncertainty ranges. We find good agreement between our measurements and the average velocity dispersion data compiled by McElroy for four of the six galaxies, while our dispersions for NGC 4579 and NGC 4736 are significantly lower than the McElroy average values. However, in both cases our measurements for these objects do fall in the range of previously measured values as listed in the Hypercat database,111The Hypercat database can be found at http://www-obs.univ-lyon1.fr/hypercat/ . and the close agreement between the blue and red measurements suggests that our values of do give an accurate measure of the velocity dispersion within the observed aperture. We believe that the differences between our results and the mean catalog results for these galaxies are due to individual, discrepant measurements that are included in the catalog average velocity dispersions. A full description of the nearby galaxy measurements is given by Barth et al. (2002b).
Our observations have a wide range in S/N, and one possible concern is that at low S/N the fitting routine could be biased in a systematic way. To test the accuracy of the results, we performed Monte Carlo simulations to determine how well we could recover the correct velocity dispersion as a function of S/N. Starting with the Palomar blue side spectrum of NGC 2841, which was observed with the 1200 line grating, we added a featureless continuum normalized to contribute 2/3 of the total flux at 5500 Å. Then, Poisson noise was added to the spectrum to achieve a desired S/N ratio. For each value of the S/N ratio (ranging from 500 to 50 per pixel), we created 100 realizations of the diluted, noise-added spectrum and measured their velocity dispersions using the same measurement routine and fitting over the wavelength ranges 5050–5150 and 5205–5450 Å. Ten template stars were used for each measurement.
Measurement of the original spectrum gives km s-1, in good agreement with previous results from the literature (McElroy, 1995). The results of the Monte Carlo calculations are displayed in Figure 2. At each S/N ratio, we computed the weighted average and the standard deviation of the velocity dispersion measurements for the 100 realizations of the spectrum. Over the full range of S/N used in the calculations, the mean velocity dispersion is within km s-1 of the expected result (229 km s-1), demonstrating that there is no systematic offset as a function of S/N. As expected, the scatter in the measurements rises at low S/N, but for S/N ¿ 100 per pixel the standard deviation is less than 15 km s-1. All but one of our observations have S/N ¿ 100 per pixel, so the expected measurement error is not large. The actual expected error for any measurement is a function of the S/N, dilution, spectral resolution, and velocity dispersion, and we do not attempt to calculate it in more detail, but the simulations demonstrate that the template fitting routine should work well for our data.
3.2 Notes on Individual Objects
Mrk 421: The Ca triplet lines are easily detected and we found a good fit to the Å profile for km s-1. The line was not used in the fit as the telluric H2O absorption beyond 8900 Å could not be adequately removed from the spectrum by standard star division. The blue side spectrum was more strongly diluted by nonthermal light than the other galaxies in the sample, and it proved difficult to obtain an adequate fit. For five template stars, the blue side data yields km s-1. Thus, we use the red side measurement as our final result.
Mrk 501: The Ca II triplet region gives km s-1, where the uncertainty range includes the scatter among 24 template stars ranging between F3 and K5 and including giants, subgiants, and dwarfs (Paper I). In the blue spectral range, the best-fitting template (HD 125560, a K3III star) gives km s-1 over 5200-5600 Å, and the standard deviation of results with all templates is 81 km s-1. However, if we restrict the fitting to only G and K giants, the scatter is reduced to km s-1.
During the night that Mrk 501 was observed, the blue side flatfield structure shifted on the detector along the dispersion direction, presumably due to mechanical flexure in the spectrograph. We observed dome and internal flats in the afternoon. Objects observed during the first half of the night flattened well, but in objects observed during the second half of the night (including Mrk 501) there were some residual bumps in the flattened images at the level at Å. Although this did not visibly affect the region used to measure , and the blue and red side measurements are in agreement, we consider the red side measurement to be more reliable and we use it as our best estimate of .
A Hubble Space Telescope (HST) image of Mrk 501 was taken as part of the snapshot survey of Scarpa et al. (2000) and Urry et al. (2000), but it was not included in the analysis of their HST sample. To measure the structural parameters of the host galaxy, we downloaded the images from the HST data archive. There are 5 separate exposures with exposure times of 2 s, s, and s, all with the F702W filter (similar to ground-based ). The nucleus is saturated in the 30 s and 120 s exposures. We combined the 120 s exposures, eliminating cosmic-ray hits, and used the galfit program (Peng et al., 2002) to perform a two-dimensional fit to the host galaxy profile. The model used in the fit was a de Vaucouleurs (1948) profile combined with an unresolved nuclear point source, convolved with a synthetic point-spread function (PSF) generated by the Tiny Tim program (Krist & Hook, 2001). Saturated pixels at the nucleus were masked out in the fits to the longer exposure. For consistency with the Urry et al. (2000) sample, we converted the F702W filter magnitude to the Cousins band with the synphot package in IRAF, using a redshifted elliptical galaxy spectrum to calculate the correction. The total host galaxy magnitude is mag, in good agreement with the ground-based measurement of Wurtz, Stocke, & Yee (1996). The fit gives an effective radius of , substantially smaller than previous ground-based measurements (Nilsson et al., 1999); the comparison between ground-based and HST measurements of is discussed further in §5.
0521–365 and 0548–322: During the Magellan run, only one K-giant stellar template was observed (HR 1629, K4III). To allow for template mismatch error, we add 20 km s-1 in quadrature to the uncertainty in the velocity dispersion measurement from this template.
0706+591: At , this is the most distant object in the sample. Galactic Na D absorption falls in the region used to measure and is excluded from the fit. The broad H2O telluric absorption band between 5870 and 6000 Å also falls in this region. We could not entirely exclude this band from the fit as it covers the most useful portion of the spectrum; inclusion of part of the telluric band in the fitting region is probably responsible for the relatively poor fit in the neighborhood of the Mg Ib line. The measurement yields km s-1. As a check on this result, we also performed a fit over the region 4920–5150 Å (excluding a 20 Å region around [O III] although this line was not clearly detected), and found km s-1.
2201+044: The core of the Ca II absorption line falls on a night sky emission line and the extracted spectrum has a sharp negative “spike” at this wavelength. We masked out a 5 Å-wide region surrounding this spike in the final fit, but the measured value of changes by less than 10% if the entire line is included in the fit. Over the wavelength range used for the fit there are several extremely weak telluric absorption features with expected equivalent widths less than 0.02 Å. They were not masked out in the fit, since their amplitudes are smaller than the noise level in the data.
3.3 Comparison with the results of Falomo et al.
FKT reported velocity dispersion measurements for seven BL Lac objects, six of which are in our sample. Comparison of the results shows close agreement for some galaxies such as Mrk 421, but also some surprisingly large differences. The worst disagreement is found for Mrk 501 and 1 Zw 187. For these two galaxies, FKT find = 291 and 253 km s-1, respectively, while we obtain = 372 and 171 km s-1. FKT suggest that the different results for Mrk 501 could be the result of telluric absorption features in our red spectrum. However, this is not the case because we excluded these telluric lines from the fitting region, as described in Paper I. Different aperture sizes cannot be the cause of such large discrepancies either. FKT used a 1″ slit and extraction widths of , similar to the aperture sizes we used, and the resulting variations in should be below the 10% level in most cases (Gebhardt et al., 2000a; Merritt & Ferrarese, 2001).
FKT used the Fourier quotient routine in IRAF which, in principle, should yield the same results on the same data as a direct fitting routine. However, their measurements were carried out over a much wider wavelength range containing different spectral features. They used two grating settings for their measurements: 4800–5800 Å and 5700–8000 Å (setups “A” and “B”, respectively). These ranges include H and H, which are among the strongest absorption features in the spectrum but which also appear in emission in some objects. They also contain other possible emission features including [O III] . (In our sample of 11 objects, [O III] emission is clearly visible in five, and H in three.) FKT removed emission lines from their spectral by connecting a linear continuum across the wavelength range spanned by the emission lines. This is a very poor approximation to the true starlight spectrum of the galaxy, particularly for the Balmer lines, and may adversely effect the results. It would have been preferable to replace the emission lines with the spectra of appropriately broadened template stars (van der Marel & Franx, 1993) or with spectra of galaxies having similar velocity dispersion and line strength (Dalle Ore et al., 1991), or instead to perform the fit over a wavelength range that is devoid of emission lines. Even when H and H emission are not clearly visible in the spectra, they could still partially fill in the Balmer absorption lines and affect the measurements.
The strongest absorption feature in the wavelength range used by FKT is the Na D doublet at 5890, 5896 Å, but this could have a contribution from interstellar absorption in the host galaxies. There is Galactic interstellar Na D absorption in some objects as well; our spectra reveal strong Galactic Na D absorption in Mrk 421, and weak absorption in 0706+591. With the Fourier quotient routine there is no entirely satisfactory way to exclude such a feature from the measurement. Since there are few other strong stellar features within a few hundred Å of Na D, this spectral region is considered to be one of the least useful portions of the optical spectrum for measuring velocity dispersions (Dressler, 1984). The weak telluric O2 and H2O absorption bands between 5800 and 6600 Å might also have a small effect on the measurements, especially in objects with a very high degree of dilution by nonthermal light.222See Fig. 16 of Matheson et al. (2000) for a plot of the telluric absorption spectrum over this wavelength range.
Whenever possible, our measurements were performed on regions selected to have good sensitivity to velocity dispersion without having significant contamination from nebular emission, interstellar absorption, or telluric absorption. A major advantage of the direct fitting method over the Fourier quotient method for these objects is that it provides direct visual feedback on the quality of the template match. This makes it possible to mask out regions which are not fit well by any template star, as well as telluric absorption bands and emission lines. We note, also, that our spectra have considerably higher S/N than those obtained by FKT; this enables us to perform our velocity dispersion measurements on a smaller spectral region. In summary, we believe that our velocity dispersion determinations are more accurate than those of FKT.
4 Black Hole Masses
To determine from the velocity dispersion, we use the recent fit to the relation from Tremaine et al. (2002), which is given by
This relation was derived using a carefully culled sample of the best-quality BH mass measurements, and using a fitting technique that properly accounts for uncertainties both in and .
The measurements used to calibrate the above relation were luminosity-weighted velocity dispersions measured in a slit aperture of length 2. However, our values of do not exactly correspond to this aperture size, and our spectra generally do not have sufficient sensitivity to measure outside the inner few arcseconds. Velocity dispersions can be corrected to a standard aperture size using the relations given by Jørgensen, Franx, & Kjærgaard (1995a), but these relations are not calibrated for long-slit apertures such as those used by Tremaine et al. (2002). Another difficulty is that the corrections depend on the effective radii, which are not known accurately for these objects. Rather than apply an uncertain correction to the measured velocity dispersions, we choose to use our measured dispersions directly to estimate . As shown by Gebhardt et al. (2000a), the value of measured from slit apertures of different length will differ from by less than 10% for typical, nearby elliptical galaxies.
The results are listed in Table 2, with uncertainties in determined by propagating the measurement uncertainty in as well as the uncertainties in the coefficients of the relation from Tremaine et al. (2002). We do not include the additional possible error due to intrinsic scatter in the relation, because the amount of scatter is not yet well determined. Tremaine et al. (2002) have determined that this intrinsic scatter is dex; it is hoped that future BH mass measurements with HST will provide a more definitive result. The masses range from to , with a median value of .
We emphasize that these black hole masses are indirect estimates, not dynamical measurements of the mass. Nevertheless, there is no strong reason to believe that the correlation would not apply to BL Lac objects. Imaging of BL Lacs with HST has demonstrated that the host galaxies are all apparently normal giant elliptical galaxies (Scarpa et al., 2000; Urry et al., 2000), in contrast to the disturbed morphologies seen in some QSO host galaxies (e.g., Bahcall et al., 1997). Thus, the stellar velocity dispersions in BL Lac objects should not be affected by recent mergers or other peculiarities. No nearby elliptical galaxies have yet been found to deviate strongly from the relation, so it would be very surprising if the BL Lac hosts did not follow the correlation. Furthermore, the upper end of the relation is largely calibrated with FR I radio galaxies, including M87 and NGC 4261, which presumably would appear as BL Lac objects if viewed along the jet, and there is no evidence for any offset in the correlation of radio galaxies in comparison with inactive ellipticals. Still, it would be a useful consistency check to perform stellar-dynamical measurements of in a few of the lowest-redshift BL Lac objects to confirm that these assumptions are indeed valid.
5 Discussion
According to unified models for radio-loud AGNs, BL Lac objects are FR I radio galaxies viewed along the jet axis (e.g., Urry & Padovani, 1995; Urry et al., 2000). If radio galaxies and BL Lac objects were derived from identical parent populations, then the distribution of black hole masses in BL Lac objects should be the same as that in nearby FR I radio galaxies. However, different selection effects for BL Lacs and radio galaxies might be expected to bias the BL Lac objects toward less massive and less luminous host galaxies. For example, Urry et al. (2000) point out that radio-loud AGNs with jets beamed in our direction might not be identified as BL Lac objects if they occur in very bright host galaxies so that their stellar continua are not diluted enough by nonthermal emission to match the standard defining criteria for classification as BL Lac objects. Thus, the naive expectation that BL Lac objects and radio galaxies should have identical distributions of black hole masses or other host galaxy properties is likely to be an oversimplification. Such differences do not violate the basic premise of unified models, as long as objects classified as BL Lacs would still appear to be normal radio galaxies when viewed from an oblique angle.
As a comparison sample of nearby radio galaxies, we use the compilation by Bettoni et al. (2001, 2002). While this is not a complete sample in any sense, it is still the largest sample of nearby radio galaxies for which velocity dispersions, effective radii, and surface brightnesses are available. Figure 3 shows the distribution of velocity dispersions for the BL Lac objects and the radio galaxy sample of Bettoni et al. (2001). As demonstrated previously by FKT, the radio galaxies and BL Lac objects occupy a similar range of values of , and therefore . The two samples have nearly the same mean velocity dispersion, 247 km s-1 for the BL Lac objects and 256 km s-1 for the radio galaxies. A Kolmogorov-Smirnov test (Press et al., 1988) on the two distributions shows that the hypothesis of identical parent populations for the two distributions can only be rejected at the 9% confidence level. Thus, the two distributions appear to be indistinguishable within the limited statistics, but since sample incompleteness and selection effects are not accounted for in any way, we caution that this comparison does not lead to any firm conclusions regarding the nature of the two populations.
Our sample consists of three low-frequency-peaked (LBL) and eight high-frequency-peaked (HBL) objects. Figure 3 illustrates that, in agreement with FKT, there is no large systematic offset between the black hole masses in LBL and HBL objects. The LBL and HBL objects in our sample have ¡¿ = 238 and 235 km s-1, respectively. Similarly, HST images do not reveal any differences in the host galaxy magnitudes of these blazar subtypes either (Urry et al., 2000).
The HST imaging survey of BL Lac objects by Scarpa et al. (2000) and Urry et al. (2000) demonstrated that the host galaxies appear to be morphologically normal ellipticals. The morphological and dynamical properties of elliptical galaxies are linked via the fundamental plane (FP) relations (Djorgovski & Davis, 1987; Dressler et al., 1987). Therefore, by combining the velocity dispersions with magnitudes and effective radii, we can test whether the BL Lac host galaxies fall on the same FP as normal ellipticals. For consistency with Urry et al. (2000) and Bettoni et al. (2001), we use km s-1 Mpc-1.
One source of uncertainty in such a comparison comes from the fact that the effective radii measured from ground-based images and from the HST snapshot survey of Scarpa et al. (2000) and Urry et al. (2000) are in severe disagreement for some of the galaxies in our sample. Table 4 lists the effective radii from the HST survey, and from ground-based imaging from various sources in the literature. The ground-based measurements of are nearly always larger than the HST measurements. In the worst case (3C 371), the disagreement is a factor of 5.
The main advantage of the HST images is the narrow PSF core which makes it possible to determine the point-source flux accurately, but the HST measurements are hindered by the small field of view of the WFPC2 Planetary Camera (PC) detector (35″ square), and brief exposures of 200 to 1300 s. High-quality ground based imaging (e.g., Nilsson et al., 1999) demonstrates that the host galaxies of the nearest objects are indeed large enough to completely fill the PC chip. As a result, the sky background level determined from the outer portions of the detector will be contaminated by galaxy light, and measurements of the galaxy radial profile after subtraction of an artificially high sky background would lead to an underestimate of . This systematic effect could be largely responsible for the differences between the ground-based and HST measurements. The total host galaxy magnitudes are in better agreement, with differences of typically less than a few tenths of a magnitude. The problem of determining the host galaxy parameters for BL Lac objects from shallow HST images is somewhat analogous to the difficulty of detecting QSO host galaxies in short WFPC2 exposures, as discussed by McLeod & Rieke (1995). Nevertheless, it is clear that the ground-based measurements of are quite uncertain as well. The case of Mrk 501 illustrates the difficulty of measuring from the ground. Even though this is one of the nearest and best-resolved BL Lac objects, ground-based measurements of range from 9″ to 20″.
Figure 4 plots the FP for the BL Lac objects using the parameterization given by Bettoni et al. (2001) for low-redshift radio galaxies. Given the uncertainty in the measurements of , and the consequent uncertainty in (the average -band surface brightness enclosed within ), we plot the BL Lac objects using both the ground-based and HST measurements. The host galaxy magnitudes have been corrected for Galactic extinction and -corrected as described by Urry et al. (2000). The ground-based data included in the plot are from Abraham, McHardy, & Crawford (1991), Wurtz, Stocke, & Yee (1996), and Nilsson et al. (1999). For comparison, the radio galaxy sample of Bettoni et al. (2001) and the Coma cluster ellipticals observed by Jørgensen, Franx, & Kjærgaard (1995a, b) are also shown.
The overall agreement is very reasonable, considering the relatively large uncertainties in the measurements of and for the BL Lac objects. Changes in at fixed total magnitude result in displacement along a vector that is nearly parallel to the FP sequence; as a result both the ground-based and HST-based measurements appear consistent with the FP. In either case, most of the BL Lac objects fall within the scatter of the FP. The largest outlier is 3C 371 when plotted with the effective radius of 2.9 kpc from Urry et al. (2000); it deviates from the FP sequence by dex. However, ground-based measurements indicate an effective radius that is larger by a factor of five, and with the ground-based value of this galaxy falls nicely on the FP. Thus, despite the uncertainty in the effective radii, the host galaxies do appear to be normal elliptical galaxies.
The contrast between the ground-based and HST-based measurements of and can be seen more clearly by plotting projections of the FP onto the and axes, as shown in Figure 5. With the HST measurements, the BL Lac objects have effective radii comparable to the smallest radio galaxies, and most of the BL Lac hosts have brighter than 19 mag arcsec-2, in a region where very few radio galaxy hosts lie. The ground-based measurements place the BL Lac hosts in a region that overlaps much more closely with the radio galaxies, better matching expectations from unified models. However, the BL Lac objects are still displaced toward smaller radii than the largest radio galaxies; this is also apparent in Figure 4, where the BL Lac objects do not extend as far up the FP sequence as the radio galaxies. Similarly, Urry et al. (2000) noted that no BL Lac hosts are found to be as luminous as the most luminous hosts of FR I radio galaxies. This offset could be a consequence of selection effects, or might indicate an environmental effect disfavoring the formation of blazar jets in rich clusters (Urry et al., 2000).
The results presented here, and by FKT, strongly disagree with several recent estimates of in blazars based on other methods. Using variability timescales to estimate the size of the emission region, Xie et al. (1998) and Fan, Xie, & Bacon (1999) derive estimates of the black hole masses for several blazars that are in the range , much smaller than the masses obtained from the relation. Wang, Xue, & Wang (2002) have proposed a method to derive from the peak luminosity and frequency of the blazar emission. They conclude that HBL and LBL blazars have a bimodal distribution of , with masses of for HBL and for LBL objects. The stellar velocity dispersions imply black hole masses that are are completely inconsistent with this conclusion. Models that interpret periodicities in blazar light curves in terms of orbital motion of black hole binary systems (Rieger & Mannheim, 2000; De Paolis, Ingrosso, & Nucita, 2002) also give much smaller masses than those derived from the relation.
Xie et al. (2002) propose a new method to estimate black hole masses in BL Lac objects, based on the assumption that the observed variability timescale is determined by the orbital timescale near the innermost stable orbit around the black hole. They find masses ranging from to for 13 objects, in the same range as the masses we derive. Xie et al. show that their estimates are strongly correlated with the beamed nonthermal luminosity but not with the host galaxy luminosity. However, the opposite would be expected if BL Lac host galaxies follow the correlation of normal galaxies. Furthermore, Urry et al. (2000) show that there is no correlation between the nuclear and host galaxy luminosities for BL Lac objects, implying that the nonthermal luminosity should not be tightly correlated with if scales with host galaxy luminosity. Only two objects are in common between our sample and Xie et al., so it is not possible to perform a detailed comparison of the mass estimates, but we note that their upper limit to the black hole mass in 3C 371 is an order of magnitude lower than the mass we derive from the correlation.
Wu, Liu, & Zhang (2002) and Woo & Urry (2002) have recently published estimates of the BH masses in BL Lac objects by using the HST imaging survey results to obtain approximate velocity dispersions via the FP relation, and then applying the relation to estimate . The advantage of this method is that it can be easily applied to a large number of objects, as there are over 60 BL Lac objects with morphological parameters measured from the HST survey. However, there are some potential disadvantages as well, since the estimates are limited by the accuracy of the host galaxy decompositions and by the intrinsic scatter in the FP. In both cases, the FP-derived estimates of are systematically larger than our measured values. For objects in common with our sample, the Wu et al. estimates of are higher than our values by 30% on average, and the Woo & Urry estimates are higher by 74%. The most severe disagreement is for 3C 371; for this object Wu et al. predict km s-1 and Woo & Urry predict 618 km s-1, in comparison with our measured value of km s-1. This illustrates the need for accurate values of and when applying this method.
Determining the Eddington ratio in BL Lac objects can give important clues to the physical structure of their accretion flows. It would be interesting to search for systematic differences between LBL and HBL objects; this could yield new constraints for models of the spectral energy distributions (e.g., Ghisellini et al., 1998; Böttcher & Dermer, 2002). Unfortunately, it is particularly difficult to measure the bolometric luminosity of the unbeamed AGN core in BL Lac objects that are dominated by the beamed nonthermal emission from the jet. One alternative is to use the emission lines as a measure of the ionizing luminosity, because the emission-line flux is the only unbeamed component of the AGN that can be directly observed. This method is not ideal since there is no single emission line that can be observed in all objects; in practice the only viable alternative is to use the lines that are detected and perform a rough conversion either to a total broad-line region luminosity (Celotti, Padovani, & Ghisellini, 1997) or to a single line such as H (Cao, 2002). For our sample, broad-line fluxes are available only for a few objects, while a few others have [O III] emission detected. Given this small number of objects and the large uncertainties involved in comparing the luminosities of different emission lines, we are unable to perform any meaningful comparison of the Eddington ratios of the HBL and LBL objects in our sample. This would be a useful objective for future work if stellar velocity dispersions and emission-line luminosities can be measured for larger samples of BL Lac objects.
6 Conclusions
Our conclusions are summarized as follows:
1. Stellar velocity dispersions in low-redshift BL Lac objects are in the range km s-1. Using the Tremaine et al. (2002) fit to the relation, the corresponding black hole masses are to .
2. Measurement of velocity dispersions in BL Lac objects requires particular care in selecting spectral regions that are sensitive to but are not severely affected by interstellar absorption lines, telluric absorption bands, or emission lines. Due to the dilution by nonthermal emission, high S/N (typically per pixel in the extracted spectrum) is required for accurate measurements with a direct template-fitting method.
3. The distribution of velocity dispersions in BL Lac objects appears superficially similar to that of the radio galaxy sample of Bettoni et al. (2001), indicating a similar distribution of black hole masses for the two samples. However, neither sample is statistically well defined or complete in any sense and we caution against drawing conclusions about radio-loud AGNs in general from this limited comparison.
4. There does not appear to be any systematic difference between the black hole masses in HBL and LBL objects.
5. The host galaxies of BL Lac objects lie on the fundamental plane of nearby elliptical galaxies. We do not find any BL Lac objects near the top of the fundamental plane sequence in the region occupied by the most luminous hosts of FR I radio galaxies; this may be a consequence of selection effects in the identification of BL Lac objects.
6. For nearby, well-resolved BL Lac objects, the host galaxy effective radii measured in the HST WFPC2 snapshot survey of Scarpa et al. (2000) and Urry et al. (2000) are systematically smaller than effective radii measured from deeper ground-based images. We suggest that the measurements of from the HST snapshot survey images may be biased toward underestimates of the true radii, because they were derived from shallow exposures that did not detect the faint outer envelopes of the host galaxies that are seen in deep ground-based images.
References
- Abraham, McHardy, & Crawford (1991) Abraham, R. G., McHardy, I. M., & Crawford, C. S. 1991, MNRAS, 252, 482
- Bahcall et al. (1997) Bahcall, J. N., Kirhakos, S., Saxe, D. H., & Schneider, D. P. 1997, ApJ, 497, 658
- Barth, Ho, & Sargent (2002a) Barth, A. J., Ho, L. C., & Sargent, W. L. W. 2002a, ApJ, 566, L13 (Paper I)
- Barth et al. (2002b) Barth, A. J., Ho, L. C., & Sargent, W. L. W. 2002b, AJ, in press
- Bettoni et al. (2001) Bettoni, D., Falomo, R., Fasano, G., Govoni, F., Salvo, M., & Scarpa, R. 2001, A&A, 380, 471
- Bettoni et al. (2002) Bettoni, D., Falomo, R., Fasano, G., Govoni, F., Salvo, M., & Scarpa, R. 2002, A&A, 392, 393
- Boroson (2002) Boroson, T. A. 2002, ApJ, 565, 78
- Böttcher & Dermer (2002) Böttcher, M., & Dermer, C. D. 2002, ApJ, 564, 86
- Cao (2002) Cao, X. 2002, ApJ, 570, L13
- Celotti, Padovani, & Ghisellini (1997) Celotti, A., Padovani, P., & Ghisellini, G. 1997, MNRAS, 286, 415
- Dalle Ore et al. (1991) Dalle Ore, C., Faber, S. M., Jesús, J., Stoughton, R., & Burstein, D. 1991, ApJ, 366, 38
- De Paolis, Ingrosso, & Nucita (2002) De Paolis, F., Ingrosso, G., & Nucita, A. A. 2002, A&A, 388, 470
- de Vaucouleurs (1948) de Vaucouleurs, G. 1948, Ann. d’Ap., 11, 247
- Djorgovski & Davis (1987) Djorgovski, S., & Davis, M. 1987, ApJ, 313, 59
- Dressler (1984) Dressler, A. 1984, ApJ, 286, 97
- Dressler et al. (1987) Dressler, A., Lynden-Bell, D., Burstein, D., Davies, R. L., Faber, S. M., Terlevich, R. J., & Wegner, G. 1987, ApJ, 313, 42
- Falomo & Kotilainen (1999) Falomo, R., & Kotilainen, J. K. 1999, A&A, 352, 85
- Falomo, Kotilainen, & Treves (2002) Falomo, R., Kotilainen, J. K., & Treves, A. 2002, ApJ, 569, L35 (FKT)
- Fan, Xie, & Bacon (1999) Fan, J. H., Xie, G. Z., & Bacon, R. 1999, A&AS, 136, 13
- Ferrarese, Ford, & Jaffe (1996) Ferrarese, L., Ford, H. C., & Jaffe, W. 1996, ApJ, 470, 444
- Ferrarese & Merritt (2000) Ferrarese, L., & Merritt, D. 2000, ApJ, 539, L9
- Ferrarese et al. (2001) Ferrarese, L., Pogge, R. W., Peterson, B. M., Merritt, D., Wandel, A., & Joseph, C. L. 2001, ApJ, 555, L79
- Gebhardt et al. (2000a) Gebhardt, K., et al. 2000a, ApJ, 539, L13
- Gebhardt et al. (2000b) Gebhardt, K., et al. 2000b, ApJ, 543, L5
- Ghisellini et al. (1998) Ghisellini, G., Celotti, A., Fossati, G., Maraschi, L., & Comastri, A. 1998, MNRAS, 301, 451
- Horne (1986) Horne, K. 1986, PASP, 98, 609
- Jørgensen, Franx, & Kjærgaard (1995a) Jørgensen, I., Franx, M., & Kjærgaard, P. 1995a, MNRAS, 276, 1341
- Jørgensen, Franx, & Kjærgaard (1995b) Jørgensen, I., Franx, M., & Kjærgaard, P. 1995b, MNRAS, 273, 1097
- Kelson et al. (2000) Kelson, D. D., Illingworth, G. D., van Dokkum, P. G., & Franx, M. 2000, ApJ, 531, 159
- Kormendy & Gebhart (2001) Kormendy, J., & Gebhardt, K. 2001, in The 20th Texas Symposium on Relativistic Astrophysics, ed. H. Martel & J. C. Wheeler (New York: AIP), 363
- Krist & Hook (2001) Krist, J., & Hook, R. 2001, The Tiny Tim User’s Guide (Baltimore: STScI)
- Kuntschner et al. (2001) Kuntschner, H., Lucey, J. R., Smith, R. J., Hudson, M. J., & Davies, R. L. 2001, MNRAS, 323, 615
- Laor (2000) Laor, A. 2000, ApJ, 543, L111
- Magorrian et al. (1998) Magorrian, J., et al. 1998, AJ, 115, 2285
- Matheson et al. (2000) Matheson, T., Filippenko, A. V., Ho, L. C., Barth, A. J., & Leonard, D. C. 2000, AJ, 120, 1499
- McElroy (1995) McElroy, D. B. 1995, ApJS, 100, 105
- McLeod & Rieke (1995) McLeod, K. K., & Rieke, G. H. 1995, ApJ, 454, L77
- Merritt & Ferrarese (2001) Merritt, D., & Ferrarese, L. 2001, ApJ, 547, 140
- Nelson (2000) Nelson, C. H. 2000, ApJ, 544, L91
- Nilsson et al. (1999) Nilsson, K., Purismo, T., Takalo, L. O., Sillanpää, A., Pietilä, H., & Heidt, J. 1999, PASP, 111, 1223
- Oke & Gunn (1982) Oke, J. B., & Gunn, J. 1982, PASP, 94, 586
- Peng et al. (2002) Peng, C. Y., Ho, L. C., Impey, C. D., & Rix, H.-W. 2002, AJ, 124, 266
- Press et al. (1988) Press, W. H., Flannery, B. P., Teukolsky, S. A., & Vetterling, W. T. 1988, Numerical Recipes in C (Cambridge: Cambridge University Press)
- Purismo et al. (2002) Purismo, T., Nilsson, K., Takalo, L. O., Sillanpää, A., Heidt, J,. & Pietilä, H. 2002, A&A, 381, 810
- Rieger & Mannheim (2000) Rieger, F. M., & Mannheim, K. 2000, A&A, 359, 948
- Rix et al. (1995) Rix, H.-W., Kennicutt, R. C., Braun, R., & Walterbos, R. A. M. 1995, ApJ, 438, 155
- Scarpa et al. (2000) Scarpa, R., Urry, C. M., Falomo, R., Pesce, J. E., & Treves, A. 2000, ApJ, 532, 740
- Schlegel, Finkbeiner, & Davis (1998) Schlegel, D. J., Finkbeiner, D. P., & Davis, M. 1998, ApJ, 500, 525
- Smith, Heckman, & Illingworth (1990) Smith, E. P., Heckman, T. M., & Illingworth, G. D. 1990, ApJ, 356, 399
- Stickel, Fried, & Kühr (1993) Stickel, M., Fried, J. W., & Kühr, H. 1993, A&AS, 98, 393
- Trager et al. (1998) Trager, S. C., Worthey, G., Faber, S. M., Burstein, D., & González, J. J. 1998, ApJS, 116, 1
- Tremaine et al. (2002) Tremaine, S., et al. 2002, ApJ, 574, 740
- Urry & Padovani (1995) Urry, C. M., & Padovani, P. 1995, PASP, 107, 803
- Urry et al. (2000) Urry, C. M., Scarpa, R., O’Dowd, M., Falomo, R., Pesce, J. E., & Treves, A. 2000, ApJ, 532, 816
- van der Marel (1994) van der Marel, R. P. 1994, MNRAS, 270, 271
- van der Marel & Franx (1993) van der Marel, R. P., & Franx, M. 1993, ApJ, 407, 525
- Vermeulen et al. (1995) Vermeulen, R. C., Ogle, P. M., Tran, H. D., Brown, I. W. A., Cohen, M. H., Readhead, A. C. S., Taylor, G. B., & Goodrich, R. W. 1995, ApJ, 452, L5
- Wade & Horne (1988) Wade, R. A., & Horne, K. 1988, ApJ, 324, 411
- Wang, Xue, & Wang (2002) Wang, J.-M., Xue, S.-J., & Wang, J.-C. 2002, ApJ, submitted (astro-ph/0111209)
- Woo & Urry (2002) Woo, J.-H., & Urry, C. M. 2002, AJ, in press
- Worthey, Faber, & Gonzalez (1992) Worthey, G., Faber, S. M., & Gonzalez, J. J. 1992, ApJ, 398, 69
- Wu, Liu, & Zhang (2002) Wu, X.-B., Liu, F. K., & Zhang, T. Z. 2002, A&A, 389, 742
- Wurtz, Stocke, & Yee (1996) Wurtz, R., Stocke, J. T., & Yee, H. K. C. 1996, ApJS, 103, 109
- Xie et al. (1998) Xie, G. Z., Bai, J. M., Zhang, X., & Fan, J. H. 1998, A&A, 334, L29
- Xie et al. (2002) Xie, G. Z., Liang, E. W., Xie, Z. H., & Dai, B. Z. 2002, AJ, 123, 2352
| Observing | UT Date | Telescope | Slit | Grating | Plate Scale | (instrumental) | |
|---|---|---|---|---|---|---|---|
| Run | (″) | (grooves mm-1) | (Å) | (Å pixel-1) | (km s-1)aaInstrumental dispersion for a source uniformly filling the slit, measured from the widths of comparison lamp lines at 5500 Å or 8600 Å. | ||
| 1 | 2001 Jun 24 | P200 | 2 | Blue: 600 | 1.72 | 115 | |
| Red: 1200 | 0.63 | 25 | |||||
| 2 | 2001 Nov 9 | du Pont | 1 | 832 | 0.72 | 25 | |
| 3 | 2002 Jan 22 | P200 | 2 | Blue: 600 | 1.72 | 115 | |
| Red: 1200 | 0.63 | 25 | |||||
| 4 | 2002 Jan 24-26 | P200 | 2 | Blue: 1200 | 0.88 | 60 | |
| Red: 1200 | 0.63 | 25 | |||||
| 5 | 2002 Feb 19-20 | Baade | 1 | 600 | 1.56 | 91 |
| Object | Type | Run | Exposure | Extraction | Seeing | S/N | |||
|---|---|---|---|---|---|---|---|---|---|
| (s) | (″) | (″) | (km s-1) | ||||||
| Mrk 180 | H | 0.045 | 4 | 5400 | 5.0 | 1.5–2.0 | 130 | ||
| Mrk 421 | H | 0.030 | 3 | 10800 | 5.0 | 2 | 310 | ||
| Mrk 501 | H | 0.034 | 1 | 12600 | 3.7 | 1.5 | 305 | ||
| AP Lib | H | 0.049 | 4 | 4850 | 5.0 | 2 | 160 | ||
| 1 Zw 187 | H | 0.055 | 4 | 5400 | 5.0 | 1.5–2.0 | 100 | ||
| 3C 371 | L | 0.051 | 4 | 3600 | 5.0 | 3–5 | 110 | ||
| 0521–365 | L | 0.055 | 5 | 1800 | 2.5 | 0.7–1.0 | 165 | ||
| 0548–322 | H | 0.069 | 5 | 3600 | 2.5 | 0.7–1.0 | 130 | ||
| 0706+591 | H | 0.125 | 3 | 10800 | 5.0 | 2 | 160 | ||
| 2201+044 | L | 0.027 | 2 | 7200 | 4.2 | 1.0–1.5 | 50 | ||
| 2344+514 | H | 0.044 | 3 | 5400 | 5.0 | 2 | 170 |
Note. — Blazar type is H = high-frequency peaked, or L = low-frequency peaked. Classifications are from the catalog of Scarpa et al. 2000, and redshifts are from NED. S/N is the average signal-to-noise ratio per pixel in the extracted spectrum, over the region used to measure the velocity dispersion. For Mrk 501, the S/N value is listed for the red side exposure from Paper I. Black hole masses are calculated using the fit to the relation by Tremaine et al. (2002).
| Galaxy | (km s-1) | ||
|---|---|---|---|
| Red | Blue | McElroy (1995) | |
| NGC 2841 | |||
| NGC 4278 | |||
| NGC 4321 | |||
| NGC 4374 | |||
| NGC 4579 | |||
| NGC 4736 | |||
Note. — Data are from the June 2001 and January 2002 Palomar runs. Comparison results from the literature are taken from the compilation by McElroy (1995). The uncertainty ranges quoted by McElroy represent the scatter among measurements taken from the literature for each galaxy.
| Galaxy | (HST) | (ground) and Reference |
|---|---|---|
| (arcsec) | (arcsec) | |
| Mrk 180 | 7.1 (A91) | |
| Mrk 421 | 11 (N99) | |
| Mrk 501 | 9.3 (A91), 20.0 (S93), 9.0 (W96), 13 (N99), 17.2 (P02), 15 (FKT) | |
| AP Lib | 5.7 (A91), 8.7 (S93), 6.7 (P02) | |
| 1 Zw 187 | 3.9 (W96) | |
| 3C 371 | 10.5 (W96), 14.9 (S93), 10.8 (P02) | |
| 0521–365 | 3.4 (W96) | |
| 0548–322 | 7.7 (W96) | |
| 0706+591 | ||
| 2201+044 | 6.4 (F96), 7.6 (W96) | |
| 2344+514 | 8.5 (N99), 5.8 (F99) |
Note. — HST measurements are from Urry et al. (2000), except for Mrk 501 which is described in §3.2. Ground-based measurements are taken from the following sources. A91: Abraham, McHardy, & Crawford (1991). S93: Stickel, Fried, & Kühr (1993). W96: Wurtz, Stocke, & Yee (1996). F99: Falomo & Kotilainen (1999). N99: Nilsson et al. (1999). FKT: Falomo, Kotilainen, & Treves (2002). P02: Purismo et al. (2002).