Transit Target Selection Using Reduced Proper Motions
Abstract
In searches for planetary transits in the field, well over half of the survey stars are typically giants or other stars that are too large to permit straightforward detection of planets. For all-sky searches of bright stars, the fraction is . We show that the great majority of these contaminants can be removed from the sample by analyzing their reduced proper motions (RPMs): giants have much lower RPMs than dwarfs of the same color. We use Hipparcos data to design a RPM selection function that eliminates most evolved stars, while rejecting only 9% of viable transit targets. Our method can be applied using existing or soon-to-be-released all-sky data to stars in the northern hemisphere and in the south. The method degrades at fainter magnitudes, but does so gracefully. For example, at it can still be used to eliminate giants redward of , that is, the blue edge of the red giant clump.
1 Introduction
Spurred on by the detection of the transiting planetary companion to HD209458 (Charbonneau et al., 2000) as well as the exciting scientific results that can be extracted from intensive followup of this object (Charbonneau et al., 2002; Cody & Sasselov, 2002; Hui & Seager, 2002), a large number of surveys are underway to detect planetary transits of stars both in clusters (Street et al., 2000) and the field (Howell et al., 2000; Brown & Charbonneau, 1999; Mallen-Ornelas, 2001; Udalski et al., 2002; Street et al., 2002). The expected signature of a planetary transit, a drop in the stellar flux over a duration of several hours, can be mimicked by a variety of non-planetary phenomena. These include transits by brown dwarfs or late M dwarfs, which have sizes similar to Jovian planets, grazing eclipses by ordinary stars, full eclipses by binaries that are times fainter than the target star but lie in the same spatial resolution element, and transits of evolved stars by main-sequence stars. While it is sometimes possible to distinguish grazing eclipses from the flatter-bottomed transits using lightcurves of sufficient photometric precision, rejection of stellar eclipses and transits usually requires several spectra: an M star companion induces radial velocity (RV) variations of , whereas planetary perturbations are 10 to 100 times smaller.
Since obtaining these spectra is expensive in both telescope time and human effort, it is important to seek other robust methods of recognizing non-planetary transits. Here we show how the great majority of evolved stars can be eliminated from the target list of transit searches using reduced proper motion (RPM) diagrams. Field star transit surveys usually contain one to several times more evolved stars than main-sequence stars, while only the latter present useful targets. Hence, robust rejection of evolved-star contamination of transit surveys should result in substantial gains in efficiency in both the data analysis and the follow-up observations required for confirmation.
In § 2, we review the basic physical principles that allow one to recognize evolved stars from a RPM diagram. In § 3, we assemble an an all-sky catalog of transit targets . We show that our RPM criteria reject about 60% of the stars in this magnitude range that remain after an initial 25% are already rejected because their colors are too blue. That is, altogether 70% are rejected. In § 4, we establish the criteria for rejecting evolved stars using a combination of Tycho-2 (Høg et al., 2000) and 2MASS (Skrutskie et al., 1997) data. These criteria can be applied to stars over the whole sky once the full 2MASS catalog is released. In § 5, we show how the same technique can be extended to over the northern sky by combining 2MASS and UCAC (Zacharias et al., 2000) data, supplemented with data from the transit surveys themselves. We also show that the method degrades gracefully at fainter magnitudes, and can still be used to eliminate the majority of evolved stars at . While most of the paper focuses on the problem of selecting targets for transits of amplitude , we consider the possibility in § 6 that smaller amplitudes might be reached for brighter subsamples of the main survey. In this way, efficient transit searches might be extendable to stars of somewhat larger radius. Finally, in § 7, we briefly discuss our results.
2 Principles
Most ground-based transit surveys aim to detect transits with depths of about 1%, roughly the fraction of solar light blocked by Jupiter. Since planets, or even brown dwarfs, are not expected to get much larger than Jupiter, this level of sensitivity limits the parent-star population that can be probed with transits to those with radii . Early main-sequence (MS) stars and stars that have evolved significantly off the MS are not useful: 1% transits would then be due to other stars, not planets.
Broadly speaking, the contaminants can be divided into three spectral groups: early-type, mid-type (roughly “G-type”), and late-type. It is straightforward to eliminate early-type stars using a simple color cut, and in fact most survey teams already do this. Late-type stars come in two distinct classes, giants and dwarfs, which are separated by several magnitudes in absolute magntitude. In general, the parallaxes (and hence absolute magnitudes) of these stars are unknown, but if their proper motions are measured with sufficient accuracy, these classes can nevertheless be distinguished using a reduced proper motion (RPM) diagram. The band RPM, , is related to by
| (1) |
where is the proper motion in and is the transverse velocity. Hence, a RPM diagram looks similar to a standard color-magnitude diagram (CMD) but with greater scatter owing to the dispersion in . However, for colors at which the giants and dwarfs are separated by mag, this scatter is not sufficient to confuse the two populations.
Contamination from evolved G stars poses the most difficult problem. The MS and evolved populations are typically separated by just a couple of magnitudes. This is enough to make the evolved stars too large to permit transit detections, but not large enough to easily distinguish them from dwarfs of the same color using a RPM diagram. Some contamination from evolved G stars is therefore inevitable.
Figure 1 is a CMD of Hipparcos stars within the completeness limit and further restricted to parallax errors below 5% and photometry errors below 0.1 mag in each band. The solid line shows the location of stars with estimated radii , for which we use the formula,
| (2) |
Here, and are the Hipparcos passbands. To find the slope in this equation, we combine the van Belle (1999) scaling, , with the standard Hipparcos (ESA, 1997) transformation , and a transformation empirically determined by matching Hipparcos and 2MASS (Skrutskie et al., 1997) data over the relevant range . We normalize the zero point to the radius of the Sun, assuming it has and , which we obtain from the ESA (1997) transformations starting with , .
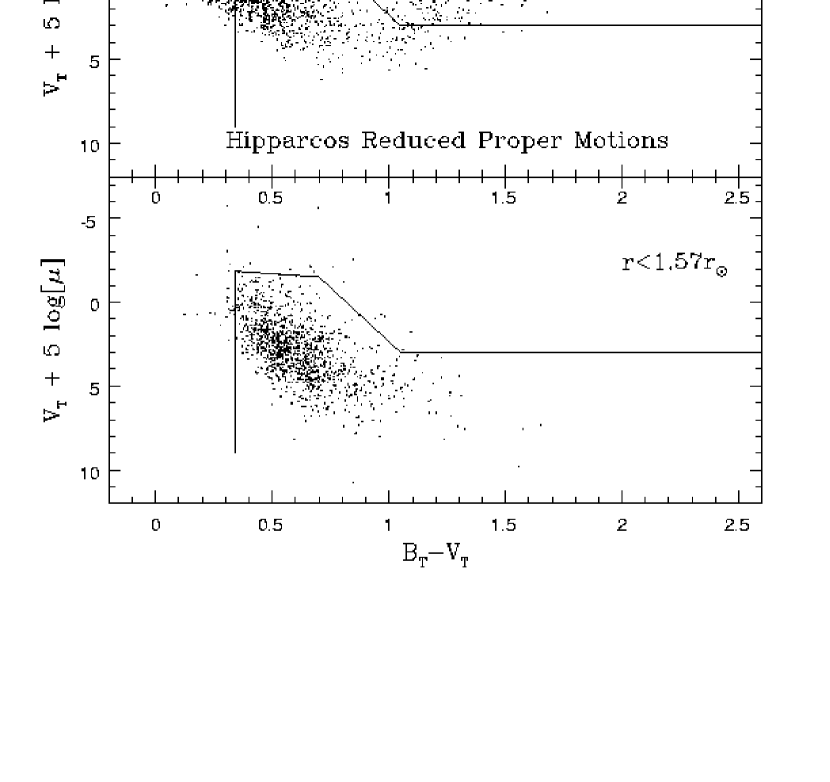
In Figure 2, we plot the RPMs of all the stars from Figure 1, the upper and lower panels showing respectively the stars with large and small radii. The object now is to design color/RPM criteria that will select the overwhelming majority of small stars while rejecting as many large stars as possible. The broken lines in the two panels show our attempt to define such a selection function.
What properties must a dataset have to allow one to apply this selelction function to it? The most important criterion is that stars with (i.e., ) must have proper motion errors that are substantially smaller than their typical proper motions. If their proper motions were measured to be consistent with zero, it would not be possible to distinguish them from evolved stars of the same color and apparent magnitude, which would then also have measured proper motions consistent with zero. Disk stars have typical transverse velocities . Therefore stars with have typical proper motions,
| (3) |
Second, the colors must be accurate enough to minimize scatter across the color boundary at .
3 Application to the Tycho-2 Catalog
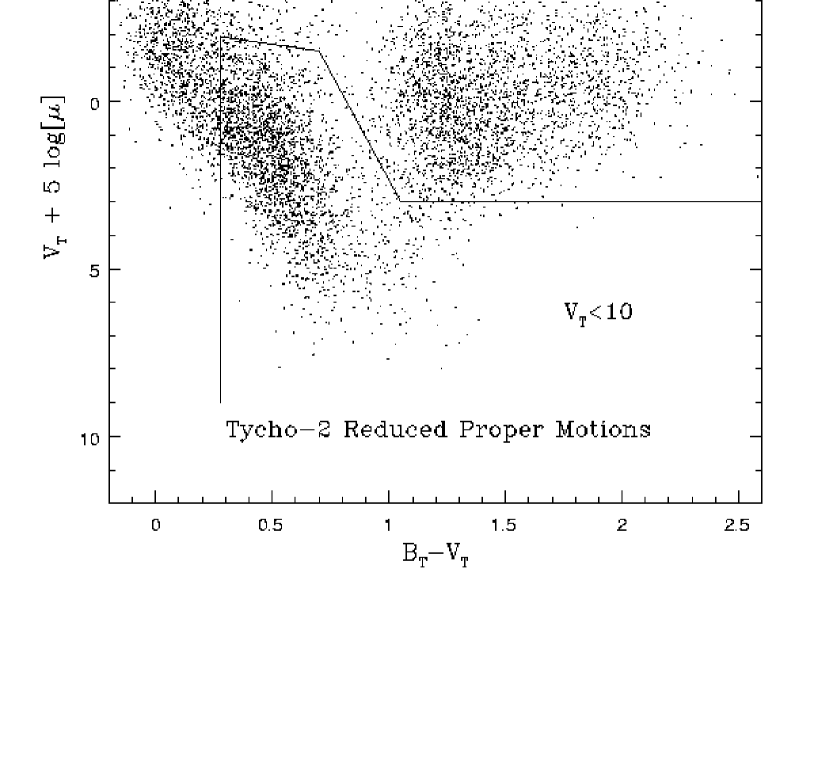
An obvious choice for such a dataset is the Tycho-2 catalog (Høg et al., 2000). At , Tycho-2 has typical proper motion errors of , which according to equation (3) is quite adequate. Tycho-2 is also complete to . However, Tycho-2 photometry, particularly photometry is quite poor at these faint magnitudes. In our initial treatment, we will therefore restrict consideration to Tycho-2 stars with , for which . To avoid clutter, we display in Figure 3 a random 2% subset of these stars. Table 1 shows the total number of stars in the sample that are accepted and rejected, with percentages broken down into early-type , mid-type , and late-type stars. If we ignore the stars that are rejected solely because they were too blue (on the grounds that such color selection was already being applied prior to our work), we find that 60% of the remaining stars are rejected by our selection criteria.
Of course, a successful selection will not only reject many unwanted stars, but also keep the overwhelming majority of desirable stars. It will also minimize the number of unwanted stars that are accepted. We must use the stars in Figure 2 to evaluate performance in these two areas, since it is only this sample for which we have independent knowledge of whether an individual star is desirable. This will require some care because Figures 2 and 3 are selected in somewhat analogous, but not identical, ways.
The fraction of stars falsely rejected in Figure 2 is only 9% (50/[536 +50]). This is likely to be a pretty accurate estimate of the false rejection rate for the Tycho-2 sample. Since all the stars in question have , the Hipparcos sample lies within pc. Since Hipparcos parallax errors at these bright magnitudes are mas, the fractional errors are . Hence the 5% parallax-error criterion does not substantially affect the sample of stars . Thus, both the Hipparcos and Tycho-2 samples are effectively magnitude-limited. Because the Tycho-2 sample has a fainter magnitude limit, it has a slightly lower fraction of stars near the maximum allowed radius, since these stars are seen to a distance pc from the Galactic plane where their density thins out somewhat. Hence, the 9% false rejection rate is probably a slight overestimate.
The rate of unwanted acceptances is 65% (985/[985+536]). This is likely to be somewhat underestimated because the unwanted stars are intrinsically brighter than the desired stars and so have suffered more from the bias induced by demanding good parallaxes. This bias is probably not extremely severe because to be accepted, the unwanted star must be reasonably close to the boundary.
Note that, since 70% of stars are rejected and only of those accepted are useful, the fraction of stars in the overall magnitude-limited sample that are useful is only 10%.
Table 1 also shows the results for a sample limited to , but otherwise selected according to the same criteria. This would be similar to the sample probed by the all-sky telescope survey proposed by Pepper, Gould, & DePoy (2002). In addition, Table 1 shows a sample selected according to looser criteria as described in § 6.
4 Application to Tycho-2 + 2MASS
The results in § 3 were restricted to . Since most transit surveys go beyond this limit, we would like to push the method to fainter stars. Recall from equation (3) that at , the Tycho-2 astrometry errors are adequate () but the photometry is unreliable. A straightforward way to resolve this problem is to match the Tycho-2 catalog to 2MASS and so replace by . At these magnitudes, the 2MASS errors are typically mag and so negligible compared to Tycho-2 errors. Also, although the errors do deteriorate significantly for these faint stars, the effects of this are mitigated by the longer wavelength baseline: . Unfortunately, the full 2MASS catalog is not yet available, but it is promised by the end of 2002. In the meantime, the Second Incremental 2MASS Release, which covers 47% of the sky, allows us to evaluate the efficiency of this approach.
Figure 4 is a Tycho-2/2MASS RPM diagram, with determined from Tycho-2, and colors from Tycho-2 and 2MASS . A random of the data are shown so that the density of points can be compared directly to that of Figure 3. The broken line discriminates between transit target stars and non-target stars. The end points of these line segments are found by transforming the coordinates of the line segments in Figures 2 and 3. To determine this transformation, we fit of Hipparcos/2MASS stars to a fifth-order polynomial of . This fit has coefficients with a residual scatter of 0.113 mag. No magnitude limit is applied to Figure 4. (Note that the numbers of accepted and rejected stars have been scaled up by a factor 2.13 in Table 1 to take account of the fact that 2MASS presently covers only 47% of the sky.)
5 Fainter Surveys
With the advent of UCAC2 (Zacharias et al., 2000), it should be possible to push our method to about , at least in the north (). For these declinations, UCAC2 expects to be able to link up modern CCD astrometry with archival AGK2 plates to achieve proper motions (N. Zacharias 2002, private communiation). For the most critical colors, , this corresponds to . Such high astrometric precision would easily satisfy the requirements of equation (3). Unfortunately, UCAC2 does not expect their CCD photometry to be calibrated, and there is no other source of all-sky optical CCD photometry at these magnitudes. However, a transit survey could calibrate its own relative photometry to achieve the necessary color selection.
At fainter magnitudes, it is still possible to partially apply our method to early-type and late-type stars, if not to G-type stars. Of course, as has been mentioned several times, one can exclude early-type stars based on color data alone, i.e., without proper motions. RPM discrimination could then be applied to late-type stars, with a color threshold that depended on the depth of the survey. First note that even for very faint stars it is possible to obtain proper motions with errors for by matching USNO-A (Monet, 1996, 1998) to 2MASS (Salim & Gould, 2003), and UCAC2 may be able to improve somewhat on this value for slightly brighter stars . Suppose a survey star has magnitude and color . If the star were a dwarf, then it would have absolute magnitude (Reid, 1991). A tranverse velocity of would then be detectable at the level provided that,
| (4) |
Hence, for a survey with limiting magnitude such as the Kepler mission111 http://www.kepler.arc.nasa.gov/ , it would still be possible to discriminate between giants and dwarfs for , roughly the blue edge of the clump. The great majority of stars in magnitude-limited samples at these red colors are giants. Hence, it is important to have an efficient mechanism for sifting through these to find the modest number of dwarfs that are viable targets of a transit search. (Presently, Kepler plans to make this selection by high-resolution spectroscopy of stars.)
6 Selection of Larger Stars
Up to this point, we have implicitly assumed that the transit survey is systematics-limited, so that there is no point in probing stars larger than some radius limit, for which we have adopted . However, we also wish to consider the situation in which a survey is photon-limited rather than systematics-limited. In this case, if the survey were senstitive to at its magnitude limit, then it would be sensitive to one magnitude brighter. In the example of § 3, the search among these bigger stars would be restricted to . The dashed line in Figure 1 is the contour. Figure 5 shows the derivation of RPM selection criteria for this case. It is similar to Figure 2 except that the stars are divided at rather than . Figure 6 applies this criterion to the sample. It is similar to Figure 3 except for the brighter magnitude limit and larger radius selection. The method is slightly less efficient for these bigger stars, rejecting only 57% of the stars remaining after a blue color cut has removed an initial 22%. Recall that the corresponding numbers for the smaller stars were 60% and 25%.
7 Discussion
The RPM selection function is very efficient at removing early-type and late-type stars. For the former, it reduces to a simple color cut that is similar to the ones already in common use. For the latter, its robustness derives from the large gap between the giant branch and the MS. The method is relatively inefficient at excluding evolved G-type stars because here the gap is much smaller. However, this residual G-star contamination is modest relative to the contaminants that are efficiently eliminated.
Given that the primary new gain from this method is the elimination of red giant contaminants, one might ask how difficult it would be to weed these out by other means. Stellar transits of giants must be very finely tuned in order to mimic planetary transits. For example, the eclipse due to a star in a 0.1 AU (12 day) orbit about a giant would last day if the inclination were anywhere near . Only if it traced a chord within of the giant’s limb would the eclipse be short enough to be confused with a planetary transit. If the data were of sufficient quality, the rounded shape of the lightcurve could reveal the stellar nature of the event.
A more difficult problem is caused by triple systems containing a giant and a MS eclipsing binary. If the binary separation is bigger than the radius of the giant, it is extremely difficult to distinguish this system from a planet transiting a dwarf star using the lightcurve alone. Indeed, even spectroscopic observations designed to recognize the reflex motion due to an M-star companion would most likely fail to detect such a contaminant because the giant would not be markedly changing its RV. Only a high signal-to-noise ratio spectrum would succeed in detecting the spectroscopic signature of the companion pair contributing of the light. These difficult contaminants are easily removed using our method.
Perhaps the best aspect of our method in this respect is that it not only removes the need for followup observations of contaminant events, it removes the need to even analyze the lightcurves of the great majority of contaminating stars.
In this paper we have ignored extinction. The effect of extinction (if it is not corrected) is to move stars along the reddening vector in the RPM diagram. This can essentially only move stars from being rejected to accepted and not the reverse. That is, ignoring extinction is conservative in that it adds to contamination but does not lead to missing legitimate targets.
For our primary example, shown in Figure 3, extinction is actually a very minor effect: target stars always lie pc, so that even in the Galactic plane the reddening is only . Hence, ignoring extinction has hardly any effect.
As the magnitude limit gets fainter, extinction becomes more important and so failure to correct for it can lead to significant increases in contamination. We caution, however, that accurately correcting for this effect is not trivial, and that such corrections should therefore be done conservatively, i.e., by maintaining a strong bias against overestimating the extinction. Even for fields for which the extinction at infinity is well measured (from e.g. Schlegel, Finkbeiner, & Davis 1998), a large fraction of the dust may lie behind the target stars, which tend to be relatively close. Thus, the 3-dimensional dust distribution must be modeled. Moreover, for fields close to the Galactic plane, i.e., those for which the extinction correction is most important, the Schegel et al. (1998) estimates for extinction at infinity are less reliable. Hence, even more care is required in making the correction.
References
- Brown & Charbonneau (1999) Brown, T. M., & Charbonneau, D. 1999, BAAS, 31, 1534
- Charbonneau et al. (2000) Charbonneau, D., Brown, T. M., Latham, D. W., & Mayor, M. 2000, ApJ, 529, L45
- Charbonneau et al. (2002) Charbonneau, D., Brown, T. M., Noyes, R. W., & Gilliland R. L. 2002, ApJ, 568, 377
- Cody & Sasselov (2002) Cody, A. M., Sasselov, D. D. 2002, ApJ, 569, 451
- ESA (1997) European Space Agency (ESA). 1997, The Hipparcos and Tycho Catalogues (SP-1200; Noordwijk: ESA)
- Høg et al. (2000) Høg, E. et al. 2000, A&A, 355, L27.
- Howell et al. (2000) Howell, S. B., Everett, M., Davis, D. R., Weidenschilling, S. J., McGruder, C. H., III, Gelderman, R. 2000, BAAS, 32, 3203
- Hui & Seager (2002) Hui, L., Seager, S. 2002, ApJ, 572, 540
- Mallen-Ornelas (2001) Mallen-Ornelas, G., Seager, S., Yee, H. K. C., Minniti, D., Gladders, M. D., Ellison, S., Brown, T., Mallen, G. M. 2001, BAAS, 199, 6602
- Monet (1996) Monet, D. G. 1996, American Astronomical Society Meeting, 188, 5404.
- Monet (1998) Monet, D. G. 1998, American Astronomical Society Meeting, 193, 112003
- Pepper, Gould, & DePoy (2002) Pepper, J., Gould, A., & DePoy, D.L. 2002, ApJ, submitted (astro-ph/0208042)
- Reid (1991) Reid, N. 1991, AJ, 102, 1428
- Salim & Gould (2003) Salim, S. & Gould, A. 2003, ApJ, in press
- Schlegel, Finkbeiner, & Davis (1998) Schlegel, D.J., Finkbeiner, D.P., & Davis, M. 1998, ApJ, 500, 525
- Skrutskie et al. (1997) Skrutskie, M.F. et al. 1997, in The Impact of Large-Scale Near-IR Sky Survey, ed. F. Garzon et al. (Kluwer: Dordrecht), p. 187
- Street et al. (2000) Street, R. A. et al. 2000, in ASP Conf. Ser., Vol. 219, Euroconference on Disks, Planetesimals and Planets, eds. F. Garzon, C. Eiroa, D. de Winter, & T. J. Mahoney (San Francisco: ASP), 572
- Street et al. (2002) Street, R. A. et al. 2002, in ASP Conf. Ser., Scientific Frontiers in Research on Extrasolar Planets, eds. D. Deming and S. Seager, in press
- Udalski et al. (2002) Udalski, A. et al. 2002, AcA, 52, 1
- van Belle (1999) van Belle, G.T. 1999, PASP, 111, 1515
- Zacharias et al. (2000) Zacharias, N. et al. 2000, AJ, 120, 2131


| Sample | Accept | Early | Mid | Late | Reject | Early | Mid | Late | |
|---|---|---|---|---|---|---|---|---|---|
| Mag | Radius | % | % | % | % | % | % | ||
| 75 | 0 | 79 | 21 | 252 | 40 | 6 | 54 | ||
| 257 | 0 | 73 | 27 | 603 | 35 | 8 | 57 | ||
| All | 949 | 0 | 68 | 32 | 1231 | 38 | 10 | 52 | |
| 109 | 0 | 77 | 23 | 218 | 33 | 3 | 64 | ||