Massive Star Formation Rates and Radial Distributions from H Imaging of 84 Virgo Cluster and Isolated Spiral Galaxies
Abstract
The massive star formation properties of 55 Virgo Cluster and 29 isolated S0-Scd bright ( -18) spiral galaxies are compared via analyses of R and H surface photometry and integrated fluxes as functions of Hubble type and central R light concentration (bulge-to-disk ratio). In the median, the total normalized massive star formation rates (NMSFRs) in Virgo Cluster spirals are reduced by factors up to 2.5 compared to isolated spiral galaxies of the same type or concentration, with a range from enhanced (up to 2.5 times) to strongly reduced (up to 10 times). Within the inner 30% of the optical disk, Virgo Cluster and isolated spirals have similar ranges in NMSFRs, with similar to enhanced (up to 4 times) median NMSFRs for Virgo galaxies. NMSFRs in the outer 70% of the optical disk are reduced in the median by factors up to 9 for Virgo Cluster spirals, with more severely reduced star formation at progressively larger disk radii. Thus the reduction in total star formation of Virgo Cluster spirals is caused primarily by spatial truncation of the star-forming disks. The correlation between HI deficiency and R light central concentration is much weaker than the correlation between HI deficiency and Hubble type. The previously observed systematic difference in HI spatial distributions and kinematics between early- and late-type spirals in the Virgo Cluster is at least partially due to the misleading classification of stripped spirals as early-types. ICM-ISM stripping of the gas from spiral galaxies is likely responsible for the truncated star-forming disks of Virgo Cluster spirals. This effect may be responsible for a significant part of the morphology-density relationship, in that a large fraction of Virgo Cluster galaxies classified as Sa are HI-deficient galaxies with truncated star forming disks rather than galaxies with large bulge-to-disk ratios.
Subject headings:
galaxies: spiral — galaxies: clusters: general — galaxies: clusters: individual (Virgo) — galaxies: fundamental parameters — galaxies: peculiar — galaxies: structure1. Introduction
What role does the environment play in the evolution of cluster galaxies? The observation that the morphological mix of galaxies varies in different nearby environments was qualitatively noted even in the early studies of the Virgo Cluster by Hubble and Humason (1931) and has been confirmed in many studies (e.g., Oemler 1974; Dressler 1980; Postman & Geller 1984; Dressler et al. 1997). In addition, many studies of nearby galaxies have detailed how cluster galaxies differ from field galaxies within the same Hubble type, including redder colors (Kennicutt 1983a; Oemler 1992), less HI gas (Chamaraux, Balkowski, & Gérard 1980; Giovanelli & Haynes 1983), and truncated outer HI gas disks (Giovanelli & Haynes 1983; Warmels 1988; Cayatte et al. 1990). Studies of higher redshift cluster galaxies show that evolution in cluster galaxy morphology and star formation properties has occurred over the last several billion years. Butcher & Oemler (1978) showed that distant clusters of galaxies have a higher proportion of blue galaxies. More recently, Dressler et al. (1997) found an excess of spirals and a lack of S0 galaxies in about the same proportion in dense clusters at redshifts of 0.5 compared to local dense clusters. These results suggest that many of the S0’s in local clusters were actively star-forming spirals at z=0.5.
There is a rich literature about the types of environmental processes which could affect the evolution of galaxies in clusters. There are processes which affect mainly the gaseous content of a galaxy, such as ICM-ISM interactions (reviewed by van Gorkom 2004), starvation (Larson, Tinsley, and Caldwell 1980), and gas accretion (Kenney et al., in prep). Gravitational processes, which affect both the gaseous and stellar properties of a galaxy, range from low-velocity tidal interactions and mergers, to high velocity interactions between galaxies and/or the cluster (reviewed by Struck 1999 and Mihos 2004). Despite a number of recent studies of nearby and distant clusters, it is not yet clear which processes, if any, are dominant. Indeed the properties of cluster galaxies may be determined by a variety of environmental interactions over a Hubble time (Miller 1988; Oemler 1992; Moore et al. 1998).
The rate of ongoing star formation is an important measure of the evolutionary state of a galaxy, and a sensitive indicator of some types of environmental interactions. Previous studies of the star formation rates of cluster galaxies have reached varying and sometimes opposite conclusions. Some authors have found reduced star formation rates in clusters (Kennicutt 1983a; Bicay & Giovanelli 1987; Kodaira et al. 1990; Moss & Whittle 1993; Abraham et al. 1996; Balogh et al. 1998; Koopmann & Kenney 1998; Hashimoto et al. 1998; Gavazzi et al. 2002), others similar rates (Kennicutt, Bothun, & Schommer 1984; Donas et al. 1990; Gavazzi, Boselli, & Kennicutt et al. 1991, Gavazzi et al. 1998), and others enhanced rates (Moss & Whittle 1993, 2000; Bennett & Moss 1998). This confused situation on cluster galaxy star formation rates is one of the motivations for the present work. In addition, many previous studies of star formation rates have been based on aperture or integrated galaxy spectral observations. Spatial studies of star formation can probe the types of environmental interactions at work in nearby clusters, therefore revealing what may have influenced galaxies in richer clusters earlier in the history of the Universe.
This work describes results from an imaging survey of Virgo Cluster and isolated spiral galaxies in both broadband R and the H emission line. The intent of this study is to compare the amounts and distributions of massive star formation in Virgo Cluster galaxies to those of a relatively undisturbed isolated sample of galaxies. We base our comparisons on the H emission from galaxies, which is a good tracer of the massive star formation rate (Kennicutt 1983b) in relatively dust-free regions. It can be used to estimate the total star formation rate by making standard assumptions for the initial mass function. We use the H surface brightness and the H flux normalized by the R flux as distance-independent tracers of the massive star formation rate. The data we have gathered thus allow a quantitative radial comparison of massive star formation rates in the two environments. The Virgo Cluster is a particularly good laboratory to study environmental effects on star formation since it is the nearest moderately rich cluster, it has significant ICM, it is dynamically young with a current infall of spirals (Tully & Shaya 1984), and its galaxies are subject to a variety of environmental effects.
An important consideration in addressing these issues is the objective comparison of galaxies with different morphologies. van den Bergh (1976) made the important observation, based on visual inspection of images on plates, that many cluster spiral galaxies have low rates of star formation relative to field spirals, and that the traditional Hubble classification does not work well in nearby clusters because the bulge-to-disk (B/D) ratio is not well correlated with the disk star formation rate. Koopmann & Kenney (1998) confirmed and quantified this effect, using objective measurements from CCD images, showing that a one-dimensional classification scheme such as the Hubble classification is not applied in the same way to field and cluster galaxies, and that it is not adequate to describe the wider range in morphologies of cluster galaxies. For example, Koopmann & Kenney find that a significant fraction ( 50%) of Virgo Cluster spirals classified as Sa are small-to-intermediate concentration (B/D) galaxies with reduced global star formation rates, presumably due to environmental effects. This effect contributes to the excess of ‘early-type’ spiral galaxies in the Virgo Cluster and therefore to the local morphology-density relationship.
This paper presents the main results of a program which is published in separate papers. We present the observational data for the Virgo galaxies in Koopmann et al. (2001, hereafter PI) and that for the isolated galaxies in Koopmann & Kenney (2004, in prep, hereafter PII). These papers include H and R images and radial profiles for all galaxies. Koopmann & Kenney (1998) present comparisons of Hubble type and central R concentration for isolated and Virgo galaxies. The present paper concentrates on the massive star formation properties, with comparisons between integrated H fluxes, H radial profiles, and the relative concentrations of H emission. A comparison of the different types of H morphologies and a discussion of environmental effects is given in Koopmann & Kenney (2004, hereafter PIV).
2. The Sample
The 55 Virgo S0-Scd galaxies have -18 (B 13 for an assumed distance of 16 Mpc) and inclinations less than 75∘. The Sa-Scd sample is 95% complete for -19 and 68% complete for -18, which is about 2 magnitudes fainter than L∗. The Sb-Scd sample is relatively more complete than the Sa-Sab sample (79% and 50% to -18, respectively). The S0 galaxies observed are 13% of the population to -18. Since this study was not designed to focus on S0’s, the results for these galaxies will not be extensively discussed. There is a slight bias toward galaxies with higher IRAS fluxes in our sample, since a subset of these galaxies (75%) were obtained as part of a study of star formation rates and efficiencies in a larger sample of spiral galaxies (Young et al. 1996). Observational and reduction details are discussed in PI.
Isolated galaxies were chosen from the Nearby Galaxies Catalog (Tully 1987) and Gourgoulhon, Chamaraux, & Fouqué (1992) to be similar to the Virgo Cluster sample galaxies in B luminosity, inclination, and distance, but are located in the least dense regions as defined by parameters from Tully (1987). The search criteria produced 103 Sa-Scd galaxies with -18. Our 24 Sa-Scd galaxies comprise 25% of this sample to -19 and 23% to -18. The completeness varies as a function of Hubble type due to the morphology density relationship, so that S0-S0/a and Sa-Sab galaxies are observed to higher completeness ( 50% to -18) than the Sb-Scd galaxies ( 18% to -18). Details of the selection of isolated galaxies are given in PII.
All R observations are calibrated to the standard Kron-Cousins R filter. Images were flux-calibrated using spectrophotometric standard stars (Massey et al. 1988). Extinction coefficients were obtained from Landolt standards or from standard extinction curves at KPNO and CTIO. Continuum-free H images were derived by subtracting scaled R images from the line images. H in this paper should be read as H+[N II], since two [N II] lines ( 6584Å, 6548Å) are included in the filter and we make no correction.
3. Surface Photometry
Surface photometry of the R and H images of sample galaxies was performed using an IDL-based program (see PI). R and H profiles were measured assuming a fixed center, inclination, and position angle, with inclination and position angle derived primarily from the outer R isophotes. Identical elliptical annuli were applied in the H and R surface photometry for each galaxy. Isophotal radii, isophotal fluxes, and central light concentrations are calculated from the derived profiles within the IDL program. Exponential R disk scalelengths were measured from the profiles using the decomposition routines in the fitting programs in IRAF/STSDAS. Profiles and fitted parameters for individual galaxies are presented in PI and PII.
For comparison between galaxies, all surface brightness profiles were corrected to face on assuming complete transparency in the disk, i.e., by applying the correction 2.5 log (a/b) to the surface brightness, where a/b is the major-to-minor axis ratio. All future references to isophotal radii or fluxes integrated within an isophotal radius refer to quantities derived from the profiles corrected to face-on. The assumption of complete transparency is obviously incorrect, especially at inner radii, but since extinction values for other galaxies are poorly known, no corrections were attempted (see Giovanelli et al. 1994). If the extinction properties of Virgo Cluster and isolated galaxies are similar, there should be no systematic error due to inclination since the Virgo Cluster and isolated samples span similar inclination ranges. The most serious errors in H integrated fluxes and radial profiles will occur for highly inclined galaxies. For example, Young et al. (1996) find that the H surface brightness significantly decreases in the mean with inclination for galaxies with inclinations greater than 70∘. All galaxies discussed in this paper have an inclination of 75∘ or less, and we find that the measured quantities do not depend on inclination in this range.
3.1. Radial Normalization of Profiles
Outer isophotal radii are direct tracers of the size/luminosity of high surface brightness galaxies and depend relatively little upon disk extinction, since the outer parts of galaxy disks are nearly transparent (Giovanelli et al. 1994, 1995). Thus, we measured the outer isophotal radii at 24 R mag arcsec-2 in order to normalize the profiles of galaxies of different sizes and distances. The radius at the 24 mag arcsec-2 isophote in R was selected because the signal at this radius dominates the uncertainty in the sky background for most of the sample galaxies. (The uncertainty in the sky level includes uncertainties due to scattered light, background gradients, and, in some cases, the effects of small frame size.) The values of in R are similar to in B.
Disk scalelengths were also used to normalize radial profiles, and comparisons based on the disk scalelength rather than the isophotal radius produced no significant difference in the results. We chose to use the isophotal radius instead of the disk scalelength primarily because of the difficulty of fitting bulge and disk models to sample galaxies, particularly in the Virgo Cluster, which has proportionately more galaxies with complex profiles. 23% (13/55) of Virgo Cluster galaxies have derived disk scalelengths which are uncertain by 20%, compared to 7% (2/29) of the isolated sample galaxies (PI, PII). These numbers include 4 galaxies for which we were unable to derive disk scalelengths due to dominant bulge components (the Virgo galaxy NGC 4383 and the isolated NGC 3414) and/or complex profiles (the Virgo galaxy NGC 4586, which has a brighter outer disk component and the isolated NGC 2090, which has a lower surface brightness outer disk component). Of the remaining 11 Virgo galaxies with scalelengths more than 20% uncertain, eight have a higher surface brightness inner disk compared to the fit to the outer disk (in 3 cases, this appears to be related to a star formation enhancement) and three have a higher surface brightness outer disk.
4. Galaxy Morphology
4.1. Hubble Types
In order to compare properties of the two samples, we initially binned galaxies as a function of Hubble type. Types were extracted from Binggeli, Sandage, and Tammann (1985, hereafter BST), the Revised Shapley-Ames Catalog of Bright Galaxies (Sandage & Tammann 1987, hereafter RSA), the Carnegie Atlas (Sandage & Bedke 1994, hereafter CA), and the Third Reference Catalog of Bright Galaxies (de Vaucouleurs et al. 1991, hereafter RC3).
An examination of the cataloged types indicates problems in the application of the Hubble system to Virgo Cluster galaxies. Three Virgo sample galaxies were classified by BST as Sc/Sa or Sc/S0. Several Virgo sample galaxies were classified as Sc by BST, but Sa or S0 by RC3. Two galaxies (NGC 4383, NGC 4694) are classified as amorphous by RSA/BST, but as Sa and S0 by the RC3. A comparison between the BST/RSA/CA and RC3 shows more than a half type difference in classification for 12% of isolated galaxies, but 30% of Virgo galaxies. Quantitative comparison between objective tracers of Hubble criteria show that even some Virgo galaxies which have consistent classifications in the two catalogs do not fit the Hubble system, particularly small B/D systems consistently classified as Sa and Sab (Koopmann & Kenney 1998). See also van den Bergh (1976) and Bothun (1982).
4.2. R Profiles
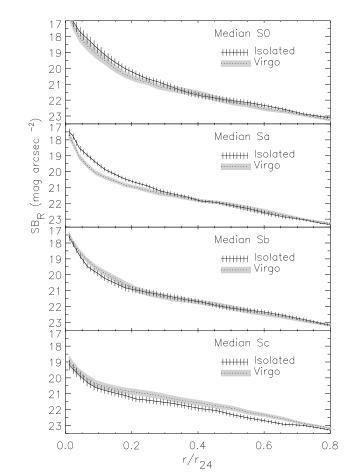
The R profiles of sample galaxies trace the B/D ratio objectively. Median profiles were derived for each Hubble type and environment bin as a function of . A direct comparison between Virgo and isolated median profiles for S0-Sc morphological types is given in Figure 1. Interquartile ranges are indicated in the graph with shading. Virgo Sa’s are less centrally concentrated in the median than isolated Sa’s. We show in Section 4.3 that this result is significant at the 99% level and that it is not caused by a luminosity effect, as is seen in some studies (e.g., Scodeggio et al. 2002). This comparison between R radial light profiles further illustrates that Hubble classifications are not always an indicator of B/D ratio when applied to the complexity of morphologies in a cluster environment.
The comparison of R profiles also allows an examination of the relative surface brightnesses of the sample galaxies. The extrapolated central surface brightnesses of the disks of the sample galaxies differ by factors of 4-16 for different bins, with no statistically significant dependences on either Hubble type or environment. This is consistent with previous results (e.g., Bothun 1982; Kent 1985) for central disk surface brightnesses derived from model fits. Figure 1 shows that the Virgo Sc galaxies tend to have higher surface brightness disks than the isolated galaxies. While Virgo and isolated Sc galaxies span the same range in surface brightness, there are proportionally more Virgo Sc’s with higher disk surface brightness.
4.3. Central R Light Concentration
A quantitative indicator of B/D ratio for galaxies of similar surface brightness is the central R light concentration parameter, which can be measured directly from the R radial profiles and is ideally independent of the star formation characteristics of a galaxy. The central light concentration used in this work is similar to the parameter used by Abraham et al. (1994):
where is the total flux in R measured within the isophote and is the flux within the 0.3 isophote. The values are computed directly from the surface photometry calculated using fixed center, inclination, and position angle. Therefore the measurement uncertainty is due mainly to uncertainties in the center, inclination, and position angle of the elliptical apertures. For most of the galaxies, these uncertainties are less than 5%, which causes a negligible error in (PI). Systematic effects (discussed in detail by Graham et al. 2001) are likely more important; for example, any phenomena (rings, dust, star formation regions) which change the shape of a galaxy’s R surface brightness profile can influence the measured parameter.
B/D is correlated to in a non-linear fashion (Graham 2001). PI provides a comparison of B/D and values.
Scodeggio et al. (2002) find that a near-infrared concentration parameter, defined as the ratio between the radii that contain 75% and 25% of the total light, is strongly dependent on the luminosity of a galaxy, particularly for low luminosity galaxies. As shown in Figure 2, we find no strong correlations between and the luminosity of a galaxy, as measured by , the R magnitude within the isophote. We note that our sample is dominated by massive, luminous galaxies, and that we have a smaller sample of galaxies than Scodeggio et al.
As discussed in Koopmann & Kenney (1998), and Hubble type are well correlated in the isolated sample, but not in the Virgo sample, and this can also be seen in Figure 2. In particular, half of the Virgo galaxies classified as Sa have lower than any of the isolated galaxies classified as Sa. Mann-Whitney tests show that this result is significant at the 99% level.

In comparisons between galaxies with different values, we bin into four ranges. These ranges were chosen based on comparisons between Hubble type and for the isolated sample, since correlates well with Hubble type for the isolated galaxies (Koopmann & Kenney 1998) and field galaxies in general (e.g., Kent 1985). The bins correspond roughly to isolated S0 (0.61 0.72), Sa (0.51 0.60), Sb (0.38 0.50), and Sc (0.24 0.37) galaxies. Note that the approximately even distribution in Hubble type and for the isolated galaxies is due to the selection of galaxies, which was motivated by the need to obtain adequate numbers for statistical comparison of S0-Sc galaxies, and not to trace the actual relative field populations, in which Sc galaxies far outnumber S0-Sa. In contrast, the Virgo sample galaxies are not evenly distributed in , but primarily fall toward lower concentrations. This is a combined effect due (i) to a more complete sample of Sc relative to Sa galaxies compared to the isolated sample, but also (ii) to the fact that several Virgo galaxies classified as Sa or mixed type have lower central concentration than isolated Sa galaxies.
5. Total Normalized H Fluxes
Past comparisons of star formation rates in cluster and field galaxies have been most often based on integrated measures of star formation. We thus begin our analysis of the H images by examining total H fluxes.
Total H fluxes were computed from cleaned, sky-subtracted H images, by summing the total flux within an elliptical aperture including all HII regions. Uncertainties in integrated H fluxes due to sky background noise, calibration errors, continuum subtraction errors are typically 20-30%. The dominant component of this uncertainty is the continuum subtraction error. Error bars given in this paper include a 3% typical uncertainty in the continuum subtraction factor, which corresponds to a much larger error in the calculated H flux, especially for galaxies dominated by faint, diffuse emission. S0 galaxies have the most uncertain H fluxes, since few contain obvious HII regions, and we therefore do not place much emphasis on the analysis of their H properties, although we include them in the plots.
To compare total H fluxes between galaxies, we normalized by the flux in R contained within to obtain the normalized massive star formation rate (hereafter NMSFR or FHα/FR24). This quantity is a measure of the total H luminosity per unit red luminosity and is analogous to an equivalent width. Since some readers are more familiar with the equivalent width scale, we provide a conversion between equivalent width, EW, from our H fluxes:
This equation was derived based on our isolated sample and is further described in PII. The EW’s derived from this correlation have an uncertainty of 6% due to scatter. They correlate well with the H equivalent widths measured by Kennicutt and Kent (1983) for galaxies in common.

As a function of Hubble type or (see Figure 3a and b), galaxies in both samples show a large spread in total NMSFRs. Within a Hubble type, FHα/FR24 ranges by a factor of 10, which is similar to measurements in previous surveys of galaxy star formation rates as a function of Hubble type (Kennicutt 1998 and references therein). Within concentration bins, however, the FHα/FR24 of Virgo Cluster galaxies ranges by factors up to 20-40 (see Section 6.2). While the distributions are non-Gaussian and span a large range, the larger spread in star formation rates in Virgo is mostly due to galaxies with reduced star formation, but is also partially due to enhancements in the NMSFRs by factors of up to 3 for several galaxies.
Most of the Virgo galaxies with enhanced NMSFRs are lower luminosity galaxies ( -18) and we do not have a large number of isolated spirals of similar luminosity. Several authors (e.g., Kennicutt et al. 1984; Boselli et al. 2001) have shown a tendency for lower luminosity galaxies to exhibit higher H equivalent widths and star formation rates. A weak correlation is evident in Figure 3, particularly for the isolated galaxies. In the Virgo Cluster, the correlation is weaker due mainly to reductions in star formation. To avoid a possible luminosity bias in our analysis, we will limit most of our discussions to galaxies with -19.5 ( -18.5).
Median total normalized H fluxes with standard deviations and corresponding EW’s for Virgo Cluster and isolated galaxies with -19.5 are listed in Table 1 as a function of type and central light concentration. In both samples, the typical NMSFRs decrease as a function of earlier Hubble type and of greater central concentration.
For the isolated galaxies, the median NMSFRs for spiral galaxies of different Hubble types and concentrations are similar within a factor of 4, consistent with other studies of globally averaged H surface brightness for larger samples of field galaxies (Young et al. 1996). The tendency for the early-type/high concentration (0.51 0.60; approximately Sa) isolated spirals to have lower NMSFRs compared to the lowest concentration galaxies is significant ( 99%) when the binned samples are compared via Mann-Whitney tests.
| Isolated (#) | Isolated | Virgo(#) | Virgo | ||
|---|---|---|---|---|---|
| Type/ | log | H EW | log | H EW | |
| (NMSFR) | (Å) | (NMSFR) | (Å) | ||
| Total | |||||
| S0-S0/a | -2.96 0.29 (5) | 2 | -3.24 0.49 (3) | 1 | - |
| Sa-Sab | -2.24 0.20 (6) | 9 | -2.57 0.24 (9) | 4 | 2.1 (0.8)* |
| Sb-Sbc | -1.87 0.15 (8) | 20 | -2.06 0.24 (7) | 13 | 1.5 (0.5) |
| Sc-Scd | -1.63 0.09 (7) | 35 | -1.81 0.19 (18) | 23 | 1.5 (0.2) |
| Sc-Scd 6∘ | - | - | -1.82 0.28 (14) | 22 | 1.5 (0.2) |
| .61 0.73 | -2.96 0.48 (5) | 2 | -2.76 0.38 (3) | 3 | - |
| .51 0.60 | -2.01 0.16 (5) | 14 | -2.41 0.40 (5) | 6 | 2.5 (1.7) |
| .38 0.50 | -2.03 0.25 (8) | 14 | -1.99 0.29 (21) | 15 | 0.9 (0.3) |
| .24 0.37 | -1.65 0.10 (8) | 33 | -1.80 0.18 (9) | 23 | 1.4 (0.3) |
| Inner 30% | |||||
| Sa-Sab | -2.55 0.32 | 4 | -2.48 0.41 | 5 | 0.9 (0.6) |
| Sb-Sbc | -2.00 0.14 | 15 | -2.12 0.20 | 11 | 1.3 (0.6) |
| Sc-Scd | -1.86 0.10 | 20 | -1.86 0.16 | 20 | 1.0 (0.2) |
| Sc-Scd 6∘ | - | - | -1.83 0.28 | 22 | 0.9 (0.2) |
| .61 0.73 | -2.89 0.54 | 2 | -2.57 0.38 | 4 | - |
| .51 0.60 | -2.44 0.37 | 5 | -2.48 0.44 | 5 | 1.1 (1.0) |
| .38 0.50 | -2.14 0.23 | 11 | -1.91 0.21 | 18 | 0.6 (0.2) |
| .24 0.37 | -1.87 0.09 | 20 | -1.94 0.16 | 17 | 1.2 (0.2) |
| Outer 70% | |||||
| Sa-Sab | -2.03 0.25 | 14 | -2.98 0.48 | 2 | 9 (7)* |
| Sb-Sbc | -1.84 0.20 | 21 | -2.00 0.31 | 15 | 1.5 (0.6) |
| Sc-Scd | -1.56 0.09 | 41 | -1.82 0.24 | 22 | 1.8 (0.3)* |
| Sc-Scd 6∘ | - | - | -1.83 0.28 | 22 | 1.9 (0.2) |
| .61 0.73 | -3.04 0.31 | 1 | -4.00 2.2 | 1 | - |
| .51 0.60 | -1.89 0.18 | 19 | -2.34 0.36 | 7 | 2.8 (1.8) |
| .38 0.50 | -1.93 0.29 | 17 | -2.12 0.44 | 7 | 1.5 (0.8)* |
| .24 0.37 | -1.58 0.11 | 39 | -1.83 0.21 | 22 | 1.8 (0.4) |
Note. — Median and standard deviation (from the median) of log and corresponding equivalent width, as a function of environment, Hubble type, and central R light concentration for the isolated and Virgo galaxies with -19.5. The number of galaxies in each bin is given in parenthesis after the total flux. Note the larger spread in the Virgo distribution relative to the isolated distribution. The ratio of isolated to Virgo rates is given in the 6th column, with the standard deviation in the median given in parantheses. A number greater than 1 indicates a reduction for Virgo galaxies, while a number less than 1 indicates an enhancement. An asterisk indicates that the difference in the distributions is significant at better than 99% according to a Mann-Whitney ranked-sum test. Virgo Cluster galaxies have reduced total and outer disk star formation rates in the median for all Hubble type and bins. However, the inner disk rates for Virgo Cluster galaxies are similar to mildly enhanced compared to isolated counterparts.
In the median, Virgo galaxies have reduced star formation with respect to isolated galaxies in every Hubble and bin, with the exception of the intermediate bin. The larger spread in the Virgo NMSFRs is evident in the larger standard deviations. Table 1 also provides the factor by which Virgo normalized star formation is reduced in the median with respect to the isolated. The error associated with the scatter in normalized star formation rates is given in parentheses. The reduction in star formation as a function of Hubble type is in agreement with a number of past studies of star formation rates in the Virgo Cluster (e.g., Kennicutt 1983a; Gavazzi et al. 2002).
6. Radial Distributions of Massive Star Formation
Our study of total NMSFRs shows that Virgo Cluster galaxies typically have less total star formation than isolated counterparts, but that there is a large range in total star formation rates among cluster galaxies, which includes both reductions and enhancements. Using the spatial distributions of H emission, it can be determined where in the disks the star formation has been enhanced or reduced.
6.1. H Radial Profiles
The H surface brightnesses of sample galaxies in each Hubble class or concentration bin (Figure 4), span a factor 10 to 100 range at different radii in the disk. This large range in H surface brightness is in contrast to the R surface brightness, which spans a factor 4 to 16 range at any given radius (Section 4.2) and to global star formation rates which vary by about a factor of 10 within a given Hubble type (Section 5; Kennicutt 1998). The much larger range in H surface brightness is probably associated with variations in the surface density and critical density of gas as a function of radius in galaxies (Kennicutt 1989). The H surface brightness distribution within an individual galaxy can vary due to a variety of effects, including bars, rings, spiral arms, circumnuclear regions, and the truncation of the star-forming disk.
A closer look at Figure 4 reveals several clues about the relative spatial distributions of star formation in isolated and Virgo galaxies, despite the large range in H surface brightnesses. Many Virgo Cluster galaxies have truncated H disks compared to isolated counterparts. The smaller H disks of Virgo Cluster galaxies are seen as the emergence of dotted lines, many steeply declining, below the solid lines beyond about 0.4 in the plot. Truncated profiles are seen in all Hubble type and bins. 52% (27/52) of Virgo Cluster spirals have H disks truncated within 0.8, compared to 12% (3/24) of isolated spirals (see PIV). In contrast, within the truncation radii, the Virgo Cluster galaxies have H surface brightnesses which are typically similar or enhanced compared to isolated counterparts. Few Virgo Cluster galaxies have star formation which is reduced across the disk below isolated rates.
To compare profiles in the two samples in a more statistical way, median profiles were derived for each Hubble type and bin, by calculating the median of the surface brightness at numerous radii across the disk for galaxies within a given or Hubble type bin and with -19.5. Outside of the radius of the outermost HII region, the surface brightness was assumed to drop to 0 and was counted in subsequent radial bins as 0. Hence, the median profiles include the effect of truncated H surface brightness profiles. Median radial profiles of different Hubble types and are shown for each environment in Figures 5 and 6. Figure 6 includes shading indicating the interquartile range of the surface brightness distributions. The median profiles are drawn for radii for which the surface brightnesses are greater than 0, but the shading extends beyond these radii to show the upper ranges in the distributions.


Despite the range of 1-2 orders of magnitude in H surface brightnesses at a given radius, the medians of isolated spirals as a function of Hubble type and agree to within a factor of 4 over most of the disk, as shown in Figure 5. The agreement of median radial profiles within a factor of 4 is similar to the agreement between the total median H fluxes (Section 5; Young et al. 1996) and emphasizes that even early-type/high isolated galaxies typically have substantial amounts of ongoing massive star formation across the disk (see also Hameed & Devereux 1999).
The most striking difference between the Virgo and isolated median profiles are the smaller H disks of Virgo Cluster spirals, which can be seen in all bins in Figure 6. The Virgo H median profiles are truncated at progressively smaller disk radii for progressively earlier Hubble types and higher values. However, there is a large variation in truncation radii for Virgo galaxies in all Hubble type and bins, as can be seen from the interquartile ranges. In contrast, within the radii where truncation becomes important, the medians of Virgo profiles are within a factor of 3 of each other and isolated median profiles for all and Hubble type bins.
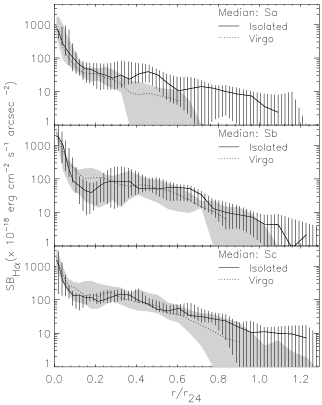
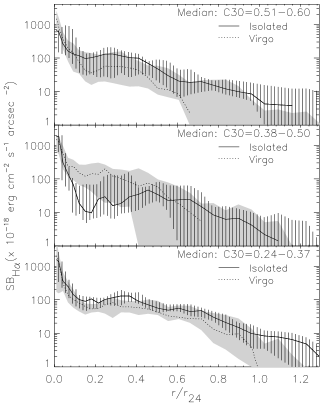
There is a tendency for some of the median H profiles, particularly the isolated, to have a ‘dip’ in the inner disk surface brightness. The dip is caused by the presence of barred galaxies in the samples. The effect is stronger in the isolated bins (note particularly the 0.38-0.50 isolated bin) because our isolated sample has a higher occurrence of strong bars than our Virgo sample (based on either RSA or RC3 bar classifications). This is not representative of the complete sample from which the isolated and Virgo Cluster galaxies were drawn, in which strong bars occur at similar frequency. To check the differences between star formation characteristics in the inner disks of barred and unbarred galaxies, we compared median profiles and overplotted individual H profiles of barred and unbarred galaxies of different types and (not shown). We find in the median that barred galaxies do have lower star formation rates within 0.2-0.3 , but that these lower rates are often compensated by higher rates within 0.3-0.6 .
6.2. Integrated H Fluxes
The radial dependence of massive NMSFRs can also be studied by deriving integrated H fluxes normalized by R over several radial bins. Figure 7 shows the integrated NMSFRs as a function of environment and over the whole disk (a,b), the inner 30% of (c,d), and the outer 70% of (e,f). Figure 8 shows the integrated rates for five smaller radial bins: within 0.1, 0.1 r 0.3, 0.3 0.5, 0.5 r 0.7, and 0.7 1.0. In both figures, the dotted lines indicate the approximate bounds of isolated Sa-Sc galaxies for each bin.

Median NMSFRs were calculated for galaxies with -19.5 in each radial bin and are presented in Tables 1 and 2. Table 1 gives the median, standard deviations (based on the median), and the isolated-to-Virgo ratio for the 0.3 and 0.3 1.0 outer bins. A comparison of the standard deviations shows that the inner Virgo NMSFRs have similar values compared to the isolated sample, except in the 0.38-0.50 bin, in which the median is enhanced by a factor of 1.7. In the outer disk, however, the Virgo NMSFRs are reduced by factors of 1.5 - 9 for galaxies of similar or Hubble type. Note especially the values of 2.8 - 9 for early Hubble type or high . The difference between the outer disk Sa and 0.51 0.60 bins is due to (i) the shifting of several galaxies classified as Sa to lower bins and (ii) the presence of a few galaxies classified as Sc with active star formation and higher .
| Type or | Flux Ratio in each radial bin | ||||
|---|---|---|---|---|---|
| 0.1 | 0.1 0.3 | 0.3 0.5 | 0.5 0.7 | 0.7r 1.0 | |
| Sa-Sab | 0.9 (1.4) | 0.8 (0.4) | 5.0 (3.0) | 5 | 5 |
| Sb-Sbc | 1.8 (0.6) | 0.7 (0.2) | 0.9 (0.4) | 1.6 (0.9) | 4 |
| Sc-Scd | 1.3 (0.4) | 1.0 (0.2) | 1.4 (0.3) | 1.4 (0.3) | 4 (2) |
| .51 C30 0.60 | 0.8 (0.6) | 1.4 (1.8) | 1.9 (0.7) | 3 | 3 |
| .38 0.50 | 0.9 (0.4) | 0.4 (0.1) | 0.8 (0.4) | 2 (1) | 5 |
| .24 0.37 | 1.4 (0.5) | 1.3 (0.2) | 1.4 (0.2) | 1.4 (0.2) | 3 |
Note. — The ratio of isolated to Virgo H median fluxes in the indicated radial bins as a function of Hubble type, and central R light concentration for galaxies with -19.5. In parentheses is given the standard deviation in the median. Lower limits were calculated based on the background sky error in each image. Virgo Cluster galaxies have larger median reductions in NMSFRs at progressively larger radii for all Hubble type and bins. In the inner disk, ratios show that Virgo and isolated spirals have similar or enhanced NMSFRs.
Table 2 gives the median isolated-to-Virgo ratios and standard deviation (based on the median) for the five smaller bins shown in Figure 8. Where necessary in the outer two bins, the values are given as upper limits, based on the level of the background sky error. From the table and the figure, the integrated NMSFRs of Virgo Cluster spirals are progressively lower in progressively outer radial bins. Significant reductions appear first for Sa and high in the 0.3-0.5 radial bin and become significant for Sb and smaller galaxies in the 0.5-0.7 bin. In the outermost bin, reductions for all Hubble type and bins are 3. Note especially that Virgo galaxies classified as Sa tend to have no massive star formation beyond 0.7, and that the lower concentration Virgo galaxies classified as Sa typically have no star formation in the outer half of the disk. This latter point is another indication that many of the Sa classifications assigned to Virgo Cluster spirals were based on reductions in star formation rates rather than large B/D.

The results for the outer disk are in contrast to the inner disk. Within 0.3, 95% of Virgo Cluster spirals have NMSFRs similar to or enhanced compared to isolated galaxies of similar type or (Figure 7). In Table 2, the two inner bins show isolated-to-Virgo ratios which are less than or about 1 within the scatter for almost all type and bins. Note in particular the 0.38-0.50 inner bins, where the median NMSFR in Virgo galaxies is enhanced by a factor up to 2.5.
In the preceding analysis, we have compared statistically only galaxies which have -19.5. In this paragraph, we summarize results for the galaxies with lower luminosities. In Figure 3, the total (a,b) and inner 30% (c,d) NMSFRs of sample galaxies are presented as a function of . We find that the behavior of most lower luminosity spirals is similar to that of the more massive sample galaxies: global NMSFRs are reduced, but the inner NMSFRs are similar or mildly enhanced compared to the isolated sample. However, the lower luminosity sample also contains galaxies for which the global and inner rates have been significantly enhanced with respect to this and other isolated/field samples. The three galaxies with the highest total NMSFRs are all lower luminosity spirals. Their NMSFRs are enhanced by a factor of 3 in the median above isolated median rates, and they have corresponding equivalent widths of 70-100 Å, similar to the starbursts M82 and NGC 1569 (Kennicutt & Kent 1983). The inner disk NMSFRs of lower luminosity spirals are enhanced even more significantly with respect to our sample of isolated galaxies: by a factor up to 5 for the three galaxies with the highest global NMSFRs and by factors of 1.2-2.0 for several additional galaxies. In PIV, we discuss evidence that the star formation rates of these galaxies have been enhanced by environmental effects.
Thus many galaxies which have reduced global and outer disk star formation have normal or enhanced inner disk star formation rates. These results show that the primary mechanism of reduction in star formation for intermediate-low galaxies is the truncation of the outer disk rather than significant reductions across the disk.
6.3. H Concentration
The tendency for Virgo Cluster galaxies to have truncated star-forming disks and/or enhanced inner star formation rates means that the concentrations of H light for these galaxies will be systematically different than those of isolated galaxies. We define a quantitative measure of the H concentration as the ratio of the flux in H within 0.3 to the total H flux. The value will be higher for galaxies with truncated star forming disks and/or enhanced inner star formation rates. In contrast, we would not find a high value for a galaxy with anemic star formation, in which the H is distributed at low surface brightness over much of the disk.
The H concentration is plotted as a function of the R light central concentration in Figure 9. The dashed lines indicate the boundaries for galaxies which contain three-quarters, half, and one-quarter of their H emission within 0.3. Examination of the plot shows isolated galaxies typically have much of their star formation outside 0.3, while Virgo galaxies more typically have most of their star formation within 0.3. For example, only 4% of isolated spirals compared to 25% of Virgo Cluster spirals have at least three-quarters of their H emission within 0.3. This effect is largely due to the truncated star forming disks in Virgo Cluster galaxies. This is not due to a morphological effect, since the isolated sample contains proportionately more Sa than Virgo.

The H concentration does not reveal the relative level of star formation of a galaxy. In Figure 9, for example, S0 galaxies with reduced star formation have high H concentration values and therefore fall in similar locations as galaxies with active inner star formation and truncated disks. By plotting the H concentration versus the level of inner normalized H flux, as in Figure 10, it is apparent that a large proportion of Virgo Cluster galaxies have inner star formation rates similar to those of isolated Sb-Sc galaxies, but have much higher H concentration. Thus the Virgo galaxies tend to have inner disks with normal to enhanced star formation combined with truncated outer disks. In PIV, we show that the H concentration can be used with the global NMSFR as an indicator of the star formation morphology of a spiral galaxy.

7. The Star Formation Rates of HI Deficient Galaxies
Virgo Cluster spiral galaxies have long been known to have less HI gas than field counterparts (Chamaraux et al 1980; Giovanelli & Haynes 1983). Previous studies (e.g., Chamaraux, Balkowski, & Fontanelli 1986; Solanes et al. 2001; see also Kenney 1990) concluded that the reduction in HI gas, quantified with an HI deficiency parameter (Giovanelli & Haynes 1983; Solanes et al. 1996), has been more severe for early-type spiral galaxies. Based on this result, Chamaraux et al. (1986) and van Driel (1987) proposed that HI gas in early-type galaxies is more likely to be located in the outer disk, where it is easier to strip. Dressler (1986) suggested that HI deficient galaxies, which tend to have early-type classifications, are more likely to have radial orbits than HI rich galaxies, based on analysis of the velocity dispersions of HI rich and HI deficient galaxies in 9 clusters.

In light of the presence of a number of galaxies in the Virgo Cluster with misleading classifications, it is worth reexamining the relationship between HI deficiency and morphology. HI deficiencies were calculated following Solanes et al. (1996; see also Giovanelli & Haynes 1983). The values presented here for the Virgo Cluster have been updated from those presented in PI and are tabulated in PIV. HI fluxes were extracted from the Cornell University Extragalactic Group private digital HI archive, and are corrected for effects such as beam dilution (Springob, Haynes, & Giovanelli, in prep; see also Haynes & Giovanelli 1984). Optical diameters were obtained from the Arecibo General Catalog, a private database maintained at Cornell University by Martha Haynes and Riccardo Giovanelli. Distances are based on the heliocentric velocity and the multiattractor model for the velocity fields within the Local Supercluster (Tonry et al. 2000; Masters, K. L., private communication), with an assumed Hubble constant of 70 km s-1 Mpc-1.
In Figure 11, we plot HI deficiency versus , marking the points according to Hubble type, for the isolated and Virgo Cluster samples. The Virgo Cluster sample has many HI deficient galaxies: there is a large population of galaxies with HI depleted by at least a factor of 5. It also has several galaxies with HI enhanced by a factor of a few. In the isolated sample, there is almost no correlation between HI deficiency and either or Hubble type (except that most of the galaxies with depleted HI are highly concentrated galaxies classified as S0 or Sa). In the Virgo sample, there is also no correlation between HI deficiency and . However, there is a stronger correlation between Hubble type and HI deficiency, in that many of the galaxies with HI deficiency greater than 0.8 are classified as Sa, regardless of their central light concentration. It is thus clear from this plot that the correlation between HI deficiency and central concentration is much weaker than the correlation between HI deficiency and Hubble type.
The correlation between Hubble type and HI deficiency is really a reflection of a correlation between star formation rates and HI deficiency in the Virgo Cluster. In Figure 12, the normalized H fluxes are plotted versus the HI deficiency parameter, with symbols marked according to Hubble type. In the Virgo Cluster, there is a strong correlation between total normalized H flux and HI deficiency (see also Gavazzi et al. 2002), with the assignment of Hubble type tending in the same direction.

The stronger correlation between Hubble type and HI deficiency is one of the biases caused by forcing cluster galaxies into a one-dimensional classification system. Figures 11 and 12 together show that galaxies of any bulge-to-disk ratio can be strongly stripped of HI, suffer reduced star formation, and be classified as early type spirals. Therefore, the correlation between HI deficiency and Hubble type is no longer surprising, rather it is predominantly due to strongly stripped galaxies being classified as Sa’s, rather than galaxies with large bulge-to-disk ratios being preferentially stripped. We therefore suggest that the reason for the previously observed systematic difference in spatial distributions and kinematics between early- and late-type Virgo spirals is at least partially due to the fact that stripped spirals, which are preferentially on radial orbits (Solanes et al. 2001), tend to be misleadingly classified as early-types.
8. The Effects of Extinction on H Results
H will underestimate the true massive star formation rate due to extinction by dust. Since we have done a comparative study of Virgo Cluster and isolated galaxies, our results will be affected only if there is a systematic difference in extinction between the two samples.
There could be a systemic difference, since stripped galaxies likely have less dust as well as less gas. There are likely radial gradients in extinction, with more in the centers than the outer disks (Giovanelli et al. 1994, 1995). Stripping and truncation selectively removes the low extinction part of the disks, i.e. the outer gas and dust disks. So the true difference in star formation rates between the stripped and unstripped galaxies may be less than is indicated in H. Any difference should be less in the comparisons within distinct radial bins. The fact that we see large differences between the Virgo and isolated galaxies in the outer radial bins shows clearly that many outer Virgo disks are extremely deficient in H. However, the outer disk contains a smaller fraction of the global star formation rate than is indicated by uncorrected H, and the true global reduction in star formation rate may be less than is indicated by the H results.
Tracers of SF which measure dust emission, such as FIR, will be subject to the opposite problem of overemphasizing the inner disk. An improved treatment should use information from both optical and FIR emission to estimate the true radial profile of star formation.
9. Discussion
9.1. General Comments on the Morphology of Virgo Cluster spirals
Classification is inherently subjective and, as we and others have shown in the case of Virgo Cluster galaxies, can be dangerous and misleading. Objectives measures are generally preferable, but classification can have value, so here we offer some comments on an improved classification for large disk galaxies.
The standard Hubble classification scheme, as employed by Sandage and deVaucouleurs, uses both bulge-to-disk ratio and disk structure (closely related to disk star formation rate). This system cannot work for cluster galaxies because in Virgo the bulge-to-disk ratio is poorly correlated with the disk star formation rate. As pointed out by van den Bergh (1976), the Sa type has become a repository for galaxies with very different physical characteristics.
The van den Bergh (1976) RDDO system offers an important step in a more correct approach, by completely separating the spatial distribution of the old stars (i.e. bulge-to-disk ratio) from the the spatial distribution of the new stars (as measured, for example, by H). The three proposed evolutionary stages (normal spiral, anemic, and lenticular) are still not sufficient to describe the morphology of approximately half of the Virgo spirals in this sample, which have spatially truncated star formation profiles: a normal-enhanced inner disk star formation combined with weak-no outer disk star formation. Whereas many isolated and some Virgo galaxies might follow an evolutionary progression from normal spiral, through anemic, and then to lenticular, many cluster galaxies will not.
In broadband images, truncation of the star-forming disks results in a smooth outer disk combined with a clumpy inner disk. This effect was noticed by van den Bergh et al. (1990), who called galaxies with this morphology ”Virgo types”. While this morphology reflects the most frequently occurring type of environmental alteration in the Virgo Cluster, there are other peculiar morphologies in the Virgo Cluster, and so we have chosen not to use the term ‘Virgo-type’. We propose that an additional parallel branch could be added to the van den Bergh scheme, describing the truncated star formation morphology: STa - STb -STc, where the a-b-c division is based on the central light concentration or B/D. However, we reemphasize that attempts to characterize galaxy morphologies should be founded on objective measurements rather than subjective visual classification whenever possible. Studies such as Conselice (2003) offer promise for better characterizing galaxy morphologies in terms of a few relatively simple global parameters such as central concentration and asymmetry, which Conselice shows are correlated to a galaxy’s evolutionary state. The truncation phenomena, which seems most prevalent in cluster galaxies, should be included in any such objective parameter schemes.
9.2. Comparison to Previous Work on the Star Formation Properties of Cluster Galaxies
Most previous studies of cluster galaxies have been limited to measurements of global star formation. Comparisons between cluster and field samples produce varying results, as documented in the introduction. It is clear that the star formation activity in the Virgo Cluster spans a large range. We find, in agreement with a number of previous multiwavelength studies of Virgo (Kennicutt 1983a; Kodaira et al. 1990; Gavazzi et al. 2002), that the global star formation activity as traced by H has been reduced in the median. The amount of reduction may well be greater, since our study includes mostly spirals with at least some ongoing star formation activity. The selection of sample galaxies using the Hubble type may also lead to an underestimate in the reduction in star formation, since small-bulge galaxies which have ceased star formation are likely classified as S0’s.
The result that several Virgo Cluster spirals have enhanced star formation is relatively new for studies of the Virgo Cluster. This may be partly due to previous comparison samples. The Kennicutt & Kent (1983) study of H emission in Virgo cluster galaxies, for example, used a comparison sample of field galaxies, which included systems in groups, and in particular some starbursts (e.g., M82). Thus their study was not especially sensitive to rates of star formation enhanced above those found in isolated galaxies, which we are better able to quantify. We note that most of the Virgo Cluster galaxies with enhanced star formation have absolute B magnitudes between -18 and -19. This result is probably related to the observation that ‘k+a’ and emission-line galaxies in the Coma Cluster tend to be less luminous than ‘k+a’ counterparts at larger redshifts (Poggianti et al. 2004).
The Moss & Whittle (2000) study finds a high percentage of starbursting late-type spirals in 8 nearby Abell clusters. However, it is important to note that their survey was not sensitive to reductions in star formation activity because the survey has a rather high lower limit of on the strength of H. (Most of the galaxies in our sample have ) below 20 .) This means Moss & Whittle cannot detect differences between normal and reduced amounts of star formation, and they cannot determine whether the overall star formation rate in their clusters is higher or lower than non-cluster samples.
There are relatively few previous results on the spatial distributions of star formation for galaxies in clusters. Our work shows that most galaxies with reduced star formation in the Virgo Cluster have truncated star-forming disks, but normal-to-enhanced inner rates. Rotation curve studies (Rubin et al. 1999; Dale et al. 2001) also show the truncated H distributions of cluster galaxies. Dale et al. (2001) find on average more severely truncated galaxies closer to the cluster core (see also PIV).
Other studies have found evidence of centrally concentrated star formation morphologies in a number of cluster galaxies, which may be combined with a severe truncation of the star-forming disk. Caldwell et al. (1996) identified a population of starburst and poststarburst spirals in Coma, most of which have centrally concentrated star formation, typically within 1-2 kpc (Caldwell et al. 1999). Similar morphology galaxies are found in Pegasus I (Rose et al. 2001). These poststarburst galaxies were initially classified as E or S0, and yet all are spirals and about half have small-intermediate B/D. In a study of the S0’s in Coma, Poggianti et al. (2001) found that 40% show spectroscopic evidence for central star formation within the last 5 Gyr. Finally, Moss & Whittle (2000) find evidence of circumnuclear starbursts in a population of cluster galaxies.
Thus, this study and those cited above show that truncated star-forming disks with active inner star formation are prevalent in clusters, but less common in the field, suggesting that they are produced by environmental processing in clusters.
9.3. Environmental Effects in the Virgo Cluster
Studies of the spatial characteristics of star formation in the Virgo and other clusters are especially important because of the clues they provide in investigating the dominant environmental effects on galaxy evolution in clusters. In this section, we summarize the implications of this survey on the understanding of environmental effects in the Virgo Cluster. A more extensive discussion is given in PIV, where we investigate possible relationships between observed H morphologies and environmental effects.
The systematic reduction in the star formation rate in the outer disks of many Virgo spirals revealed by this study is in all likelihood due to the systematic removal of gas from the outer disk by the Virgo environment. Star formation ceases once the gas falls below a threshold determined by the local dynamics (Kennicutt 1989). The sharp spatial truncation of the H disks in such a high percentage of Virgo Cluster galaxies is most naturally explained by gas removal due to ICM-ISM interactions (e.g. Gunn & Gott; Nulsen 1982; Vollmer et al. 2001). In the case of starvation (Larson et al. 1980; Balogh, Navarro, & Morris 2000), i.e., the stripping of a loosely-bound outer gas reservoir (by the ICM and/or cluster potential field), one might expect to see a gradual reduction in star formation across the disk, resulting in a significant fraction of anemic spirals, which we show to be rare in the Virgo Cluster (see also PIV). While tidal interactions may be capable of eventually producing spirals with truncated gas disks (see for example, Kenney et al. 1995) and may be important in the evolution of many Virgo spirals (PIV), it is hard to explain how tidal interactions alone could account for such a large population of galaxies with spatially truncated gas disks. In addition, we show in PIV that many of the galaxies with truncated H disks have regular stellar isophotes.
If ICM-ISM stripping is an important effect in the Virgo Cluster, we would expect to see gas- and star-formation-poor galaxies with a continuum of bulge sizes. Our observations show that this is the case; in particular, we find significant numbers of small to intermediate bulge-to-disk ratio galaxies with truncated star forming disks.
The normal to enhanced star formation rates in the inner galaxy disks of Virgo spirals imply that ICM-ISM interactions have not had a strong effect on the inner regions of most Virgo (star-forming) galaxies. The inner star formation rates of even the severely HI deficient spirals are within the bounds of isolated spirals. This is consistent with the observation that the inner disks of galaxies are H2-dominated, and that CO luminosities are close to normal for Virgo galaxies compared to field galaxies (Kenney & Young 1989). Apparently the total gas surface density in inner disks is still high enough to allow star formation. While it has been suggested that enhancements in star formation may be caused by ICM-ISM interactions (e.g., Dressler & Gunn 1983; Gavazzi et al. 2001), it appears that our sample galaxies with enhanced global and inner disk star formation have been more strongly affected by processes other than ICM-ISM stripping (PIV).
Thus the results of this survey support the conclusion that ICM-ISM interactions play a significant role in the evolution of many Virgo Cluster spirals, by preferentially stripping gas from the outer disk. More detailed study of the H morphologies presented in PIV supports this conclusion and also indicates that tidal encounters and mergers are also important in explaining the optical and kinematical peculiarities (e.g., Rubin et al. 1999) of a number of Virgo Cluster spirals.
10. Conclusions
The results of this survey of star formation rates and morphologies of Virgo Cluster spirals compared to isolated spirals include the following:
1. H-based estimates of the total massive star formation rates of Virgo Cluster galaxies span a range from strongly reduced (up to 10 times) to enhanced (up to 2.5 times) compared to the isolated sample. In the median, Virgo total star formation rates are reduced by factors up to 2.5 for different Hubble types and concentrations.
2. For most Virgo Cluster galaxies with reduced total star formation, it is truncation rather than anemia (low H surface brightness across the disk) which causes the reduced total star formation rates. Median inner rates are similar or enhanced up to a factor of 1.7, while outer star formation rates are reduced in the median by factors of 1.5 - 9. In the outermost parts of the optical disks, star formation of all types and concentrations of galaxies are reduced by factors greater than 3 times in the median. Reductions in individual galaxies range to factors greater than 100. No galaxies have star formation rates in the outer half of the disk enhanced above isolated rates. Thus, most galaxies with reduced total star formation have inner star formation rates which are similar to or enhanced with respect to isolated galaxies of similar central light concentration or Hubble type. Virgo Cluster galaxies have more concentrated star forming disks than isolated counterparts, largely due to truncation.
3. The larger mean HI deficiency of Virgo cluster Sa’s as compared to cluster Sb and Sc’s (Solanes et al 2001) is predominantly due to strongly stripped galaxies being classified as Sa’s, rather than galaxies with large bulge-to-disk ratios being preferentially stripped. One reason for the previously observed systematic difference in spatial distributions and kinematics between early- and late-type Virgo spirals (Dressler 1986) is that stripped spirals, which are preferentially on radial orbits (Solanes et al 2001), tend to be misleadingly classified as early-types. Likewise, the excess of Sa galaxies in the Virgo cluster, and perhaps by extension other clusters, is in large part due to strongly stripped galaxies being classified as Sa’s, and is not simply an excess of spiral galaxies with large bulge-to-disk ratios.
The funding for the research on the Virgo cluster and isolated spiral galaxies was provided by NSF grants AST-9322779 and AST-0071251. Martha Haynes, Christopher Springob, Karen Masters, and the Cornell Extragalactic Group are gratefully acknowledged for their aid in derivation of updated HI deficiencies. We thank Judy Young, Vera Rubin, Yasuhiro Hashimoto, and Shardha Jogee for valuable discussions, and our referee, Alessandro Boselli, for helpful comments which improved this paper. This research has made use of the NASA/IPAC Extragalactic Database (NED) which is operated by the Jet Propulsion Laboratory, California Institute of Technology, under contract with the National Aeronautics and Space Administration.
References
- (1) Abraham, R. G., Valdes, F., Yee, H. K. C., & van den Bergh, S. 1994, ApJ, 432, 75
- (2) Abraham, R. G., Smecker-Hane, T. A., Hutchings, J. B., Carlberg, R. G., Yee, H. K. C., Ellingson, E., Morris, S., Oke, J. B., & Rigler, M. 1996, ApJ, 471, 694
- (3) Balogh, M. L., Navarro, J. F., & Morris, S. L. 2000, ApJ, 540, 113
- (4) Balogh, M. L., Schade, D., Morris, S., Yee, H. K. C., Carlberg, R. G., & Ellingson, E. 1998, ApJ, 504, 75
- (5) Bennett, S.M. & Moss, C. 1998, A&A, 132, 55
- (6) Bicay, M. D. & Giovanelli, R. 1987, ApJ, 321, 645
- (7) Binggeli, B., Sandage, A., & Tammann, G. A. 1985, AJ, 90, 1681 (BST)
- (8) Boselli, A., Gavazzi, G., Donas, J., & Scodeggio, M. 2001, AJ, 121, 753
- (9) Bothun, G. D. 1982, PASP, 94, 774
- (10) Butcher, H. & Oemler, A., Jr. 1978, ApJ, 219, 18
- (11) Caldwell, N., Rose, J. A., Franx, M., & Leonardi, A. 1996, AJ, 111, 78
- (12) Caldwell, N., Rose, J. A., & Dendy, K. 1999, AJ, 117, 140
- (13) Cayatte, V., van Gorkom, J. H., Balkowski, C., & Kotanyi, C. 1990, AJ, 100, 604
- (14) Chamaraux, P., Balkowski, C., & Gérard, E. 1980, A&A, 83, 38
- (15) Chamaraux, P., Balkowski, C., & Fontanelli, P. 1986, A&A, 165, 15
- (16) Conselice, C. J. 2003, ApJS, 147, 1
- (17) Dale, D. A., Giovanelli, R., Haynes, M. P., Hardy, E., Campusano, L. E. 2001, ApJ, 549, 215
- (18) deVaucouleurs, G., deVaucouleurs, A., Corwin, H. G., Buta, R. J., Paturel, G., & Fouqué, P. 1991, Third Reference Catalog of Bright Galaxies (New York: Springer-Verlag)
- (19) Donas, J, Buat, V., Milliard, B., & Laget, M. 1990, A&A, 235, 60
- (20) Dressler, A. 1980, ApJ, 236, 351
- (21) Dressler, A. 1986, ApJ, 301, 35
- (22) Dressler, A.& Gunn, J. E. 1983, ApJ, 270, 7
- (23) Dressler, A., Oemler, A., Couch, W. J., Smail, I., Ellis, R. S., Barger, A., Butcher, H., Poggianti, B. M., & Sharples, R. M. 1997, ApJ, 490, 577
- (24) Gavazzi, G., Boselli, A., & Kennicutt, R. 1991, AJ, 101, 1207
- (25) Gavazzi, G., Catinella, B., Carrasco, L., Boselli, A., Contursi, A. 1998, AJ, 115, 1745
- (26) Gavazzi, G., Boselli, A., Mayer, L., Iglesias-Paramo, J., Vilchez, J.M. & Carrasco, L. 2001, ApJ, 563, L23
- (27) Gavazzi, G., Boselli, A., Pedotti, P., Gallazzi, A. & Carrasco, L. 2002, A&A, 396, 449
- (28) Giovanelli, R. & Haynes, M. P. 1983, AJ, 88, 881
- (29) Giovanelli, R., Haynes, M. P., Salzer, J. J., Wegner, G., Da Costa, L. N., & Freudling, W. 1994, AJ, 107, 2036
- (30) Giovanelli, R., Haynes, M. P., Salzer, J. J., Wegner, G., Da Costa, L. N., & Freudling, W. 1995, AJ, 110, 1059
- (31) Gourgoulhon, E., Chamaraux, P., & Fouqué, P. 1992, A&A, 255,69
- (32) Graham, A. W. 2001, AJ, 121, 820
- (33) Graham, A. W., Trujillo, I., & Caon, N. 2001, AJ, 122, 1707
- (34) Gunn, J. E. & Gott, J. R. 1972, ApJ, 176, 1
- (35) Hameed, S. & Devereux, N. 1999, AJ, 118, 730
- (36) Hashimoto, Y., Oemler, A., Lin, H., & Tucker, D. L. 1998, ApJ, 499. 589
- (37) Haynes, M. P. & Giovanelli, R. 1984, AJ, 89, 758
- (38) Hubble, E. & Humason, M. L. 1931, ApJ, 74, 43
- (39) Kenney, J. D. P. 1990, in The Interstellar Medium in Galaxies, ed. H. A. Thronson & Shull, J.M. (Dordrecht: Kluwer), 151
- (40) Kenney, J.D.P. & Young, J. 1989, ApJ, 344,171
- (41) Kennicutt, R. C. 1983a, AJ, 88, 483
- (42) Kennicutt, R. C. 1983b, ApJ, 272, 54
- (43) Kennicutt, R. C. 1989, ApJ, 344, 685
- (44) Kennicutt, R. C. 1998, ARA&A, 36, 189
- (45) Kennicutt, R. C., Bothun, G. D., & Schommer, R. A. 1984, AJ, 89, 179
- (46) Kennicutt, R. C. & Kent, S. M. 1983, AJ, 88, 1094
- (47) Kent, S. M. 1985, ApJS, 59, 115
- (48) Kodaira, K., Watanabe, T., Onaka, T, & Tanaka, W. 1990, ApJ, 363, 422
- (49) Koopmann, R.A. & Kenney, J.D.P. 1998, ApJ, 497, L75
- (50) Koopmann, R. A., Kenney, J. D. P., Young, J. 2001, ApJS, 135, 125 (PI)
- (51) Koopmann, R.A. & Kenney, J.D.P. 2004, submitted (PIV)
- (52) Larson, R. B., Tinsley, B. M., & Caldwell, C. N. 1980, ApJ, 237, 692
- (53) Mihos, J. C. 2004, in “Clusters of Galaxies: Probes of Cosmological Structure and Galaxy Evolution”, ed. J. S. Mulchaey, A. Dressler, & A. Oemler (Cambridge: Cambridge Univ. Press), 278
- (54) Miller, R. H. 1988, Comm.Astrop. 13, 1
- (55) Moore, B., Lake, G., & Katz, N. 1998, ApJ, 495, 139
- (56) Moss, C. & Whittle, M. 1993, ApJ, 407, L17
- (57) Moss, C., & Whittle, M. 2000, MNRAS, 317, 667
- (58) Nulsen, P. E. J. 1982, MNRAS, 198, 1007
- (59) Oemler, A. 1974, ApJ, 194, 1
- (60) Oemler, A., Jr. 1992 in Clusters and Superclusters of Galaxies, ed. A.C. Fabian (Dordrecht: Kluwer), 29
- (61) Poggianti, et al. 2001, ApJ, 563, 118
- (62) Poggianti, B. M., Bridges, T. J., Komiyamia, Y., Yagi, M., Carter, D., Mobasher, B., Okamura, S., & Kashikawa, N. 2004, ApJ, 601, 197
- (63) Postman, M. & Geller, M. J. 1984, ApJ, 281, 95
- (64) Rose, J. A., Gaba, A. E., Caldwell, N., & Chaboyer, B. 2001, AJ 121, 793
- (65) Rubin, V.C., Waterman, A.H., & Kenney, J.D.P. 1999, AJ, 118,236
- (66) Sandage, A., & Bedke, J. 1994, The Carnegie Atlas of Galaxies (Washington: Carnegie)
- (67) Sandage, A., & Tammann, G. A. 1987, A Revised Shapley-Ames Catalog of Bright Galaxies (Washington: Carnegie)
- (68) Scodeggio, M., Gavazzi, G., Franzetti, P., Boselli, A., Zibetti, S., & Pierini, D. 2002, A&A, 384, 812
- (69) Solanes, J. M., Giovanelli, R., & Haynes, M. P. 1996, ApJ, 461, 609
- (70) Solanes, J. M., Manrique, A., Garcia-Gomez, C., Gonzalez-Casado, G., Giovanelli, R., & Haynes, M. P. 2001, ApJ, 548, 97
- (71) Struck, C. 1999, Physics Reports, 321, 1
- (72) Tonry, J. L., Blakeslee, J. P., Ajhar, E. A., & Dressler, A. 2000, ApJ, 530, 625
- (73) Tully, R. B. & Shaya, E. J. 1984, ApJ, 281, 31
- (74) Tully, R. B. 1987, Nearby Galaxies Catalog (Cambridge: Cambridge University Press)
- (75) van den Bergh, S. 1976, ApJ, 206, 883
- (76) van den Bergh, S., Pierce, M.J., & Tully, R. B. 1990, ApJ, 359, 4
- (77) van Driel, W., 1987, PhD thesis, Groningen
- (78) van Gorkom, J. H., in “Clusters of Galaxies: Probes of Cosmological Structure and Galaxy Evolution”, ed. J. S. Mulchaey, A. Dressler, & A. Oemler (Cambridge: Cambridge Univ. Press), 306
- (79) Vollmer, B., Cayatte, V., Balkowski, C., & Duschl, W. J. 2001, ApJ, 561, 708
- (80) Warmels, R. H. 1988, A&AS, 72, 19
- (81) Young, J.S., Allen, L., Kenney, J.D.P., Lesser, A., & Rownd, B. 1996, AJ, 112, 1903