Anisotropy at the end of the cosmic ray spectrum?
Abstract
The starburst galaxies M82 and NGC253 have been proposed as the primary sources of cosmic rays with energies above eV. For energies eV the model predicts strong anisotropies. We calculate the probabilities that the latter can be due to chance occurrence. For the highest energy cosmic ray events in this energy region, we find that the observed directionality has less than 1% probability of occurring due to random fluctuations. Moreover, during the first 5 years of operation at Auger, the observation of even half the predicted anisotropy has a probability of less than to occur by chance fluctuation. Thus, this model can be subject to test at very small cost to the Auger priors budget and, whatever the outcome of that test, valuable information on the Galactic magnetic field will be obtained.
I Introduction
Soon after the microwave echo of the big bang was discovered, Greisen, Zatsepin, and Kuzmin (GZK) noted that the relic photons make the universe opaque to cosmic rays (CRs) of sufficiently high energy Greisen:1966jv . This occurs, for instance, for protons with energies beyond the photopion production threshold ( resonance). After pion production, the proton (or perhaps, instead, a neutron) emerges with at least 50% of the incoming energy. A similar phenomenon (of energy degradation) occurs for nuclei due to processes of photodisintegration. Therefore, the characteristic attenuation length for extremely high energy () hadrons is less than 100 Mpc, decreasing down to 10 Mpc with rising energy Stanev:2000fb . The survival probability for extremely high energy (EHE) -rays (propagating on magnetic fields G) to a distance , , becomes less than after traversing a distance of 50 Mpc Elbert:1994zv . This implies that the GZK sphere gzk-sphere represents a small fraction of the size of the universe. Consequently, if the CR sources are universal in origin, the energy spectrum should not extend (except at greatly reduced intensity) beyond eV, a phenomenom known as the GZK cutoff. Even though the Haverah Park Ave:2001hq , Yakutsk Efimov:rk , Fly’s Eye Bird:wp , and HiRes :2002ta data show statistically significant evidence for such a cutoff Bahcall:2002wi (more than 5 independent of the sample used as a basis for extrapolation), the AGASA ground array detected a handful of events with energies eV Takeda:1998ps , as opposed to about 2 expected from the GZK cutoff. Moreover, within statistical uncertainty (which is large above eV) the flux of CRs above eV reported by the AGASA Collaboration Takeda:1998ps is consistent with a spectrum up to the highest observed energies, suggesting that a single acceleration mechanism is responsible for all the events beyond that energy, unless of course a very unlikely matching of spectra can account for the smoothness of the CR energy distribution.
In order to analyze the effect of energy losses on the observed spectrum, it is convenient to introduce the accumulation factor , defined as the ratio of energy-weighted fluxes for “low” ( eV – eV) and EHECRs. With this in mind, if the Earth is located in a typical environment and all CR-sources have smooth emission spectra, the observed spectrum above eV should have an offset in normalization between low and EHE given by . For CR protons and nuclei with uniform distribution of sources active over cosmological times, the cutoff due to photopion and photodisintegration processes relates the accumulation factor to a ratio of attenuation lengths Farrar:2000nw and leads to . The smoothness of the observed CR spectrum Takeda:1998ps , viz. , seems to indicate that the power of nearby sources must be comparable to that of all other sources (redshift ) added together.
The simplest explanation, i.e., nearby sources are significantly more concentrated, does not seem to be the case. Specifically, if one simply assumes that the distribution of CR sources follows the distribution of normal galaxies, the local overdensity is only a factor of two above the mean, and thus insufficient to explain the measured flux above eV Blanton:2000dr . Furthermore, the arrival direction of the super-GZK events is consistent with an isotropic distribution of sources (even when some level of clustering was already detected Uchihori:1999gu ), in sharp contrast to the anisotropic distribution of light within 100 Mpc Waxman:1996hp . A way to avoid the problems with finding plausible astrophysical explanations is to look for solutions involving physics beyond the standard model Bhattacharjee:1998qc . While the invocation of such new physics is an intringuing idea, there are now constraints that call into question the plausibility of some of these ideas Protheroe:1996pd .
Recently, it was suggested that the observed near-isotropy of arrival directions could be due to a diffuse propagation of EHECRs Lemoine:1999ys . In this work, we examine specific candidate sources for this hypothesis. These are the starburst galaxies M82 and NGC253 which have been shown to reproduce the main features of the observed flux Anchordoqui:2001ss . In particular, we study here the critical aspect of a residual anisotropy that emerge beyond the GZK energy limit after deflection in Galactic and extragalactic magnetic fields. Specifically, we estimate the probability that an apparent correlation between the arrival directions of the highest energy events and the two starbursts can originate as a purely random fluctuation. After that, we study the sensitivity of Auger Observatory to the model.
II Diffuse propagation of cosmic rays in a magnetized neighborhood of the Galaxy
A popular explanation considered recently Lemoine:1999ys for an isotropic distribution of arrival directions entertains the existence of large scale intervening magnetic fields, so that even EHECRs propagate diffusively. Indeed, there are some measurements of diffuse radio emission from the bridge area between Coma and Abell superclusters that under assumptions of equipartition allows an estimate of G for the magnetic field in this region Kim . Such a strong magnetic field (which is compatible with existing upper limits on Faraday rotation measurements Kronberg:1993vk ) could be possibly understood if the bridge region lies along a filament or sheet of large scale structures Ryu . In light of this, it appears plausible, though subject to verification, to assume that our Local Supercluster contains a large scale magnetic field (say, Anchordoqui:2001bs ) which provides sufficient bending to EHECR orbits, camouflaging the exact location of the sources.
Diffusion has two distinctive regimes. Particles that are trapped inside magnetic subdomains (of size ) follow Kolmogorov diffusion. In such a case, the functional dependence of energy of the difussion coefficient (for protons) is found to be Blasi:1998xp
| (1) |
where is the magnetic field strength in units of G and is the particle’s energy in units of eV. With rising energy, the Larmor radius of the particles starts approaching and there is a transition to Bohm diffusion. The diffusion coefficient in this regime is of order the Larmor radius times velocity ().
If CRs propagate diffusively, the radius of the sphere for potential proton sources becomes significantly reduced. This is because one expects negligible contribution to the flux from times prior to the arrival time of the diffusion front, and so the average time delay in the low energy region,
| (2) |
must be smaller than the age of the source, or else the age of the universe (if no source within the GZK radius is active today, but such sources have been active in the past). Note that the diffuse propagation of EHE protons requires magnetic fields G. Therefore, for typical coherence lengths of extragalactic magnetic fields ( Mpc) the time delay of CRs with eV cannot exceed Gyr, yielding a radius of Mpc. In the case CR sources are active today, the radius for potential sources is even smaller Mpc. Centaurus A, at a distance of 3.4 Mpc and galactic coordinates , is the nearest active galaxy, and the only one within a distance of 5 Mpc. Phenomenological arguments identify Centaurus A as a plausible progenitor of all CRs observed on Earth with energies eV Farrar:2000nw ; Anchordoqui:2001nt . However, detailed numerical simulations seem to indicate that large scale magnetic fields G) cannot provide sufficient angular deflection to explain all the observational data: (1) the large deflection angle of the highest energy event recorded by the Fly’s Eye experiment (see Table I) with respect to the line of sight to Centaurus A must be explained as a fluctuation Isola:2001ng , (2) for an emission spectrum and maximum injection energy of eV, the angular power spectrum shows a quadrupole deviation from AGASA observations Isola:2002ei .
If magnetic fields in the nanogauss range exist in the neighborhood of the Galaxy, it is possible that ultrahigh energy cosmic ray nuclei could diffuse sufficiently in order to attain the observed near-isotropy. For a CR nucleus of charge in a magnetic field G, the Larmor radius is
| (3) |
In this case, the sphere of potential sources is severely constrained by the GZK cutoff: less than 1% of iron nuclei (or any surviving fragment of their spallations) can survive more than s with an energy eV. Therefore, the assumption that EHECRs are heavy nuclei implies ordered extragalactic magnetic fields , or else nuclei would be trapped inside magnetic subdomains suffering catastrophic spallations. There are two candidate sources within the GZK sphere; namely, the nearby ( Mpc) metally-rich starburst galaxies M82 (, ) and NGC253 (, ) Anchordoqui:1999cu . Phenomenological considerations based on analytical estimates of the diffusion coefficient and approximations to the photodisintegration losses and angular deflections suggest that the power of these starbursts is enough to provide all CRs observed on Earth above eV Anchordoqui:2001ss . This analytical study is consistent with Monte Carlo simulations Bertone:2002ks . Specifically, the spectrum observed by AGASA can be fitted with a single source located at Mpc if the spectrum of nuclei is . This is a hard spectrum compared to the expected from the Fermi mechanism. In this context, it should be noted that the fit in Bertone:2002ks has strong statistical weight from points near 1019 eV. However, there is significant systematic uncertainty in the observed energy spectrum in this region. For example, as recently noted Bahcall:2002wi , a downward shift of 11% in the AGASA energy calibration is required in order to bring the resulting spectrum into agreement with Fly’s Eye data. This softening of the observed energies will require a steeper Fermi-like injection spectrum.
| Date | Experiment | [EeV] | Ref. | ||
|---|---|---|---|---|---|
| 89/05/07 | Yakutsk | Efimov:pw | |||
| 91/10/15 | Fly’s Eye | Bird:1994uy | |||
| 93/12/03 | AGASA | Hayashida:1994hb | |||
| 01/05/10 | AGASA | Sakaki |
The most salient feature of the starburst hypothesis is the prediction of an anisotropy at the high end of the spectrum. For an extragalactic, smooth, magnetic field of nG, diffusive propagation of particles below eV evolves to nearly complete isotropy in the CR arrival directions Anchordoqui:2001ss ; Bertone:2002ks . Above this critical energy there is a transition range (up to ) where the combined bending in extragalactic and Galactic magnetic fields leads to loss of directionality. With rising energy, the average deflection in the extragalactic magnetic field is significantly reduced, and is roughly in the energy range Bertone:2002ks . In order to incorporate typical uncertainties in energy resolution as well as those in the Monte Carlo simulation Bertone:2002ks , we will increase the upper limit of this deflection to 30∘. Heavy nuclei suffer additional deflection in the Galactic magnetic field.
The large scale structure of the Galactic magnetic field carries substantial uncertainties, because the position of the solar system does not allow global measurements. The average field strength can be directly determined from pulsar observations of the rotation and dispersion measures average along the line of sight to the pulsar with a weight proportional to the local free electron density, G Manchester . Measurements of polarized synchrotron radiation as well as Faraday rotation of the radiation emitted from pulsars and extragalactic radio sources revealed that the global structure of the magnetic field in the disk of our Galaxy could be well described by spiral fields with (axisymmetric, ASS) or (bisymmetric, BSS) symmetry Beck . In the direction perpendicular to the Galactic plane the fields are either of odd (dipole type) or even (quadrupole type) parity. Discrimination between these models is complicated. Field reversals are certainly observed (in the Crux-Scutum arm at 5.5 kpc from the Galactic center, the Carina-Sagittarius arm at 6.5 kpc, the Perseus arm at 10 kpc, and possibly another beyond Han:1999vi ). However, as discussed by Vallée Vallee , turbulent dynamo theory can explain field reversals at distances up to 15 kpc within the ASS configuration. Interestingly, if the Galactic field is of the ASS type, CRs entering the Galaxy with are deflected towards increasing values of and decreasing values of Stanev:1996qj . Consequently, as we show in what follows, each arrival direction given in Table I can be traced backwards to one of the starbursts.
The field strength in the Galactic plane () for the ASS model is generally described by Stanev:1996qj
| (4) |
where is the azimuthal coordinate around the Galactic center (clockwise as seen from the north Galactic pole), is the galactocentric radial cylindrical coordinate, and
| (5) |
Here, kpc stands for the galactocentric distance of the maximum of the field in our spiral arm, (with the pitch angle, ), kpc is the Sun’s distance to the Galactic center, and kpc. The and coordinates of the field are correspondingly,
| (6) |
The field strength above and below the Galactic plane (i.e., the dependence on ) has a contribution coming from the disk and another from the halo,
| (7) | |||||
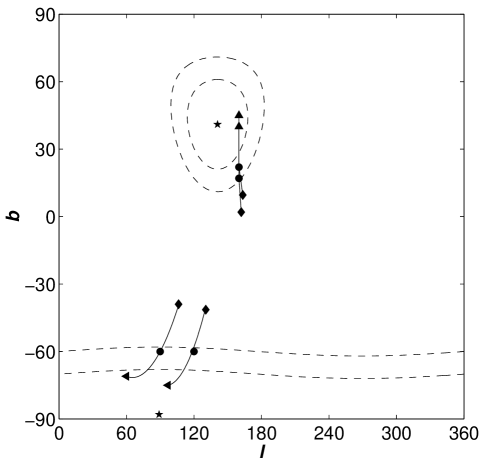
where kpc, kpc and pc. Figure 1 shows the extent to which the observed arrival directions of the CRs listed in Table I deviate from their incoming directions at the Galactic halo because of bending in the magnetic field given in Eq. (7). The incoming CR trajectories are traced backwards up to distances of 20 kpc away from the Galactic center, where the effects of the magnetic field is negligible. The diamond at the head of each solid line denotes the observed arrival direction, and the points along these lines indicate the direction from which different nuclear species (with increasing mass) entered the Galactic halo. In particular, the tip of the arrows correspond to incoming directions at the halo for iron nuclei, whereas the circles correspond to nuclei of neon. Additionally shown in the figure, indicated by stars, is the location of the two starbursts. Regions within the dashed lines comprise directions lying within and degrees of the starbursts. It is seen that trajectories for CR nuclei with can be further traced back to one of the starbursts, within the uncertainty of the extragalactic deviation.
The trajectories in Fig. 1 result from motion in the regular component of the Galactic magnetic field. However, there is some evidence supporting the existence of a random component roughly comparable in magnitude to the regular component Beck:2000dc . Thus, using the random walk formulation Waxman:1996zn with coherence lengths of kpc, we estimate that the trajectories should be broadened by an angle The effect of this broadening on our analysis will be further discussed in the following section.
The effects of the BSS configuration are completely different. Because of the averaging over the frequent field reversals, the resulting deviations of the CR trajectories are markedly smaller, and in the wrong direction for correlation of current data with the starburst sources. We note that the energy-ordered 2D correlation distribution of the AGASA data is in disagreement with expectations for positively charged particles and the BSS configuration Alvarez-Muniz:2001ur .
III Assessment of random coincidences
We now attempt to assess to what extent these correlations are consistent with chance coincidence. To do so, we first observe that the angular deviation of a CR arrival direction at the outer edge of the galaxy with respect to the straight line of sight is roughly
| (8) |
Hence, for kpc, the average deflection of heavy nuclei with energies in the range is . We arrive at the effective angular size of the source in a two-step process. Before correcting for bias due to the coherent structure of the Galactic magnetic field, the deflections in the extragalactic and Galactic fields (regular and random components) may be assumed to add in quadrature, so that the angular sizes of the two sources are initially taken as cones with opening half-angles between 40∘ and 60∘, which for the purpose of our numerical estimate we approximate to 50 However, the global structure of the field will introduce a strong bias in the cosmic ray trajectories, substantially diminishing the effective solid angle. The combined deflections in the and coordinates mentioned above concentrate the effective angular size of the source to a considerably smaller solid angle Stanev:1996qj . As a conservative estimate, we retain 25% of this cone as the effective source size. A clear prediction of this consideration is that the incoming flux shows a strong dipole anisotropy in the harmonic decomposition.
In order to assess the likelihood of a random occurrence of the predicted spatial distribution we performed numerical simulations in the spirit of Ref. Romero:1999tk . By randomly generating four CR positions in the portion of the sky accessible to the existing experiments (declination range ), an expected number of random coincidences can be obtained. The term “coincidence” is herein used to label a synthetic CR whose position in the sky lies within an effective solid angle of either starburst. is characterized by a cone with opening half-angle reduced from to to account for the 75% reduction in effective source size due to the magnetic biasing discussed above. Cosmic ray positional errors were considered as circles of radius for AGASA. For the other experiments the asymmetric directional uncertainty was represented by a circle with radius equal to the average experimental error. Figure 2 presents the simulation results. There are, as we have seen, four real coincidences. However, the random prediction for the mean number of coincidences is sd . The Poisson probability Goldberg:2000zq for the real result to be no more than the tail of the random distribution is just
| (9) |
where is the mean value of the random results. Alternatively, we may analyze this in terms of confidence intervals. For the four observed events, with zero background, the Poisson signal mean 99% confidence interval is Feldman:1997qc . Thus our observed mean for random events, , falls at the lower edge of this interval, yielding a 1% probability for a chance occurrence.
We now discuss the implications of our results. Clearly, spatial correlation analysis with a well defined and large sample of CR positions ought to provide the key to the identification of EHECR sources. The result embodied in Eq. (9) is not compelling enough to definitively rule out chance probability as generating the correlation of the observed events with the candidate sources, but it is suggestive enough to deserve serious attention in analyses of future data. Besides, it should be stressed that the starburst hypothesis predicts a spectrum which is approximately a smooth power law between eV and eV, in very good agreement with that reported by the AGASA Collaboration Anchordoqui:2001ss . In addition, we note that a medium mass nucleus fits the shower profile of the highest energy Fly’s Eye event quite well Halzen:1994gy . Moreover, the high muon density observed in the Yakutsk event also favors a nucleus primary Efimov:pw .
IV Low budget anisotropy target for the highest energy cosmic rays
The superior angular and energy resolution of the Pierre Auger Observatory Anchordoqui:2002hs will allow the high end of the energy spectrum and the CR arrival directions to be measured with unprecedented precision. The protocols for testing anisotropy detection claims are being restricted to hypotheses that must be specified a priori in order to ensure: (1) that the sample is not (inadvertently) devised to suit a special hypothesis after a preliminary study of the data, and (2) that the number of potential sources is not so large that the criterion for negating the null hypothesis for any source is reasonable Clay . Since the budgeting for candidate sources of anisotropy is very constrained (total random probability after accounting for all relevant trials is less than 0.001) particular emphasis should be put – in our view – to those models in which there is no new physics involved, and a plausible astrophysical mechanism is suggested as the origin of some or all events. Some examples are: the above mentioned Centaurus A, nearby quasar remnants Torres:2002bb , and luminous infrared galaxies Smialkowski:ty . In this direction, we believe the reasons we just listed above are sufficient to encourage the Auger community to search for evidence of the starburst model in forthcoming measurements.
We now estimate the sensitivity of Auger to our model. The event rate for the Southern Auger Observatory (a detector with aperture km2 sr above eV, and angular resolution less than with ), assuming extrapolation of AGASA flux ( eV2 m-2 s-1 sr-1 Takeda:1998ps ) up to eV, is given by
| (10) | |||||
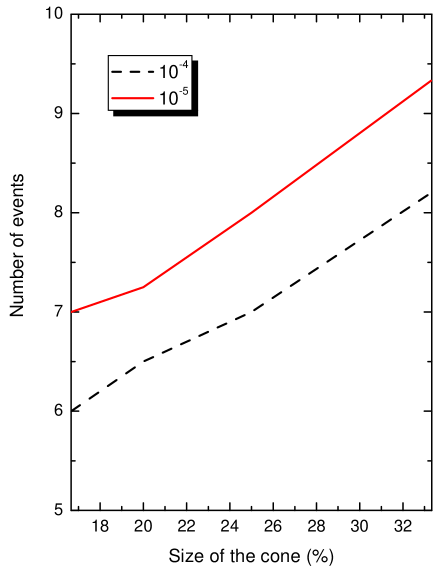
where eV and eV. We now consider a 5-year sample of 25 events, and note that for the energy range under consideration the aperture of Auger is mostly receptive to cosmic rays from NGC253. We allow for different possibilities of the effective reduction of the cone size because of the Galactic magnetic field biasing discussed previously. In Fig. 3 we plot contours of constant probabilities () in the two-dimensional parameter space of the size of the cone (as a fraction of the full circle) and the minimum number of events originating within the resulting effective solid angle. Several important conclusions may be drawn. First, there is very little sensitivity of the results to the size of the cone, the variation is less than 20% for a 50% reduction in the cone size. Secondly, the model predicts that after 5 years of operation, all of the 25 highest energy events would be observed in the aperture described above. From Fig. 3 we can see that even if 7 or 8 are observed, this is sufficient to rule out a random fluctuation at the level. Thus, the disproof of the starburst hypothesis can be achieved at a very small cost, out of a total to the Auger probability budget. Current preliminary assignments for other hypotheses are on the order of Clay .
V Conclusion
We have made a definite prediction for future observations at the Auger Observatory: if the origin of CRs above eV are nearby starburst galaxies, the incoming CR flux will show a strong dipole anisotropy in the harmonic decomposition at energies beyond eV. Because of its well-defined prediction, the model can be tested at the 5 level in five years of running at Auger. Therefore, we strongly recommend that the Auger Collaboration take into account the next-door galaxy NGC253 in their first anisotropy prescription for super-GZK CRs. The confirmation of the starburst hypothesis would provide, as spinoff, direct evidence for the global structure of the Galactic magnetic field.
Acknowledgments
The work of L.A.A. and H.G. has been partially supported by the US National Science Foundation (NSF), under grants No. PHY–0140407 and No. PHY–0073034, respectively. The work of D.F.T. was performed under the auspices of the U.S. Department of Energy by University of California Lawrence Livermore National Laboratory under contract No. W-7405-Eng-48.
References
- (1) K. Greisen, Phys. Rev. Lett. 16 (1966) 748; G. T. Zatsepin and V. A. Kuzmin, JETP Lett. 4, 78 (1966) [Pisma Zh. Eksp. Teor. Fiz. 4, 114 (1966)].
- (2) T. Stanev, R. Engel, A. Mucke, R. J. Protheroe and J. P. Rachen, Phys. Rev. D 62, 093005 (2000) [arXiv:astro-ph/0003484]; F. W. Stecker and M. H. Salamon, Astrophys. J. 512, 521 (1992) [arXiv:astro-ph/9808110]; L. N. Epele and E. Roulet, JHEP 9810, 009 (1998) [arXiv:astro-ph/9808104].
- (3) J. W. Elbert and P. Sommers, Astrophys. J. 441, 151 (1995) [arXiv:astro-ph/9410069].
- (4) The sphere within which a source has to lie in order to provide us with EHECRs if the primaries are subject to the GZK cutoff phenomenon.
- (5) M. Ave, J. Knapp, J. Lloyd-Evans, M. Marchesini and A. A. Watson, arXiv:astro-ph/0112253.
- (6) N. N. Efimov, T. A. Egorov, A. V. Glushkov, M. I. Pravdin and I. E. Sleptsov, in Astrophysical Aspects of the Most Energetic Cosmic Rays, (Eds. M. Nagano and F. Takahara, World Scientific, 1991), p.20.
- (7) D. J. Bird et al. [HIRES Collaboration], Astrophys. J. 424, 491 (1994).
- (8) T. Abu-Zayyad et al. [High Resolution Fly’s Eye Collaboration], arXiv:astro-ph/0208243; T. Abu-Zayyad et al. [High Resolution Fly’s Eye Collaboration], arXiv:astro-ph/0208301.
- (9) J. N. Bahcall and E. Waxman, Phys. Lett. B 556, 1 (2003) [arXiv:hep-ph/0206217].
- (10) M. Takeda et al., Phys. Rev. Lett. 81, 1163 (1998) [arXiv:astro-ph/9807193]; N. Hayashida et al., Astrophys. J. 522, 225 (1999) [arXiv:astro-ph/0008102]; M. Takeda et al., arXiv:astro-ph/0209422.
- (11) G. R. Farrar and T. Piran, arXiv:astro-ph/0010370.
- (12) M. Blanton, P. Blasi and A. V. Olinto, Astropart. Phys. 15, 275 (2001) [arXiv:astro-ph/0009466].
- (13) Y. Uchihori, M. Nagano, M. Takeda, M. Teshima, J. Lloyd-Evans and A. A. Watson, Astropart. Phys. 13 (2000) 151 [arXiv:astro-ph/9908193]; P. G. Tinyakov and I. I. Tkachev, JETP Lett. 74, 1 (2001) [Pisma Zh. Eksp. Teor. Fiz. 74, 3 (2001)] [arXiv:astro-ph/0102101]; L. A. Anchordoqui, H. Goldberg, S. Reucroft, G. E. Romero, J. Swain and D. F. Torres, Mod. Phys. Lett. A 16, 2033 (2001) [arXiv:astro-ph/0106501].
- (14) E. Waxman, K. B. Fisher and T. Piran, Astrophys. J. 483, 1 (1997) [arXiv:astro-ph/9604005].
- (15) See e.g., P. Bhattacharjee and G. Sigl, Phys. Rept. 327, 109 (2000) [arXiv:astro-ph/9811011]; S. Sarkar, arXiv:hep-ph/0202013; P. Bhattacharjee and G. Sigl, Prepared for Physics and Astrophysics of Ultrahigh-energy Cosmic Rays, Meudon, France, 26-29 Jun 2000; G. Sigl, arXiv:astro-ph/0210049.
- (16) See e.g., R. J. Protheroe and T. Stanev, Phys. Rev. Lett. 77, 3708 (1996) [Erratum-ibid. 78, 3420 (1997)] [arXiv:astro-ph/9605036]; F. Csikor and Z. Fodor, light gluino window,” Phys. Rev. Lett. 78, 4335 (1997) [arXiv:hep-ph/9611320]; L. Anchordoqui, H. Goldberg, T. McCauley, T. Paul, S. Reucroft and J. Swain, Phys. Rev. D 63, 124009 (2001) [arXiv:hep-ph/0011097]; L. A. Anchordoqui, J. L. Feng, H. Goldberg and A. D. Shapere, Phys. Rev. D 66, 103002 (2002) [arXiv:hep-ph/0207139].
- (17) M. Lemoine, G. Sigl and P. Biermann, arXiv:astro-ph/9903124; G. R. Farrar and T. Piran, Phys. Rev. Lett. 84, 3527 (2000) [arXiv:astro-ph/9906431].
- (18) L. Anchordoqui, H. Goldberg, S. Reucroft and J. Swain, Phys. Rev. D 64, 123004 (2001) [arXiv:hep-ph/0107287].
- (19) K.-T. Kim, P. P. Kronberg, G. Giovannini and T. Venturi, Nature 341, 720 (1989). Fields of are also indicated in a more extensive study of 16 low redshift clusters. T. E. Clarke, P. P. Kronberg and H. Böhringer, Astrophys. J. 547, L111 (2001).
- (20) P. P. Kronberg, Rept. Prog. Phys. 57, 325 (1994); J. P. Vallée, Astrophys. J. 360, 1 (1990)
- (21) D. Ryu, H. Kang, and P. L. Biermann, Astron. Astrophys. 335, 19 (1998).
- (22) The lower bound comes from the analysis in, L. A. Anchordoqui and H. Goldberg, Phys. Rev. D 65, 021302 (2002) [arXiv:hep-ph/0106217].
- (23) P. Blasi and A. V. Olinto, Phys. Rev. D 59 (1999) 023001 [arXiv:astro-ph/9806264].
- (24) L. A. Anchordoqui, H. Goldberg and T. J. Weiler, Phys. Rev. Lett. 87, 081101 (2001) [arXiv:astro-ph/0103043].
- (25) N. N. Efimov, N. N. Efremov, A. V. Glushkov, I. T. Makarov and M. I. Pravdin, in Astrophysical Aspects of the Most Energetic Cosmic Rays, (Eds. M. Nagano and F. Takahara, World Scientific, 1991), p.434; E. E. Antonov et al., JETP Lett. 69, 650 (1999) [Pisma Zh. Eksp. Teor. Fiz. 69, 614 (1999)].
- (26) D. J. Bird et al., Astrophys. J. 441, 144 (1995).
- (27) N. Hayashida et al., Phys. Rev. Lett. 73, 3491 (1994).
- (28) N. Sakaki et al., in Proceedings of the 27th International Cosmic Ray Conference ICRC2001 (Copernicus Gesellschaft, 2001), p.337.
- (29) C. Isola, M. Lemoine and G. Sigl, Phys. Rev. D 65, 023004 (2002) [arXiv:astro-ph/0104289].
- (30) C. Isola and G. Sigl, arXiv:astro-ph/0203273.
- (31) L. A. Anchordoqui, G. E. Romero and J. A. Combi, Phys. Rev. D 60, 103001 (1999) [arXiv:astro-ph/9903145].
- (32) G. Bertone, C. Isola, M. Lemoine and G. Sigl, arXiv:astro-ph/0209192.
- (33) R. N. Manchester, Astrophys. J. 188, 637 (1974); R. C. Thomson and A. H. Nelson, Mont. Not. Roy. Astron. Soc. 191, 863 (1980); J. L. Han and G. J. Qiao, Astron. Astrophys. 288, 759 (1994); C. Indrani and A. A. Deshpande, New Astron. 4, 33 (1998).
- (34) R. Beck, A. Brandenburg, D. Moss, A. Shukurov, and D. Sokoloff, Ann. Rev. Astron. Astrophys. 34, 155 (1996).
- (35) J. L. Han, R. N. Manchester and G. J. Qiao, Mont. Not. Roy. Astron. Soc. 306, 371 (1999) [arXiv:astro-ph/9903101].
- (36) J. P. Vallée, Astrophys. J. 366, 450 (1991).
- (37) T. Stanev, Astrophys. J. 479, 290 (1997) [arXiv:astro-ph/9607086]; D. Harari, S. Mollerach and E. Roulet, JHEP 9908, 022 (1999) [arXiv:astro-ph/9906309].
- (38) R. Beck, arXiv:astro-ph/0012402.
- (39) E. Waxman and J. Miralda-Escude, Astrophys. J. 472, L89 (1996) [arXiv:astro-ph/9607059].
- (40) J. Alvarez-Muniz, R. Engel and T. Stanev, arXiv:astro-ph/0112227.
- (41) G. E. Romero, P. Benaglia and D. F. Torres, Astron. Astrophys. 348, 868 (1999) [arXiv:astro-ph/9904355]; G. Sigl, D. F. Torres, L. A. Anchordoqui and G. E. Romero, Phys. Rev. D 63, 081302 (2001) [arXiv:astro-ph/0008363].
- (42) The standard deviation of the 4500 trial sample is 0.8, giving a standard deviation of 0.01 for the mean.
- (43) Because of constraints inherent in partitioning events among clusters, the distributions are very close to, but not precisely Poisson. H. Goldberg and T. J. Weiler, Phys. Rev. D 64, 056008 (2001) [arXiv:astro-ph/0009378].
- (44) G. J. Feldman and R. D. Cousins, Phys. Rev. D 57, 3873 (1998) [arXiv:physics/9711021].
- (45) F. Halzen, R. A. Vazquez, T. Stanev and H. P. Vankov, Astropart. Phys. 3, 151 (1995); L. A. Anchordoqui, M. Kirasirova, T. P. McCauley, S. Reucroft and J. D. Swain, Phys. Lett. B 492, 237 (2000) [arXiv:astro-ph/0007403].
- (46) See, for instance, L. Anchordoqui, T. Paul, S. Reucroft and J. Swain, arXiv:hep-ph/0206072.
- (47) R. Clay, B. Dawson, B. Fick, M. Roberts, and P. Sommers, GAP Note 2001-047. Electronically available at http://www.auger.org/admin/GAP-Notes/index.html.
- (48) D. F. Torres, E. Boldt, T. Hamilton and M. Loewenstein, Phys. Rev. D 66, 023001 (2002) [arXiv:astro-ph/0204419].
- (49) A. Smialkowski, M. Giller and W. Michalak, J. Phys. G 28 (2002) 1359 [arXiv:astro-ph/0203337].