The -process branching at 185W
Abstract
The neutron capture cross section of the unstable nucleus 185W has been derived from experimental photoactivation data of the inverse reaction 186W(,)185W. The new result of mbarn confirms the theoretically predicted neutron capture cross section of 185W of mbarn at keV. A neutron density in the classical -process of cm-3 is derived from the new data for the 185W branching. In a stellar -process model one finds a significant overproduction of the residual -only nucleus 186Os.
1 Introduction
The unstable nucleus 185W is a so-called branching point in the slow neutron capture process (-process). The nucleus 185W is produced by neutron capture in the -process from the stable 184W. At small neutron densities 185W -decays to 185Re with a half-life of d, and it has been pointed out that the -decay half-life does practically not depend on the temperature at typical -process conditions (Takahashi & Yokoi, 1987). At higher neutron densities 185W may capture one more neutron leading to the stable 186W. It is obvious that the branching between -decay and neutron capture depends on the -decay half-life, the neutron capture cross section, and the neutron density. The half-life and the neutron capture cross section can be measured in the laboratory, and therefore one can determine the neutron density from the observed abundances of the various tungsten isotopes (Käppeler et al., 1991). Additionally, this branching has minor influence on the 187Os/187Re cosmochronometer (Bosch et al., 1996).
Up to now, only theoretical estimates are available for the neutron capture cross section of 185W because direct neutron capture experiments with radioactive targets are very difficult. Theoretical predictions for the Maxwellian averaged capture cross section at a typical temperature of 30 keV vary significantly from 532 mbarn (Käppeler et al., 1991) and 560 mbarn (Rauscher & Thielemann, 2000) to 794 mbarn (Holmes et al., 1976). In a recent compilation a value of mbarn has been adopted (Bao et al., 2000). All calculations used the statistical model. The differences in the results come from the parameterizations of the level density, the gamma-ray strength function, and the neutron-nucleus optical potential.
In order to reduce the uncertainties, a new experiment was performed on the inverse reaction 186W(,)185W. The idea is to find a parameter set for the calculations which reproduces the cross section of 186W(,)185W, and to apply these parameters for the prediction of the 185W(,)186W cross section. Such a prediction should be more reliable for one special reaction than previous calculations which used global or local systematics to derive the relevant parameters from neighboring nuclei. The relevant energy region is located close above the threshold of the (,) reaction at keV (Mohr et al., 2001). At higher energies experimental data on the 186W(,)185W reaction are available in literature (Berman et al., 1969; Goryachev & Zalesnyĭ, 1978; Gurevich et al., 1981), and the results can be found in the compilations of Dietrich & Berman (1988) and in CDFE (Varlamow et al., 2001). We have performed an additional measurement at energies close above the threshold.
2 Experimental Set-up and Procedure
The 186W(,)185W experiment was performed using the photoactivation technique at the real photon set-up at the superconducting linear electron accelerator S-DALINAC (Richter, 1996). Recently, several photoactivation experiments have been performed here (Mohr et al., 2000a; Vogt et al., 2001; Lindenberg et al., 2001; Mohr et al., 2000b), and (,) cross sections and reaction rates were determined using a quasi-thermal photon bath at temperatures of several K. These data are relevant for the nucleosynthesis of the neutron-deficient so-called -nuclei (Lambert, 1992).
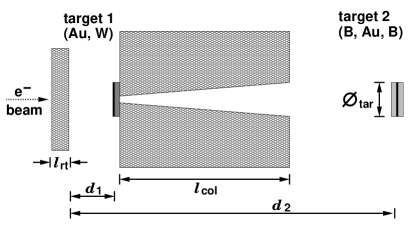
Photons were generated by bremsstrahlung using our electron beam at an energy of keV and with a beam current of about A. Usually, the photon beam is collimated and hits the target at a distance 150 cm behind the radiator target. This leads to a well-defined photon beam with a spectral composition which was analyzed in detail (Vogt et al., 2001). However, because of the relatively long half-life of 185W ( days) and the weak -ray branch ( keV) in the -decay of 185W to 185Re of only (Kempisty & Pochwalski, 1992) the irradiation of 186W had to be performed with the highest photon flux that can be obtained at our irradiation set-up. Therefore, the tungsten target was mounted directly behind the radiator target ( 5 cm) where the photon intensity is roughly a factor of 300 higher than at our usual irradiation position. Fig. 1 shows an overview of our experimental setup. The target consisted of a thin metallic tungsten disk of natural isotopic composition with a diameter of 20 mm and a thickness of about 1.2 mm. Note that the amount of target material remains limited because of the absorption of the low-energy decay -ray in the target. Properties of the target are summarized in Table 1. The decay properties of the residual nuclei are listed in Table 2.
To minimize systematic uncertainties from the photon flux determination at the position directly behind the radiator target, a relative measurement was carried out. We irradiated simultaneously the tungsten target and a very thin (25 m) gold disk at the position close to the radiator target. A second thin gold disk was sandwiched between two layers of boron. This sandwich target was mounted at the regular target position and irradiated simultaneously with the tungsten and gold targets close to the radiator. The boron target is used to normalize the incoming photon intensity by the 11B(,) reaction. From the absolute photon intensity at the regular target position and from the activation of the second thin gold target one can determine the (,) cross section of 197Au. The complete determination of the 197Au(,)196Au cross section is presented in Vogt et al. (2002). And, finally, the 186W(,) cross section can be determined from the ratios of activities of the gold and tungsten targets close to the radiator. Absorption of bremsstrahlung -rays in the targets can be neglected. Typical uncertainties for the photon flux determination are of the order of 10 %. Further details of the experimental set-up can be found in Vogt et al. (2001) and Mohr et al. (1999).
The decay -rays of the activated tungsten and gold targets were measured using a well-shielded high-purity germanium (HPGe) detector with a relative efficiency of 30 % and an energy resolution of 2 keV (at 1332.5 keV). A typical spectrum of the tungsten target is shown in Fig. 2. We followed the decay of the activity over more than one half-life, and the analysis of our decay curve leads to a half-life of d which agrees with the adopted value of d (ENSDF, 2001) within the uncertainties. The precise exponential decay of the activity confirms that the analyzed -ray line does not accidentally overlap with a background line. Of course, also the excellent energy resolution of the HPGe detector helps to measure a weak -ray branching. The efficiency of the HPGe detector was determined by calibrated sources (Vogt et al., 2001). Additionally, for the 125.4 keV -ray from the 185W decay the self-absorption in the tungsten target was taken into account by GEANT simulations (Brun & Carminati, 1993), and the GEANT simulations of the absorption in tungsten were verified by transmission measurements of the tungsten target. The resulting uncertainty of the relative efficiency is about 5 %.
The yield in our experiment is proportional to the energy-integrated cross section :
| (1) |
with : endpoint energy of the bremsstrahlung and kinetic energy of the electron beam; : number of bremsstrahlung photons at an energy and with the endpoint energy ; : 186W(,)185W cross section. The factor between the yield and the energy-integrated cross section depends on characteristics of the observed isotope as well as on parameters of the experimental setup (Vogt et al., 2001). From the experimentally measured yield ratio between the tungsten and the gold yields one can derive the ratio of the integrated cross sections with relatively small uncertainties. Note that the relatively large value of this ratio does not indicate that the cross section of 186W is much larger than the cross section of 197Au. The reason for this large ratio is the much smaller neutron separation energy of 186W compared to 197Au which leads to a broader integration range in Eq. (1) for 186W.
It is not possible to determine the energy dependence of the 186W(,)185W cross section from one photoactivation measurement with a white bremsstrahlung spectrum. If one adopts the theoretically calculated energy dependence of the cross section (see § 3), it is possible to solve the integral in Eq. (1) and to determine a normalization factor for the theoretical calculation by comparison of the theoretically predicted and experimentally measured yields. In the case of the 186W(,)185W reaction this leads to normalization factors of close to unity for two different calculations of the 186W(,)185W cross section (see § 3). The same factors should be used for the prediction of the inverse 185W(,)186W cross section.
The reaction 197Au(,)196Au has been used to normalize the 186W(,)185W experiment. The determination of the 197Au(,)196Au cross section has been performed similar to Vogt et al. (2001) and is published elsewhere (Vogt et al., 2002). Our new data agree nicely with several previous experiments (Berman et al., 1987; Veyssière et al., 1970) and a recent experiment with monochromatic photons from Laser-Compton backscattering (Utsunomiya, 2001).
The experimental uncertainties are dominated () by the photon flux determination which enters into the analysis of the experimental yields in Eq. (1) for both the target 186W and the standard 197Au, and () by the self-absorption of the 125.4 keV -ray in the tungsten target. The total uncertainty for the normalization factors is 14 %.
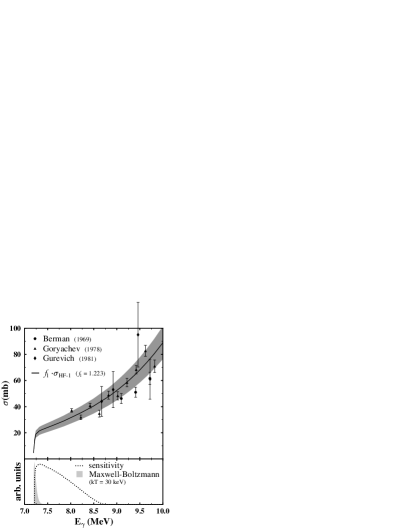
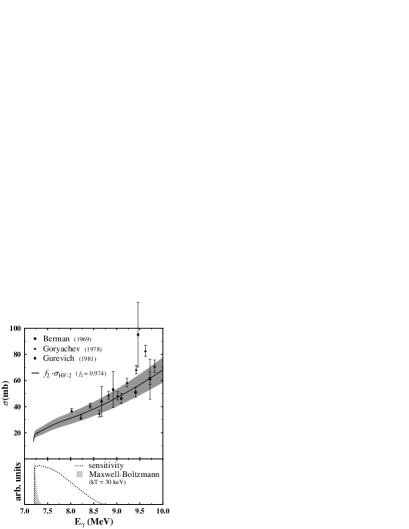
The normalized calculations are compared with experimental data at higher energies in Figs. 3 and 4. Within the uncertainties one finds excellent agreement. Additionally, the dotted line shows the integrand of Eq. (1); this line defines the energy range where our experiment was sensitive. As a consequence of the white bremsstrahlung spectrum and the calculated energy dependence of the (,) cross section, the energy range of our experiment is located directly above the (,) reaction threshold, and it has a width of roughly 1 MeV. It is not possible to present our result as one data point in Figs. 3 and 4. Instead, the experimental result of this work are normalization factors for the theoretical calculations.
3 Calculation of the (,) and (,) Cross Sections
Two sets of calculations, HF-1 and HF-2, of the relevant cross sections have been performed. In both cases the statistical model Hauser-Feshbach theory has been applied to describe the reaction process. Then, in one case, HF-1, a global set of parametrization was used, where the main model parameters were derived either from microscopic approaches or from global systematics. In the other case, HF-2, the model parameters were optimized to the mass region under consideration and, when possible, parameters derived from experimental nuclear structure data were used.
The calculation HF-1 was performed with the code NON-SMOKER (Rauscher & Thielemann, 1998, 2000). The neutron transmission coefficients were computed using a microscopic potential (Jeukenne, Lejeune, & Mahaux, 1977). Nuclear levels as given in Rauscher & Thielemann (2001) have been utilized. Above the last known state a global theoretical level density description was used (Rauscher, Thielemann, & Kratz, 1997). The E1 -transition probabilities were described by a Lorentzian shape with a modified low-energy tail, following the prescription of McCullagh, Stelts, & Chrien (1981). Width and energy position of the GDR were also taken from theory. From a hydrodynamic droplet approach (Myers et al., 1977) we obtain MeV, and from a parameterized approach (Cowan, Thielemann, & Truran, 1991) the width is determined as MeV. The modified energy-dependent width is then given as . For a deformed nucleus, the energy and width split according to the description outlined in Cowan, Thielemann, & Truran (1991). However, within the droplet model (Myers et al., 1977) the nucleus 186W is spherical and a single-humped Lorentzian with the above energy and width is obtained.
The calculation HF-2 was performed using the optical model parameters (OMP) of Moldauer (1965), for neutron transmission coefficients. This set of OMP reproduces fairly well the total cross sections of nuclei with = 184-188. For example, the total cross section of 186W is reproduced with an accuracy of better than 10% for neutron energies from 100 keV up to 10 MeV, by this OMP set. Gamma-ray transmission coefficients were derived from the experimental double-humped GDR parameters (Dietrich & Berman, 1988) derived from experimental data in the GDR region. The relevant data are: MeV and 14.88 MeV, MeV and 5.18 MeV, and mbarn and 334 mbarn, for the two GDR components. Nuclear level densities were derived from the parametrization of Mengoni & Nakajima (1994). Experimental discrete levels have been used to fit the constant-temperature parametrization at low excitation energies, matched to the pairing+shell corrected Fermi-gas model (Gilbert-Cameron prescriptions) at excitation energies close to the neutron binding energy.
In order to compare the results of model predictions with the present 186WW experimental data, the calculation of the cross sections for 185W in the ground state, as well as in several excited states have to be performed. Here, we have included excited states up to about 500 keV. Higher excited states do not appreciably contribute to the cross section. This request is altogether similar to what is needed to evaluate the cross section for thermally excited target states in stellar plasma (stellar cross sections).
From a comparison with the present experimental data close to the neutron threshold, a renormalization factor is obtained for the global HF-1, and for the local HF-2 calculation. Both calculations are able to reproduce the measured data from the neutron threshold up to the GDR region (see Figs. 3 and 4). The typical uncertainty of 25 to 30 % associated with neutron capture cross section calculations (see for example the prediction of the NON-SMOKER code (Rauscher, Thielemann, & Kratz, 1997; Bao et al., 2000)) is therefore obtained with either model parameterizations.
It is interesting to note the similarity in the results of both calculations despite the strongly differing treatments of the GDR, which would be expected to dominate the difference in the results. Although HF-1 uses a single-humped GDR shape, a similar strength distribution as for HF-2 with its double-humped GDR is obtained at the low-energy side of the GDR. This is due to the use of an energy-dependent width, a slightly smaller GDR energy, and a slightly broader basic GDR width. Thus, the energy-dependence of the resulting cross section in the relevant energy range is almost the same for both calculations. The absolute values are roughly proportional to the -ray strength function, hence, they show a comparatively small difference.
The impact of other model inputs, such as the optical neutron potential, are rather small. When comparing the Maxwellian averaged cross sections obtained in the two description, we notice increasing deviations at the lowest energies, i.e. below 10 keV. This means that a different energy dependence of the cross sections is found, being mainly due to the different optical model potentials used. At higher energies the energy dependence of the HF-1 and HF-2 calculations is similar and thus the uncertainties stemming from the optical potentials are not significant to explain further differences in the two approaches.
We will assume that the same renormalization factors derived from the present experimental data and model calculations, are valid also for the Maxwellian averaged cross section of the reverse reaction 185W(,)186W. This assumption requires some more discussion. What is actually measured and calculated here is a compound reaction in which the “compound” nucleus consists of excited states of 186W created by -excitation of the ground state of 186W. This compound nucleus subsequently decays in the neutron channel to all energetically possible final states in 185W, according to the Bohr hypothesis, i.e. independently of how it was formed. For a full application of detailed balance linking the (,) and (,) reaction rates or Maxwellian averaged cross sections, one would have to use a Planck distribution of photons according to the astrophysical temperature of interest ( K) plus account for thermal excitation of the target at the same temperature instead of keeping the target in the ground state. Thus, for each photon energy we are actually measuring a subset of the transitions relevant for the capture rate. Applying detailed balance directly yields a neutron capture cross section which is the thermally averaged sum of neutron captures on the ground state and excited states of 185W, forming 186W at the given energy and finally directly decaying to the ground state of the final nucleus 186W. However, this cross section is governed by the same uncertainties in the optical neutron potential, the level densities, and the GDR properties as the full stellar cross section. Since the energy dependence of the (,) reaction is well described by both models, it can safely be assumed that there is no further energy dependence in the renormalization factor. Therefore, we argue that the same renormalization factor can be applied also to the Maxwellian averaged cross section at 30 keV.
3.1 Results for 185W(,)186W
The normalized results of both calculations for the Maxwellian averaged cross section of 185W(,)186W at =30 keV are in remarkable agreement: from HF-1 one obtains mbarn, and from HF-2 mbarn. The average value is 687 mbarn mbarn (experimental uncertainty) mbarn from different calculations leading to a final result of mbarn. This value is already the stellar capture cross section at = 30 keV where an enhancement factor of 0.92 was used; the cross section at is 747 mbarn which is in agreement with the adopted value of mbarn (Bao et al., 2000) within the uncertainties. Contrary to this adopted value which was based on an empirical renormalization of a theoretical value, the new result is based on experimental data of the inverse reaction. The compatibility of both values nicely confirms the estimate of the systematic error in the theoretical calculation which was used to generate the adopted value in Bao et al. (2000).
4 The Branching at 185W
4.1 The classical -process
The -process synthesis path in the W-Re-Os mass region is shown in Fig. 5. The nuclei 186,187Os are partially bypassed by the -process flow especially by a branching at 185W. The stellar beta decay rates of 185W and 186Re are practically independent of temperature in the relevant temperature region (Takahashi & Yokoi, 1987). Therefore, the isotopic abundance of 186Os is determined by the average -process neutron density. In Fig. 5 laboratory half-lives are indicated. However, according to Takahashi & Yokoi (1987), at stellar temperatures of interest the Re nucleus is almost fully ionized and its -decay rate increases by about ten orders of magnitude ( = 21.3 yr at a temperature = 3 108 K and electron density = 10). In the same stellar envrironment, Os, which is stable in terrestrial conditions, becomes unstable by electron capture ( = 1243 yr). Consequently, the abundance ratio between the two nuclei in the He intershell production zone and in the AGB envelope needs to be followed carefully.
The classical -process model formulated by Ward, Newman, & Clayton (1976) provides a simple way of estimating the -process neutron density via branching analyses. Previous analyses (Käppeler et al., 1991) of the W-Re-Os branching can now be updated with a neutron capture cross section for 185W which is not only based on statistical model calculations.
Except for our 185W capture cross section, the other relevant stellar cross for the -process calculations were taken from the compilation of Bao et al. (2000). The -process flow was normalized at the -only isotope 150Sm which represents an accurate measure of the unbranched curve and calculated down to the W-Re-Os branching using programs described by Beer, Corvi, & Mutti (1997) with an average exposure of =0.296 (/30 keV)1/2mbarn-1. This value corresponds also with a value reported by Arlandini et al. (1999). The relevant part of the calculation, the mass region from to the termination of the -process at is shown in Fig. 6. In this part the overall feature of the curve is a slow decrease up to . This mass region includes not only the studied W-Re-Os branching and the -only 150Sm isotope on the unique synthesis path used for normalization of the curve but also other important -process branchings. These are first the branchings that are sensitive exclusively to the neutron density, i.e., the Nd-Pm-Sm (), Er-Tm-Yb (), W-Re-Os (), and the Os-Ir-Pt () branchings, and second the branchings dependent on neutron density, temperature and electron density, i.e., the Sm-Eu-Gd (), Eu-Gd (), and Dy-Er () branchings. To adjust the -process neutron density, temperature, and electron density, requires an -only isotope to be located inside the branching. These empirical data points are shown in Fig. 6 as full solid circles with smaller values than the value of the unique synthesis path represented by (150Sm). For the W-Re-Os branching (Fig. 5) the branch point isotope is 186Os.
With the new stellar 185W cross section an average neutron density of
| (2) |
was found. The uncertainty of the 185W cross section contributes by (). The main uncertainty in the present determination comes from the 6.3 % uncertainty in the value of 186Os which transforms to an error of () in the neutron density. The 6.3 % uncertainty in (186Os) is primarily the uncertainty of the solar osmium abundance (Anders & Grevesse, 1989).
The present neutron density is still consistent with the Nd-Pm-Sm branching (Reifarth et al., 2002) but is too high for reproducing the Er-Tm-Yb and - in particular - Os-Ir-Pt branchings. While the parameters of the first case are rather uncertain, the Os-Ir-Pt branching has recently been studied with much improved cross sections yielding a neutron density of only (Koehler et al., 2001). In Table 3 our present value for the neutron density is compared with corresponding results from other branchings.
The present neutron density in combination with the adopted values for the -process temperature of =27.1 keV (Beer, Corvi, & Mutti, 1997), and for the electron density of cm-3 (Arlandini et al., 1999) provides also to a fair reproduction of the other branchings shown (Fig. 5). The empirical values of 152Gd and 164Er are underproduced in the calculation. This is reasonable as significant -process contributions of up to 50 % and about 10 % can be expected for 152Gd and 164Er, respectively.
The discrepant neutron densities derived from different branchings as listed in Table 3 indicate an inherent difficulty of the classical model due to the rather schematic assumption of constant neutron density and temperature during the -process. Hence, a consistent description of the various branchings has to be based on more realistic scenarios provided by stellar model calculations.
4.2 The -process in AGB stars
The main component of the -process nucleosynthesis occurs during helium shell burning in low mass AGB stars. The evolution of these stars and the related -process nucleosynthesis has been discussed extensively by Gallino et al. (1998) and Busso et al. (2001), and it has been shown that this model is able to reproduce the main -process component within 10 % (Arlandini et al., 1999) as the result of the average composition of the -process abundance distribution of two AGB stellar models of 1.5 and 3 and a metallicity of . In this model, the -process is driven by two neutron sources. The first, 13CO, operates in the interpulse period between two helium flashes, and the second, 22NeMg, is activated at higher temperatures during the helium shell flash where almost the whole He intershell, i.e. the region between the H shell and the He shell, becomes convective for a relatively short period of time. The 13C neutron source accounts for about 95 % of the total neutron exposure in a thin radiative layer of about ; however, the produced -process abundances that depend on branching points along the -path are significantly modified by the 22Ne source which is operating in the convective helium burning zone. After a limited number of helium shell flashes, at the quenching of the thermal instability, the convective envelope penetrates in the top region of the He intershell, dredging up 12C and -process rich material. The envelope is progressively lost by strong AGB winds and remixed into the interstellar medium.
It is important to emphasize that the profiles for neutron density and temperature are now provided by the stellar model. Therefore, the abundance patterns of -process branchings represent a critical test for this stellar model.
The analysis of the branching at 185W shown in Fig. 5 leads to a significant overproduction of the -only isotope 186Os by 20 % in this stellar -process model. All neutron capture cross sections have been taken from the compilation of Bao et al. (2000) with the exception of the 185W(,)186W cross section where the present result was used. This means that the model apparently overestimates the -decay part and/or underestimates the neutron capture part of the 185W branching. Consequently, it underestimates the -process contribution to 187Re. Note that the uncertainties of the previously existing calculated 185W cross sections (Bao et al., 2000) were generous enough to allow for a roughly consistent description of the observed 186Os abundance.
The observed abundance of 186Os can be reproduced by the stellar model if one increases the 185W(,)186W cross section by 60 %. However, such an enhancement is outside the present experimental uncertainties. If the 185W(,)186W cross section is enhanced within the experimental uncertainties of about 20 %, one still finds an overproduction of 186Os by 12 % which is still slightly inconsistent with the observed abundance.
There are several possible explanations to cure this problem. First, the 186OsOs cross section could be 20 % larger than the adopted value by Bao et al. (2000). However, this value is based on two independent experiments who quote uncertainties between five and ten per cent (Winters & Macklin, 1982; Browne & Berman, 1981). Secondly, the additional branching at 186Re could reduce the 186Os abundance either by an increased 186ReRe cross section or by enhanced electron capture of 186Re under stellar conditions. However, it has been pointed out by Takahashi & Yokoi (1987) that under any realistic assumptions for the capture cross section and the ratio between -decay and electron capture, the 186Re -decay is always faster than the neutron capture.
All these nuclear physics questions will be studied in additional experiments in the near future. Neutron capture experiments on osmium isotopes are planned at the new nTOF facility at CERN and at the Karlsruhe Van de Graaff accelerator, where uncertainties of the order of 1 % can be achieved using the BaF2 detector. Additionally, the 187ReRe cross section shall be measured using the monochromatic photon beam available from Laser-Compton backscattering at AIST, Tsukuba, thus allowing to improve the cross section for the inverse 186ReRe reaction.
With these improvements and by using a realistic -process model there is a good chance for analyzing the 185W and 186Re branchings with sufficient confidence to establish the abundance of 186Os as a sensitive test for the stellar model.
5 Summary and Conclusions
We have measured the photodisintegration cross section of the 186W(,) 185W reaction at energies near the reaction threshold. The experimental data have been used to restrict model predictions for the system and to derive the neutron capture cross section of the inverse 185W(,)186W reaction. The result of mbarn is close to the calculated cross section which was recommended by Bao et al. (2000), but exhibits significantly improved reliability.
The -process flow at the branch point isotope 185W has been analyzed within the classical -process model and within a realistic stellar model for AGB stars. With the classical model one obtains a neutron density of /cm3 compatible with the analyses of the branchings at , but incompatible with the branchings at and 191/192. This inconsistency indicates that the assumptions of the classical model are too schematic to account for the stellar situation, where the process takes place. The corresponding analysis based on a more realistic stellar model overestimates the 186Os abundance by 20 %. Presently, we are facing the question whether this mismatch is related with remaining uncertainties in other nuclear physics data or whether it originates from the -process model itself. If the nuclear physics uncertainties can be further reduced, the -process branching at 185W can be interpreted as a sensitive test of models for the important AGB phase of stellar evolution.
References
- Anders & Grevesse (1989) Anders, E. & Grevesse, N., 1989, Geochim. Cosmochim. Acta, 53, 197
- Arlandini et al. (1999) Arlandini, C., Käppeler, F., Wisshak, K., Gallino, R., Lugaro, M., Busso, M., & Straniero, O., 1999, ApJ, 525, 886
- Bao et al. (2000) Bao, Z. Y., Beer, H., Käppeler F., Voss, F., Wisshak, K., & Rauscher, T., 2000, At. Data Nucl. Data Tables, 76, 70
- Berman et al. (1969) Berman, B. L., Kelly, M. A., Bramblett, R. L., Caldwell, J. T., Davis, H. S., & Fultz, S. C., 1969, Phys. Rev., 185, 1576
- Berman et al. (1987) Berman, B. L., Pywell, R. E., Dietrich, S. S., Thompson, M. N., McNeill, K. G., & Jury, J. W., 1987, Phys. Rev. C, 36, 1286
- Beer, Corvi, & Mutti (1997) Beer, H., Corvi, F., & Mutti, P., 1997, ApJ, 474, 843
- Bosch et al. (1996) Bosch, F., et al., 1996, Phys. Rev. Lett., 77, 5190
- Browne & Berman (1981) Browne, J. & Berman, B., 1981, Phys. Rev. C, 23, 1434
- Brun & Carminati (1993) Brun, R. & Carminati, F., GEANT Detector Description and Simulation Tool, CERN Program Library Long Writeup W5013 edition, 1993, CERN, Geneva
- Busso et al. (2001) Busso, M., Gallino, R., Lambert, D. L., Travaglio, C., & Smith, V. V., 2001, ApJ, 557, 802
- Cowan, Thielemann, & Truran (1991) Cowan, J. J., Thielemann, F.-K., & Truran, J. W., 1991, Phys. Rep., 208, 267
- Dietrich & Berman (1988) Dietrich, S. S. & Berman, B. L., 1988, At. Data Nucl. Data Tables, 38, 199
- ENSDF (2001) ENSDF data base, revision of 15 November, 2001, using NNDC Online Data Service
- Gallino et al. (1998) Gallino, R., Arlandini, C., Busso, M., Lugaro, M., Travaglio, C., Straniero, O., Chieffi, A., & Limongi, M., 1998, ApJ, 497, 388
- Goryachev & Zalesnyĭ (1978) Goryachev, A. M. & Zalesnyĭ, G. N., 1978, IZV. An. KazSSR, 6, 8
- Gurevich et al. (1981) Gurevich, G. M., Lazareva, L. E., Mazur, V. M., Merkulov, S. Yu., Solodukhov, G. V., & Tyutin, V. A., 1981, Nucl. Phys., A351, 257
- Holmes et al. (1976) Holmes, J., Woosley, S., Fowler, W., & Zimmerman, B., 1976, At. Data Nucl. Data Tables, 18, 305
- Jeukenne, Lejeune, & Mahaux (1977) Jeukenne, J., Lejeune, A., & Mahaux, C., 1977, Phys. Rev. C, 16, 80
- Käppeler et al. (1990) Käppeler F., Gallino, R., Busso, M., Picchio, G., & Raiteri, C. M., 1990, ApJ, 354, 630
- Käppeler et al. (1991) Käppeler, F., Jaag, S., Bao, Z. Y., & Reffo, G., 1991, ApJ, 366, 605
- Kempisty & Pochwalski (1992) Kempisty, T. & Pochwalski, K., 1992, Nucl. Inst. Meth. A, 312, 390
- Koehler et al. (2001) Koehler, P. E., Harvey, J. A., Guber, K. H., Winters, R. R., & Raman, S., Proc. Int. Conf. on Nuclear Data for Science and Technology, Tsukuba, Japan, 2001 (in press)
- Lambert (1992) Lambert, D. L., 1992, A&A Rev., 3, 201
- Lindenberg et al. (2001) Lindenberg, K., Neumann, F., Galaviz, D., Hartmann, T., Mohr, P., Vogt, K., Volz, S., & Zilges, A., 2001, Phys. Rev. C, 63, 047307
- McCullagh, Stelts, & Chrien (1981) McCullagh, C. M., Stelts, M. L., & Chrien, R. E., 1981, Phys. Rev. C, 23, 1394
- Mengoni & Nakajima (1994) Mengoni, A. & Nakajima, Y., 1994, J. Nucl. Sci. Tech., 31, 151
- Mohr et al. (1999) Mohr, P., Enders, J., Hartmann, T., Kaiser, H., Schiesser, D., Schmitt, S., Volz, S., Wissel, F., & Zilges, A., 1999, Nucl. Inst. Meth. A423, 480
- Mohr et al. (2000a) Mohr, P., Vogt, K., Babilon, M., Enders, J., Hartmann, T., Hutter, C., Rauscher, T., Volz, S., & Zilges, A., 2000a, Phys. Lett. B, 488, 127
- Mohr et al. (2000b) Mohr, P., Hutter, C., Vogt, K., Enders, J., Hartmann, T., Volz, S., & Zilges, A., 2000b, Europ. Phys. J. A, 7, 45
- Mohr et al. (2001) Mohr, P., Babilon, M., Enders, J., Hartmann, T., Hutter, C., Vogt, K., Volz, S., & Zilges, A., 2001, Nucl. Phys. A688, 82c
- Moldauer (1965) Moldauer, P. A., 1965, Nucl. Phys., 47, 65
- Myers et al. (1977) Myers, W. D., Swiatecki, W. J., Kodama, T., El-Jaick, L. J., & Hilf, E. R., 1977, Phys. Rev. C, 15, 2032
- Rauscher & Thielemann (1998) Rauscher, T. & Thielemann, F.-K., in Stellar Evolution, Stellar Explosions, and Galactic Chemical Evolution, ed. A. Mezzacappa (IOP, Bristol, 1998), p. 483
- Rauscher & Thielemann (2000) Rauscher, T. & Thielemann, F.-K., 2000, At. Data Nucl. Data Tables, 75, 1
- Rauscher & Thielemann (2001) Rauscher, T. & Thielemann, F.-K., 2001, At. Data Nucl. Data Tables, 79, 47
- Rauscher, Thielemann, & Kratz (1997) Rauscher, T., Thielemann, F.-K., & Kratz, K.-L., 1997, Phys. Rev. C, 56, 1613
- Reifarth et al. (2002) Reifarth, R., Arlandini, C., Heil, M., Käppeler, F., Sedyshev,P. V., Mengoni, A., Herman, M., Rauscher, T., Gallino, R., & Travaglio, C. ApJ (submitted)
- Richter (1996) Richter, A., Proc. European Particle Accelerator Conference, Barcelona 1996, ed. S. Myers et al., IOP Publishing, Bristol, 1996, p. 110
- Takahashi & Yokoi (1987) Takahashi, K. & Yokoi, K., 1987, At. Data Nucl. Data Tables, 36, 375
- Utsunomiya (2001) Utsunomiya, H., private communication in 2001 and to be published
- Varlamow et al. (2001) Varlamow, V. V., et al., The Centre for Photonuclear Experiments Data (CDFE) nuclear data bases, http://depni.npi.msu.su/cdfe, Moscow State University, 2001
- Veyssière et al. (1970) Veyssière, A., Beil, H., Bergère, R., Carlos, P., & Leprêtre, A., 1970, Nucl. Phys. A159, 561
- Vogt et al. (2001) Vogt, K., Mohr, P., Babilon, M., Enders, J., Hartmann, T., Hutter, C., Rauscher, T., Volz, S., & Zilges, A., 2001, Phys. Rev. C, 63, 055802
- Vogt et al. (2002) Vogt, K., Mohr, P., Babilon, M., Bayer, W., Hartmann, T., Hutter, C., Rauscher, T., Sonnabend, K., Volz, S., & Zilges, A., 2002, Nucl. Phys. A, 707, 216
- Ward, Newman, & Clayton (1976) Ward, R. A., Newman, M. J., & Clayton, D. D., 1976, ApJS, 31, 33
- Winters & Macklin (1982) Winters, R. & Macklin, R., 1981, Phys. Rev. C, 25, 208


| Target | Mass (mg) | Nucleus | Abundance (%) | (keV) |
|---|---|---|---|---|
| tungsten | 5847.8(10) | 186W | 28.6 | 7194 |
| gold | 163.5(5) | 197Au | 100.0 | 8071 |
| Nucleus | (d) | (keV) | (%) |
|---|---|---|---|
| 185W | 75.1(3) | 125.4 | 0.0192(7) |
| 196Au | 6.1669(6) | 333.0 | 22.9(6) |
| 355.7 | 87.0(8) | ||
| 426.1 | 6.6(8) |
| Branch points | -only isotope | ( cm-3) | Reference |
|---|---|---|---|
| 95Zr | 96Mo | 4 | 1 |
| 147Nd/147Pm/148Pm | 148Sm | 3.0 1.1 | 1 |
| 4.9 | 2 | ||
| 169Er/170Tm | 170Yb | 1.8 | 1 |
| 185W/186Re | 186Os | 4.1 | 3 |
| 185W/186Re | 186Os | 3.8 | 4 |
| 191Os/192Ir | 192Pt | 0.7 | 5 |