Variability-Selected Quasars in MACHO Project Magellanic Cloud Fields
Abstract
We present 47 spectroscopically-confirmed quasars discovered behind the Magellanic Clouds identified via photometric variability in the MACHO database. Thirty-eight quasars lie behind the Large Magellanic Cloud and nine behind the Small Magellanic Cloud, more than tripling the number of quasars previously known in this region. The quasars cover the redshift interval and apparent mean magnitudes . We discuss the details of quasar candidate selection based on time variability in the MACHO database and present results of spectroscopic follow-up observations. Our follow-up detection efficiency was 20%; the primary contaminants were emission-line Be stars in Magellanic Clouds. For the 47 quasars discovered behind the Magellanic Clouds plus an additional 12 objects previously identified in this region, we present 7.5-year MACHO - and -band lightcurves with average sampling times of 2-10 days.
1 Introduction
Techniques to find quasars, largely successful in other regions of the sky, have had limited results towards the Magellanic Clouds (Tinney, 1999; Schmidtke et al., 1999; Dobrzycki et al., 2002). Crowding, recent star formation and significant dust extinction cause major quasar surveys to avoid these regions entirely, resulting in very few quasars known over the substantial sky coverage of the Magellanic Clouds. The most successful selection method to date in this region has been at X-ray wavelengths. Although many tens of sources background to the Magellanic Clouds have been identified in the X-rays (Kahabka et al., 1999; Haberl & Pietsch, 1999; Sasaki, Haberl & Pietsch, 2000), counterparts to these sources at other wavelengths have been stymied by postitional uncertainties; targeted X-ray follow-up has allowed optical identification of extragalactic sources in the Magellanic Cloud region (Crampton et al., 1997; Schmidtke et al., 1999). The MACHO lightcurve database (Alcock et al., 1997, 2000) provides an opportunity to search for quasars behind the Magellanic Clouds via an alternative method: optical variability.
Optical variability has been studied by many groups as a means of constraining models of the quasar central engine (Hook et al., 1994; Cristiani et al., 1997; Sirola et al., 1998; Hawkings, 2002, and references therein), as well as a method of quasar identification behind globular clusters (Meusinger & Brunzendorf, 2002). Although a handful of gravitationally-lensed quasars have well-sampled lightcurves on the timescale of years (Alcalde et al., 2002; Hjorth et al., 2002), most studies have had short time baselines and poor resolution. In one of the largest optical monitoring programs, Giveon et al. (1999) observed a sample of 42 quasars over 7 years with an average sampling interval of 40 days. Long-term optical variability of quasars in this study show no strong evidence for underlying periodic structure. This is in sharp contrast to the majority of stellar sources in the Magellanic Clouds which either do not vary or do so periodically. We have used this difference to separate quasar candidates from the overwhelming stellar background in the Clouds.
A comprehensive search for quasars behind both the Large and Small Magellanic Clouds (LMC and SMC, respectively) is motivated in part by the lack of a suitable reference frame against which to measure the proper motion of the Clouds. Previous proper motion estimates have suffered from an insufficient number or poorly distributed set of reference objects (Jones, Klemola & Lin, 1994; Kroupa & Bastian, 1997; Anguita, Loyola & Pedreros, 2000). Since the proper motion of the Clouds is expected to be only a few mas/year, a well distributed set of point-like background quasars could significantly improve the accuracy of this measurement, constraining the orbital history of these galaxies. These objects may also prove useful as light beacons for absorption line studies of the interstellar medium in the Magellanic Clouds (Gibson et al., 2000; Prochaska, Ryan-Weber & Staveley-Smith, 2002), as has been done for suspected extragalactic X-ray sources in this region (Kahabka et al., 2001; Haberl et al, 2001). Finally, this search was also motivated by interest in the quasars themselves, in hope that the dense time sampling of the MACHO lightcurves will provide clues to the physical mechanisms underlying quasar light variation.
We discuss the MACHO database and our optical variability quasar candidate selection methods in § 2. In § 3, we describe spectroscopic follow-up observations and present 47 quasars discovered behind the Magellanic Clouds. In § 4, MACHO lightcurves are presented for these quasars. Finally, in § 5 we summarize our results and discuss future quasar searches in this region. Finding charts, light curves and spectra for the quasars in this paper are available on request from the authors or on a website given at the end of § 5.
2 Quasar Candidate Selection
2.1 The MACHO Database
The MACHO project monitored the Magellanic Clouds for the purpose of detecting microlensing events between 1992 July and 2000 January (Alcock et al., 1997, 2000). The Mount Stromlo Observatory 1.27-meter telescope system provided simultaneous imaging in a red (–) and blue (–) filter, over a 0.5 field of view with a scale of per pixel. We monitored 82 fields (35 ) in the LMC, and 6 fields (2.5 ) in the SMC; the location of these fields is shown in Figures 1 and 2. Average sampling frequencies varied from 2 to 10 days between fields. Exposure times were 300-s and 600-s for the LMC and SMC, respectively. Photometric transformations from MACHO passbands to standard - and -band magnitudes proceeded using the calibrations discussed in Alcock et al. (1999). Since the MACHO passbands are non-standard and these photometric transformation were determined for stars and not for emission-line quasars, the quasar colors in this paper should be approached with caution. We consider only measurements with photometric errors less than 5%; the average MACHO quasar lightcurve contains 600 good photometric measurements over 7.5 years.
Selection of the quasar candidates, described below, was performed on the first 5.7 years of MACHO data; the final 7.5-year MACHO light curves are presented in the lightcurve analysis of § 4. Due to limited data access at the time of selection in the outer LMC MACHO fields, the variability search discussed in § 2.2 was spatially restricted to the SMC and 30 MACHO LMC fields. In § 2.3, the full spatial coverage of the MACHO database was searched for variable counterparts to known radio and X-ray sources. The final MACHO Magellanic Cloud database, 37.5 over 7.5 years, has recently become readily accessible and variability selection will be run on the outer LMC fields not analysed in this paper.
2.2 Quasar Candidate Variability Selection
At the time of candidate selection, the long-term optical photometric behavior of quasars was not adequately constrained to fully automate quasar selection in the MACHO database. Instead, the selection method was designed to automatically reject known classes of variable stars, with the final step being a selection by eye. The MACHO database contained 9 Active Galactic Nuclei (AGN) listed in Table 1 which had been previously cross-identified with X-ray sources by Schmidtke et al. (1999) and one AGN which was serendipitously discovered by Blanco & Heathcote (1986). Two additional sources in the MACHO database were presented by Dobrzycki et al. (2002) subsequent to candidate selection. Lightcurves for these sources, shown in Figure 3, provided a training set around which the selection method was developed. The final subjective step was to select, by eye, lightcurves similar to these known sources. Since our goal was to identify a robust set of quasars, rather than a complete census of quasars behind the Clouds, we deemed this level of subjectivity to be acceptable.
Variability selection was run on 30 MACHO LMC fields (15) containing 12 million objects and 6 MACHO SMC fields (2.5) containing 2 million objects. Candidate selection began with the Level 1 MACHO database, a data subset containing 140,000 objects flagged as having a significant deviation from a constant brightness lightcurve (Alcock et al., 2000). We required objects to have a minimum of 50 photometric measurements in - and -bands. Weighted average magnitudes were calculated from the standard equation:
| (1) |
where is the total number of individual photometric measurements with associated errors . We considered candidates between which is one magnitude brighter (fainter) than the MACHO photometric completeness (saturation) limits. Candidates were required to have weighted average colors bluer than . This color cut eliminated long-period quasi-periodic variable stars, while retaining all of the training set AGNs. An example lightcurve of a long period variable is shown in the top right panel of Figure 4; the majority of these stars are extremely red and otherwise difficult to remove from the final quasar candidate list.
Two statistics were used to quantify the amount of lightcurve variability. First, the intrinsic variability for each candidate quasar lightcurve was calculated as:
| (2) |
This quantity is an estimate of the true source variability in the absence of photometric errors. The first term is the total variance measured from the lightcurve data, while the second is an estimate of the variance due to photometric measurement errors alone. We note that the photometric error estimate supplied by the photometry code Sodophot (Alcock et al., 1997) is known to have some bias for bright stars. This bias is on the order of 0.01 magnitudes and should have only a small effect on the current data. Giveon et al. (1999) monitored a sample of 42 quasars monthly for 7 years, measuring intrinsic variabilities between in the -band. We therefore require the intrinsic variability of MACHO candidate quasars to be larger than 0.05 magnitudes (). The second variability statistic calculated for each lightcurve is the variability index (Welch & Stetson, 1993). This index is a measure of correlated variability between the MACHO - and -bands, defined as:
| (3) |
This quantity approaches zero for uncorrelated variability. Quasar variability is expected to be highly correlated between the MACHO passbands; we require for our candidates. This limit was set slightly below the minimum -value determined from the training set AGN. Due to MACHO noise characteristics the two variability statistics described above are not redundant. Systematic noise terms in the MACHO system which affect a single filter can cause large values, but may be eliminated as this variability is not correlated in the second filter. Conversely, variable observing conditions, such as seeing and sky brightness, can cause correlated variability, but these measurements often have large photometric errors and can be rejected based on our cut.
Periodic variable stars, such as Cepheid and RR Lyrae stars, were removed using the MACHO Variable Star Catalogue. This catalogue contains period information for the majority of variable MACHO objects as determined from a super-smoother algorithm which models folded lightcurves (Cook et al., 1995). We reject as candidate lightcurves for which a period () was found at high significance in both passbands over the range days. This cut did not include aliased frequencies ( days, =1,2,..). An example lightcurve of a typical RR Lyrae star in the MACHO database rejected by our periodicity cut is shown in the top right panel of Figure 4.
In the final quasar candidate selection step, each candidate lightcurve was examined by eye to remove objects with spurious noise characteristics or quasi-periodic components. Roughly 2500 light curves were examined by eye; a total of 360 lightcurves were considered candidate quasars. A fraction of lightcurves rejected by eye were due to noise effects above the thresholds set by our variability cuts. However, the majority of rejected candidates were quasi-periodic lightcurves characteristic of blue variable stars, known to the microlensing community as a ’Bumper’ stars (Cook et al., 1995). An example of such a lightcurve is shown in the bottom left panel of Figure 4. These stars typically have strong Balmer emission lines at the velocity of the Clouds and are associated with the Be star phenomena (Keller et al., 2002). These blue variables often have quasi-repeatable outbursts and can be eliminated from the candidate list. As designed, our quasar selection technique successfully recovered all of the previously known quasar/AGNs in the search region.
2.3 Additional Candidate Selection Methods
We have additionally searched for optically-variable counterparts in the error boxes of suspected extragalactic radio and X-ray sources in several Magellanic Cloud surveys. This allowed us to extend our search to the full spatial coverage of the MACHO database (37.5), as explained in § 2.1. In the LMC, we have searched the LMC radio catalogues of Marx, Dickey & Mebold (1997) and Filipovic et al. (1998) and the X-ray catalogue of Haberl & Pietsch (1999); in the SMC we have searched the radio catalogue of Filipovic et al. (1997) and the X-ray catalogues of Kahabka et al. (1999) and Sasaki, Haberl & Pietsch (2000). Photometric constraints, described in the previous section, are relaxed in this search: any aperiodic MACHO variable () inside the spatial error box of a cataloged source (typically ) is considered a candidate. We identified variable, aperiodic MACHO counterparts in the error boxes for of the cataloged objects. In the last column of Tables 2 and 3, we note which quasars were identified by this method.
3 Spectroscopic Confirmation of 47 MACHO Quasars
Follow-up spectroscopic observations for our quasar candidates were obtained with the Anglo-Australian Telescope and 2dF multifiber spectrograph (AAT+2dF) in 1999 October and 2001 January. Additional observations were made with the Australian National University 2.3m and Double Beam Spectrograph (ANU+DBS) over 8 nights between 1999 March and 2000 November. The AAT+2dF is a fiber-fed spectrograph with diameter fibers and 200 fibers available per pointing. These observations were made through the 300B grating covering – with pixels. The 2dF data were reduced using the standard 2dFdr reduction pipeline software (Bailey, Glazebrook & Bridges, 2002). Observations with the ANU+DBS were made through a single, wide slit in combination with a low resolution per pixel blue grating (–) and a red per pixel grating (–). These data were reduced with IRAF single long-slit spectra reduction procedures. A total of 259 candidate quasars were observed: spectra for 220 candidates were obtained in six separate AAT+2dF pointings, 39 candidates were observed in single pointing with the 2.3m+DBS. The remaining candidates will be observed in future observing runs.
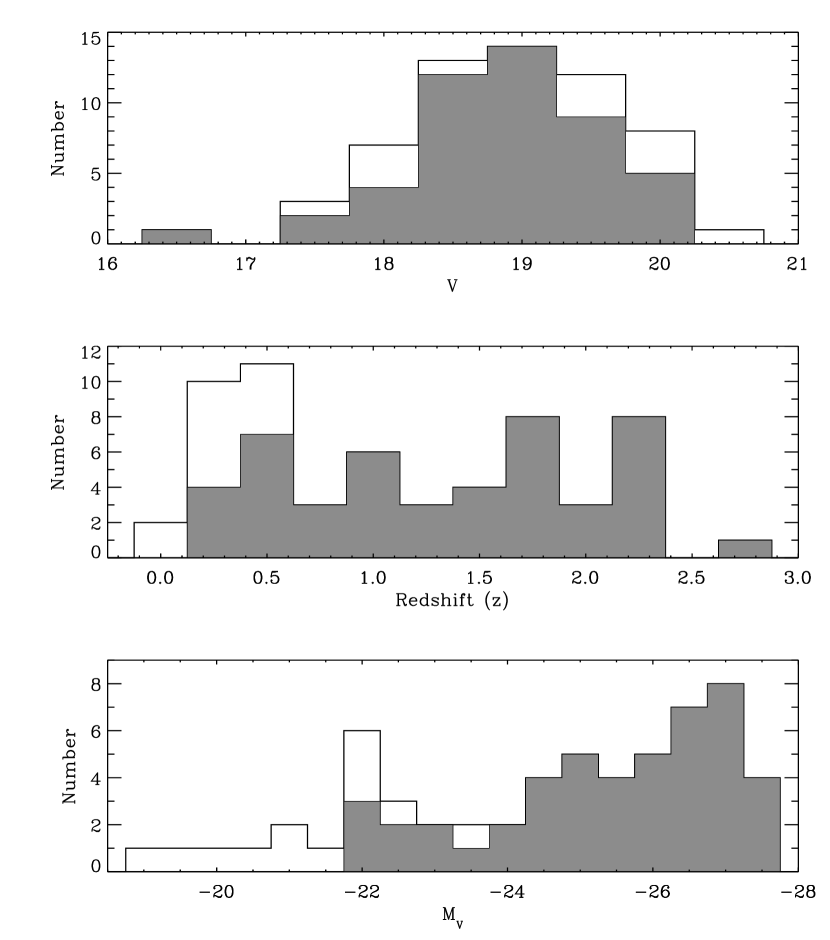
Spectroscopic follow-up revealed a total of 47 previously unknown quasars behind the Magellanic Clouds: 38 behind the LMC and 9 quasars behind the SMC. The quasars cover the redshift interval and range in apparent magnitude between mag. For the majority of objects, redshifts were determined from two or more broad lines; rest-frame spectra for all 47 newly discovered quasars are shown in Figure 5. All objects appear unresolved in MACHO images. Absolute magnitudes were computed assuming a consensus cosmology of , and Ho = 75 km s-1Mpc-1 and are corrected for reddening. Values for reddening vary in the Magellanic Clouds due to patchy dust distribution, and accurate estimates do not yet exist in the directions of all of our quasars. We instead adopted, for each Cloud, a single reddening value of and (Dutra et al., 2001) for the LMC and SMC, respectively, and a Galactic extinction law.
The spatial distribution of the discovered MACHO quasars is shown relative to the Magellanic Clouds in Figures 1 and 2. In the LMC, quasars appear concentrated to the South of the LMC bar due to several 2dF spectroscopic pointings in this region. Given that quasar candidates have not yet been spectroscopically followed up in this region, and subjectivity in the candidate selection process, our quasar sample is unlikely to be complete. In Tables 2 and 3 we list for each source a MACHO ID number, equatorial coordinates (J2000) and (J2000), weighted average apparent magnitude and color, the redshift, z, the mean absolute magnitude, , and the number of -band photometric measurements, , available in the MACHO database. We also note if the object was selected as a candidate based on optical variability inside the error box of a suspected extragalactic radio and X-ray source. Histograms of the quasars, distributed as a function of redshift, apparent and absolute magnitude, are shown in Figure 8.
3.1 Candidate List Contamination: Be/Ae Stars
The primary contamination during spectroscopic follow-up of our quasar candidates were emission-line main sequence stars (Be/Ae stars) in the Magellanic Clouds. These stars display strong Balmer emission/absorption lines at the velocity of the Clouds and are known to be photometrically variable (Hubert & Floquet, 1998). Of the 258 quasar candidates observed, 188 were emission-line Be/Ae stars. The brightest (), more well studied, emission-line stars have a strong periodic component to their lightcurves (‘Bumpers’; Cook et al., 1995) and were already removed from the quasar candidate list. However, fainter Be/Ae stars appear to be quasi- to aperiodic variables and were thus included as quasar candidates. An example Bumper light curve is compared to a fainter Be/Ae star in the bottom panels of Figure 4. These objects have very similar spectra, despite significantly different lightcurve behavior. A preliminary analysis of this type of blue variable star is presented in Keller et al. (2002).
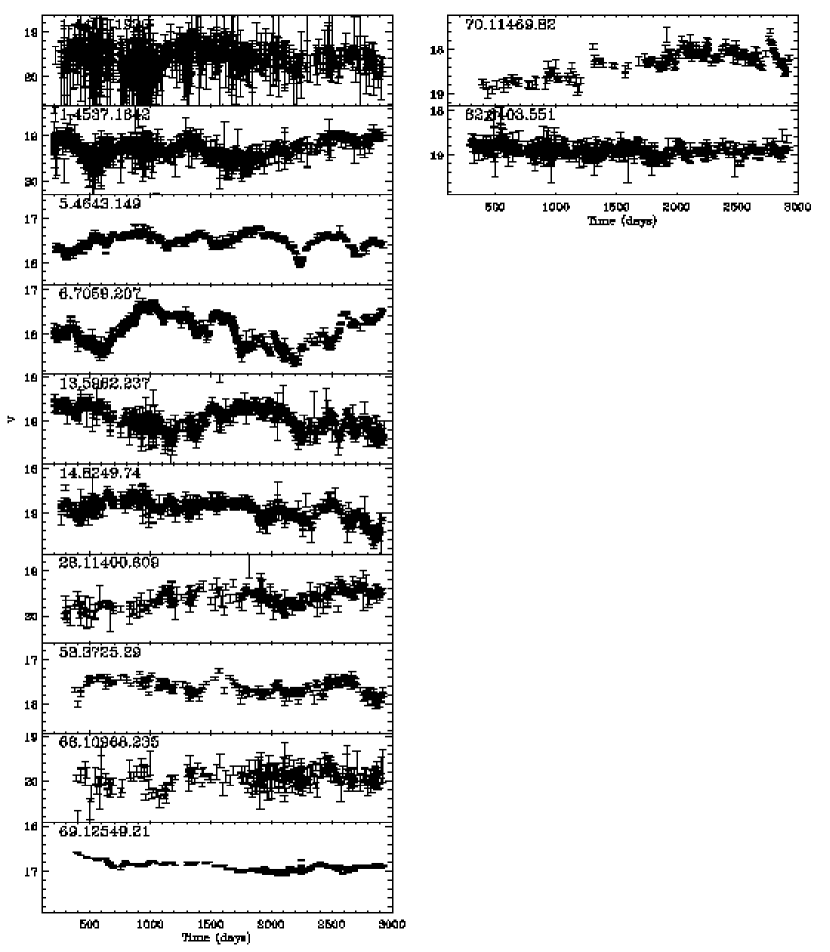
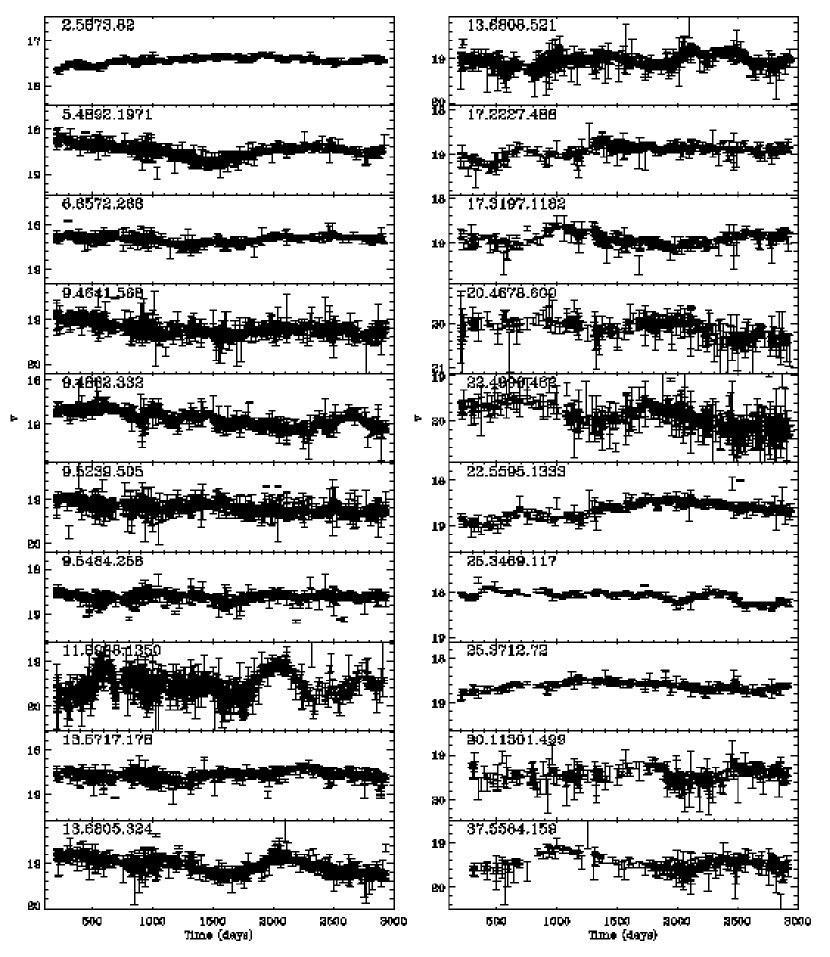
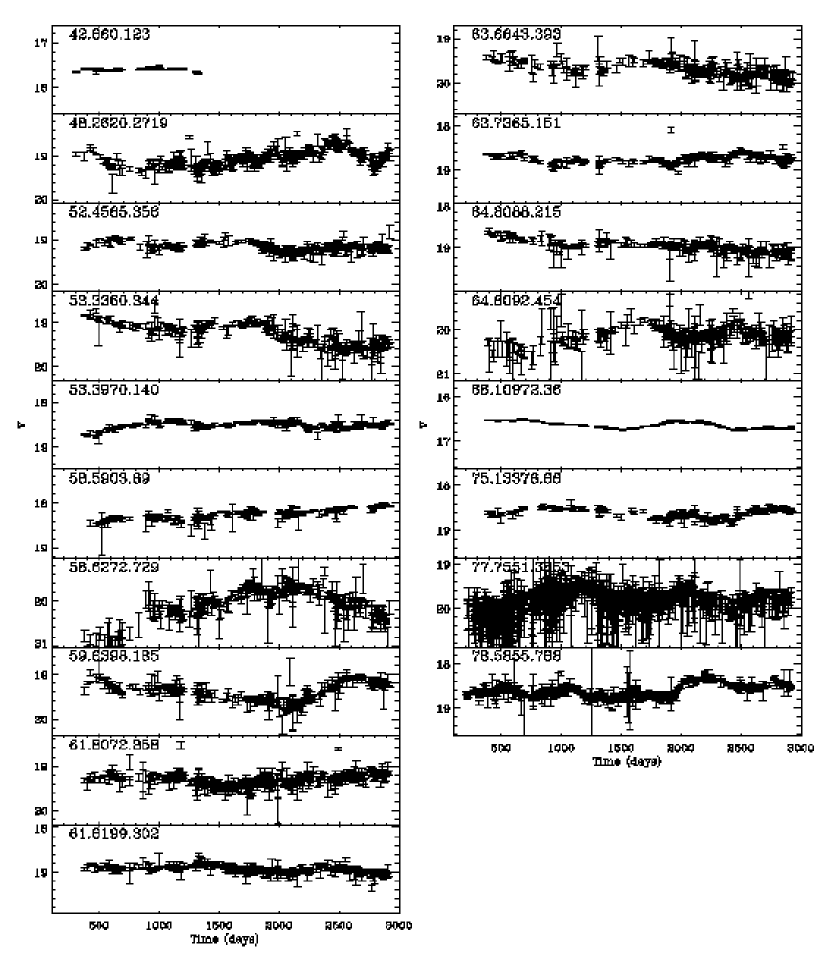
4 MACHO Quasar Lightcurves
-band lightcurves for all quasars listed in Tables 1, 2 and 3 are presented in Figures 3, 6, and 7. The lightcurves have on average 600 photometric measurements in both - and -band, spanning 7.5 years. The zero point of the time axis of these plots corresponds to JD 2448623.5, or UT 1992 January 2.0. We have searched for close quasar pair candidates in a radius around each source, but find no aperiodic lightcurves at these distances. We note that, unlike the previously discovered sources listed in Table 1 which are predominately AGN, the majority of MACHO sources would be classified as quasars based on the usual absolute luminosity criteria of (strict classification is prohibited by the fact that we determine rather than magnitudes).
Similar to the results of Giveon et al. (1999), we find that the majority of quasars become bluer in as they brighten. To quantify this, we calculate the Spearman’s rank correlation probability () between magnitude and color measurements for each source. The correlation is in the same sense for all quasars (bluer colors at brighter magnitudes), and is highly significant at a level or greater () for 95% of the quasar lightcurves. In contrast, the majority (63%) of contaminating Be/Ae stars in our spectroscopic sample became redder as they brightened at similar significance levels. This distinction will be used to improve future quasar selection criteria.
In Figure 9, the -band intrinsic variability, as defined in Eqn. 2, is plotted as a function of quasar absolute luminosity and redshift. For the more homogeneous subset of quasars discovered via our variability-only method (Fig. 9, solid points), we find according to the Spearman’s rank test, a very weak correlation at the level between variability and absolute luminosity ( - ) in the sense that intrinsically luminous quasars tend to be less variable. For the full set of objects shown in Figure 9, the same correlation between - was more significant at the level. No correlation was found between the intrinsic source variability and redshift ( - ) for our quasar subset. For the full set, a weak negative correlation between variability and redshift is detected at the level. Several groups have claimed a similar correlation between variability and absolute luminosity (Hook et al., 1994; Cristiani et al., 1997; Giveon et al., 1999), however, both positive and negative correlations have been claimed between variability and redshift. These results are difficult to interpret due to strong correlations between redshift and absolute luminosity, as well as varying definitions of variability. The quasar light curves presented in this paper have sufficient time resolution to allow power spectrum and other detailed lightcurve analyses. It is hoped that such work will be easier to interpret and have interesting implications for the physical mechanisms driving the AGN/quasar variability.
5 Discussion and Summary
We present 47 quasars discovered behind the Magellanic Clouds: 38 behind the LMC and 9 behind the SMC, significantly increasing the number density of known quasars in this region. The quasars cover the redshift interval and apparent mean magnitudes . Candidate quasars were identified based on aperiodic variability in the MACHO database. MACHO light curves are presented for the newly discovered quasars as well as 12 quasar/AGNs identified in previous studies. The primary contamination during spectroscopic follow-up were quasi- or aperiodic Be/Ae stars in the Magellanic Clouds. Spectroscopic follow-up of quasar candidates in the MACHO database is not yet complete. In the outer LMC, 52 MACHO fields have become accessible for variability-only (§ 2.2) selection since the original candidate selection was run. In addition, candidates have not yet been followed-up from the search presented in this paper. We therefore expect the MACHO database to yield many more sources in the future.
A similar photometric variability selection has been applied to another microlensing database in the Magellanic Clouds, OGLE-II (Eyer, 2002), but has not yet been followed-up spectroscopically. We have checked our sample of quasars against the OGLE candidate list presented by Eyer. Four of the MACHO quasars are listed as candidates in this paper, (OGLE candidates: L92, L114, L155, S12), eight OGLE candidates are within of spectroscopically confirmed Be stars (L51, L87, L103, L121, L148, L153, S8, S25) and six OGLE candidates are common to our list which have not yet been followed-up spectroscopically. Despite similar quasar candidate selection strategies, the majority of the OGLE candidates did not make our candidate list. This is due in part to our final subjective rejection of Be/Bumper lightcurves: 24 objects classified as quasar candidates by Eyer were considered Be/Bumper star candidates according to MACHO photometry; the remaining objects in the OGLE list either did not pass our minimum variability cut or fell outside MACHO fields. Continued follow-up of both MACHO and OGLE candidates is certain to increase significantly the number quasars in the Magellanic Cloud region.
Quasars behind the Magellanic Clouds are extremely useful tools with which to study the Clouds themselves. Our motivation for this study was to uncover a robust set of reference objects against which to measure the proper motion of the Magellanic Clouds. First epoch Hubble Space Telescope images have been scheduled for a subset of quasars presented in this paper; second epoch imaging is expected to allow an estimation of the Cloud’s orbital motion with sufficient accuracy to constraint models of the Galactic halo. Quasars are also invaluable tools for a variety of other studies, for example as probes of the Clouds’ interstellar medium. We therefore provide finding charts, lightcurves and spectra for all quasars presented in this paper, available electronically at http://www.ucolick.org/mgeha/MACHO or on request from the authors.
References
- Alcalde et al. (2002) Alcalde, D. et al. 2002, ApJ, 572, 729
- Alcock et al. (2000) Alcock, C. et al. 2000, ApJ, 542, 281
- Alcock et al. (1999) Alcock, C. et al. 1999, PASP, 111, 1539
- Alcock et al. (1997) Alcock, C. et al. 1997, ApJ, 486, 697
- Anguita, Loyola & Pedreros (2000) Anguita, C., Loyola, P., Pedreros, M. H. 2000, AJ, 120, 845
- Bailey, Glazebrook & Bridges (2002) Bailey, J., Glazebrook, K., & Bridges, T. 2002, 2dF User Manual, Anglo-Australian Observatory
- Blanco & Heathcote (1986) Blanco, V. M., & Heathcote, S. 1986, PASP, 98, 635
- Cook et al. (1995) Cook, K. H. et al. 1995, in Astrophysical Applications of Stellar Pulsation, ASP Conf. Series 83, ed. R. S. Stobies & P. A. Whitelock (San Fransisco:ASP), 221
- Crampton et al. (1997) Crampton, D., Gussie, G., Cowley, A.P., & Schmidtke, P. C., AJ, 114, 2353
- Cristiani et al. (1997) Cristiani, S., Trentini, S., La Franca, F., & Andreani, P. 1997, A&A, 321, 123
- Dobrzycki et al. (2002) Dobrzycki, A., Groot, P. J., Macri, L. M., & Stanek, K. Z. 2002, ApJ, in press (astro-ph/0202524)
- Dutra et al. (2001) Dutra, C. M., Bica, E., Claria, J. J., Piatti, A. E., & Ahumada, A. V. 2001, A&A, 371, 895
- Eyer (2002) Eyer, L. 2002, AcA, submitted (astro-ph/0206074)
- Filipovic et al. (1998) Filipovic, M. D., Haynes, R. F., White, G. L., & Jones, P. A. 1998, A&AS, 130, 421
- Filipovic et al. (1997) Filipovic, M. D., Jones, P. A., White, G. L., Haynes, R. F., Klein, U., & Wielebinski, R. 1997, A&AS, 121, 321
- Gibson et al. (2000) Gibson, B. K., Giroux, M. L., Penton, S. V., Putman, M. E., Stocke, J. T., Shull, J. M. 2000, AJ, 121,922
- Giveon et al. (1999) Giveon, U., Maoz, D., Kaspi, S., Netzer, H., & Smith, P. S. 1999, MNRAS, 306, 637
- Haberl et al (2001) Haberl, F., Dennerl, K., Filipovic, M. D., Aschenbach, B., Pietsh, W., & Trümper, J. 2001, A&A, 365, L208
- Haberl & Pietsch (1999) Haberl, F., Pietsch, W. 1999, A&AS, 139, 277
- Hawkings (2002) Hawkings, M. R. S. 2002, MNRAS, 329, 76
- Hewett et al. (1995) Hewett, P. C., Foltz, C. B., & Chaffee, F. H. 1995, AJ, 109, 1499
- Hjorth et al. (2002) Hjorth, J. et al. 2002, ApJ, 572, L11
- Hook et al. (1994) Hook, I. M., McMahon, R. G, Boyle, B. J., & Irwin, M. J. 1994, MNRAS, 268, 305
- Hubert & Floquet (1998) Hubert, A. M., & Floquet, M. 1998, A&A, 335, 565
- Jones, Klemola & Lin (1994) Jones, B. F., Klemola, A. R., Lin, D. N. C. 1994, AJ, 107, 1333
- Kahabka et al. (2001) Kahabka, P., de Boer, K. S., & Brüns, C. 2001, A&A, 371, 816
- Kahabka et al. (1999) Kahabka, P., Pietsch, W., Filipovic, M. D., & Haberl, F. 1999, A&AS, 136, 81
- Keller et al. (2002) Keller, S., Bessell, M. S., Cook, K. H., Geha, M., & Syphers, D. 2002, AJ, accepted (astro-ph/0206444)
- Kroupa & Bastian (1997) Kroupa, P., Bastian, U. 1997, New Astronomy, 2, 77
- Marx, Dickey & Mebold (1997) Marx, M., Dickey, J. M., & Mebold, U. 1997, A&AS, 126, 325
- Meusinger & Brunzendorf (2002) Meusinger, H., & Brunzendorf, J. 2002, A&A, 374, 878
- Prochaska, Ryan-Weber & Staveley-Smith (2002) Prochaska, J. X., Ryan-Weber, E., Staveley-Smith, L. 2002, PASP, accepted (astro-ph/0207479)
- Sasaki, Haberl & Pietsch (2000) Sasaki, M., Haberl, F., & Pietsch, W. 2000, A&AS, 143, 391
- Schmidtke et al. (1999) Schmidtke, P. C., Cowley, A., Crane, J., Taylor, V., McGrath, T., Hutchings, J., & Crampton, D. 1999, AJ, 117, 927
- Sirola et al. (1998) Sirola, C. J. 1998, ApJ, 495, 659
- Tinney (1999) Tinney, C. G. 1999, MNRAS, 303, 565
- Welch & Stetson (1993) Welch, D. L., Stetson, P. B. 1993, AJ, 105, 1813


| Source Name | MACHO ID | (J2000) | (J2000) | Ref | |||||
|---|---|---|---|---|---|---|---|---|---|
| 050736.52-684751.7 | 1.4418.1930 | 05:07:36.39 | 68:47:52.94 | 20.05 | 0.14 | 0.53 | 22.59 | 1071 | 1 |
| 050833.29-685427.5 | 1.4537.1642 | 05:08:31.89 | 68:55:10.66 | 19.75 | 0.16 | 0.61 | 23.27 | 1137 | 1 |
| RX J0509.2-6954 | 5.4643.149 | 05:09:15.49 | 69:54:16.75 | 17.95 | 0.28 | 0.17 | 21.91 | 939 | 2 |
| RX J0524.0-7011 | 6.7059.207 | 05:24:02.31 | 70:11:08.95 | 18.26 | 0.42 | 0.15 | 21.24 | 980 | 2 |
| RX J0517.4-7044 | 13.5962.237 | 05:17:17.03 | 70:44:02.46 | 19.33 | 0.40 | 0.17 | 20.44 | 894 | 2 |
| RX J0531.5-7130 | 14.8249.74 | 05:31:31.60 | 71:29:47.78 | 19.36 | 0.23 | 0.22 | 21.05 | 869 | 2 |
| RX J0550.5-7110 | 28.11400.609 | 05:50:31.22 | 71:09:58.47 | 20.08 | 0.26 | 0.44 | 22.07 | 322 | 2 |
| RX J0503.1-6634 | 53.3725.29 | 05:03:04.04 | 66:33:46.62 | 18.10 | 0.41 | 0.06 | 19.41 | 268 | 2 |
| RX J0547.8-6745 | 68.10968.235 | 05:47:45.13 | 67:45:5.745 | 20.45 | 0.51 | 0.39 | 21.39 | 263 | 2 |
| HB890557-672 | 69.12549.21 | 05:57:22.41 | 67:13:22.16 | 17.41 | 0.38 | 0.14 | 21.95 | 254 | 3 |
| RX J0550.6-6637 | 70.11469.82 | 05:50:33.31 | 66:36:52.96 | 18.19 | 0.65 | 0.08 | 19.23 | 248 | 2 |
| RX J0532-6920 | 82.8403.551 | 05:31:59.66 | 69:19:51.12 | 19.40 | 0.31 | 0.15 | 20.07 | 851 | 2 |
Note. — Weighted average magnitudes and colors determined from MACHO photometry; is the number of MACHO photometric data points over the 7.5-year monitoring period. Redshifts, , are taken from discovery papers as follows: 1 = Dobrzycki et al. (2002), 2 = Schmidtke et al. (1999), 3 = Blanco & Heathcote (1986).
| MACHO ID | (J2000) | (J2000) | Notes | |||||
|---|---|---|---|---|---|---|---|---|
| 2.5873.82 | 05:16:28.78 | 68:37:02.38 | 17.44 | 0.44 | 0.46 | 24.81 | 967 | |
| 5.4892.1971 | 05:10:32.32 | 69:27:16.90 | 18.45 | 0.33 | 1.58 | 26.73 | 960 | |
| 6.6572.268 | 05:20:56.93 | 70:24:52.50 | 18.33 | 0.24 | 1.81 | 27.22 | 989 | |
| 9.4641.568 | 05:08:45.95 | 70:05:00.92 | 19.20 | 0.30 | 1.18 | 25.20 | 993 | |
| 9.4882.332 | 05:10:23.18 | 70:07:36.12 | 18.83 | 0.32 | 0.32 | 22.53 | 1004 | |
| 9.5239.505 | 05:12:59.56 | 70:30:24.76 | 19.18 | 0.36 | 1.30 | 25.48 | 992 | |
| 9.5484.258 | 05:14:12.05 | 70:20:25.64 | 18.61 | 0.33 | 2.32 | 27.37 | 997 | |
| 11.8988.1350 | 05:36:00.50 | 70:41:28.86 | 19.52 | 0.30 | 0.33 | 21.90 | 1008 | a |
| 13.5717.178 | 05:15:36.02 | 70:54:01.65 | 18.56 | 0.37 | 1.66 | 26.74 | 921 | |
| 13.6805.324 | 05:22:47.23 | 71:01:31.08 | 18.66 | 0.35 | 1.72 | 26.39 | 959 | |
| 13.6808.521 | 05:22:47.69 | 70:47:34.82 | 19.02 | 0.32 | 1.64 | 26.26 | 942 | |
| 17.2227.488 | 04:53:56.55 | 69:40:35.96 | 18.88 | 0.32 | 0.28 | 22.13 | 449 | |
| 17.3197.1182 | 05:00:17.56 | 69:32:16.32 | 18.88 | 0.32 | 0.90 | 25.15 | 435 | |
| 20.4678.600 | 05:08:54.08 | 67:37:35.57 | 20.06 | 0.24 | 2.22 | 25.80 | 372 | |
| 22.4990.462 | 05:11:40.77 | 71:00:32.95 | 19.82 | 0.38 | 1.56 | 25.32 | 580 | |
| 22.5595.1333 | 05:15:22.94 | 70:58:06.77 | 18.55 | 0.29 | 1.15 | 25.77 | 572 | |
| 25.3469.117 | 05:01:46.68 | 67:32:41.81 | 18.07 | 0.26 | 0.38 | 23.72 | 376 | |
| 25.3712.72 | 05:02:53.65 | 67:25:46.44 | 18.61 | 0.31 | 2.17 | 27.20 | 372 | b |
| 30.11301.499 | 05:49:41.63 | 69:44:15.86 | 19.41 | 0.35 | 0.46 | 22.86 | 309 | |
| 37.5584.159 | 05:15:04.72 | 71:43:38.62 | 19.43 | 0.66 | 0.50 | 23.06 | 275 | c |
| 42.860.123 | 04:46:11.14 | 72:05:09.80 | 17.60 | 0.29 | 0.95 | 26.58 | 50 | d |
| 48.2620.2719 | 04:56:14.19 | 67:39:10.81 | 19.03 | 0.32 | 0.26 | 21.82 | 368 | |
| 52.4565.356 | 05:08:30.64 | 67:02:30.05 | 19.16 | 0.21 | 2.29 | 26.78 | 257 | |
| 53.3360.344 | 05:00:54.00 | 66:44:01.34 | 19.22 | 0.22 | 1.86 | 26.39 | 268 | |
| 53.3970.140 | 05:04:36.01 | 66:24:17.03 | 18.50 | 0.27 | 2.04 | 27.14 | 272 | |
| 58.5903.69 | 05:16:36.76 | 66:34:36.92 | 18.20 | 0.26 | 2.24 | 27.68 | 251 | |
| 58.6272.729 | 05:18:51.97 | 66:09:56.70 | 19.85 | 0.35 | 1.53 | 25.24 | 342 | |
| 59.6398.185 | 05:19:28.02 | 65:49:50.50 | 19.33 | 0.36 | 1.64 | 25.95 | 284 | |
| 61.8072.358 | 05:30:07.93 | 67:10:27.20 | 19.33 | 0.27 | 1.65 | 25.96 | 388 | |
| 61.8199.302 | 05:30:26.81 | 66:48:55.31 | 18.94 | 0.25 | 1.79 | 26.57 | 392 | |
| 63.6643.393 | 05:20:56.45 | 65:39:04.79 | 19.65 | 0.41 | 0.47 | 22.67 | 250 | |
| 63.7365.151 | 05:25:14.29 | 65:54:45.93 | 18.72 | 0.33 | 0.65 | 24.43 | 252 | |
| 64.8088.215 | 05:30:09.06 | 66:07:01.05 | 18.96 | 0.23 | 1.95 | 26.77 | 257 | |
| 64.8092.454 | 05:30:08.75 | 65:51:24.27 | 20.10 | 0.20 | 2.03 | 25.52 | 258 | |
| 68.10972.36 | 05:47:50.18 | 67:28:02.44 | 16.63 | 0.28 | 1.01 | 27.33 | 267 | |
| 75.13376.66 | 06:02:34.25 | 68:30:41.51 | 18.63 | 0.26 | 1.07 | 25.50 | 241 | e |
| 77.7551.3853 | 05:27:16.19 | 69:39:33.96 | 19.75 | 0.21 | 0.85 | 24.14 | 1471 | f |
| 78.5855.788 | 05:16:26.23 | 69:48:19.39 | 18.61 | 0.22 | 0.63 | 24.48 | 878 | g |
Note. — Weighted average magnitudes and colors determined from MACHO photometry; is the number of MACHO photometric data points. Redshifts, , determined from spectra discussed in § 3. The majority of quasars were selected as candidates based on photometric variability alone. Variable counterparts to X-ray and radio sources are indicated in the table notes as follows: (a) RX J0536.0-7041, (b) 1WGA J0508.9-6737 (c) HP99 1306, (d) PMN J0446-7205, (e) PMN J0603-6830, (f) 1WGA J0527.2-6939, (g) HP99 1019.
| MACHO ID | (J2000) | (J2000) | Notes | |||||
|---|---|---|---|---|---|---|---|---|
| 206.16653.987 | 01:01:27.81 | 72:46:14.37 | 19.51 | 0.25 | 1.05 | 24.57 | 794 | |
| 206.17052.388 | 01:07:21.71 | 72:48:45.76 | 18.85 | 0.23 | 2.15 | 26.93 | 810 | |
| 207.16310.1050 | 00:55:59.61 | 72:52:45.15 | 19.17 | 0.31 | 1.47 | 25.80 | 850 | |
| 207.16316.446 | 00:55:34.70 | 72:28:34.23 | 18.64 | 0.19 | 0.56 | 24.17 | 822 | a |
| 208.15799.1085 | 00:47:15.76 | 72:41:12.24 | 19.52 | 0.26 | 2.77 | 26.92 | 861 | |
| 208.15920.619 | 00:49:34.43 | 72:13:08.99 | 19.28 | 0.18 | 0.91 | 24.77 | 858 | |
| 208.16034.100 | 00:51:16.89 | 72:16:51.06 | 18.03 | 0.25 | 0.49 | 24.42 | 878 | |
| 211.16703.311 | 01:02:14.36 | 73:16:26.80 | 18.92 | 0.34 | 2.18 | 26.89 | 791 | |
| 211.16765.212 | 01:02:34.73 | 72:54:22.20 | 18.15 | 0.29 | 2.13 | 27.60 | 795 |
Note. — See notes for Table 2. Candidate identified as variable counterpart to X-ray source: (a) RX J0055.6-7228