Reddening-Independent Quasar Selection from a Wide-Field Optical and Near-IR Imaging Survey
Abstract
We combine deep, wide-field near-IR and optical imaging to demonstrate a reddening-independent quasar selection technique based on identifying outliers in the (g z) / (z H) colour diagram. In three fields covering a total of deg2 to a depth of mH18, we identified 68 quasar candidates. Follow-up spectroscopy for 32 objects from this candidate list confirmed 22 quasars (0.86z2.66), five with significant IR excesses. 2 of 8 quasars from a subsample with U band observations do not exhibit UVX colours. From these preliminary results, we suggest that this combined optical and near-IR selection technique has a high selection efficiency (% success rate), a high surface density of candidates, and is relatively independent of reddening. We discuss the implications for star/galaxy separation for IR base surveys for quasars. We provide the coordinate list and follow-up spectroscopy for the sample of 22 confirmed quasars.
keywords:
quasars: general - galaxies: active.1 Introduction
Quasar spectral energy distributions are diverse and comparing surveys at different wavelengths, including the infrared, is important for characterizing the quasar population. In addition, compared to optical surveys, infrared selection is less effected by dust extinction and reddening (due to both dust within host galaxies or along the line of sight). This has implications not only for characterizing the influence of dust obscuration on the observed population, but also for understanding biases in lensing (Kochanek 1996) and Damped Lyman- (DLA) absorption system studies based on optical selected quasar samples (Pei and Fall 1995, Fall, Pei, McMahon 1989).
Infra-red observations were first used in quasars selection by Braccesi, Lynds and Sandage (1968) where they showed how Infrared excess could be used in conjunction with UV excess, derived using UB colours, to distinguish quasars from galactic foreground stars. These early observations used red sensitive photographic emulsions which were sensitive to wavelengths beyond that of the human eye but which we would now call the the optical I band(7000-9000Å). The underlying physical principle behind the technique was the use of a wide wavelength range, 3500-8000Å, large enough to distinguish the black body dominated stellar spectra from the non-thermal powerlaw dominated spectral energy distribution of quasars. The use of IR data alone to discover quasars was demonstrated by Beichman et al. (1998) who discovered a z=0.147 quasar using JHK data from the 2 Micron All Sky Survey (2MASS). However, due to current technological limitations, obtaining deep multi band IR observations over a sufficiently wide field of view to allow the construction of a sample of satisfactory size at cosmologically interesting redshifts (i.e. z=1-2) is prohibitively expensive in terms of telescope time. The availability of large infrared mosaic cameras makes possible wide-field IR surveys and the selection of large quasar samples at IR wavelengths.
The advantage of the IR approach compared to optical is the reduced influence of both dust extinction and reddening. The removal of sources from a flux limited sample by dust extinction will be more severe at optical wavelengths than in the infrared. In addition, as discussed below, the reddening vector does not push quasars into the stellar locus. For example, Francis, Whiting, and Webster 2000 show that red quasars are indistinguishable from the stellar locus in optical multi-colour surveys, but often can be distinguished with the addition of near-IR data. Similarly, Barkhouse and Hall 2001 recommend the combination of optical and near-IR as most effective (verse optical or near-IR separately).
A complementary approach is to use radio or hard X-rays as a method to identify AGN in a manner that is not strongly biased by dust. In a recent program, Ellison et al. (2001) report the results of an survey for DLAs within a sample of radio selected quasars. Ellison et al. (2001) used a sample of 878 flat spectrum radio source with S2.7GHz250mJy. However it is not obvious that these surveys can discover enough quasars with z2, which are luminous enough in the optical that searches for damped Lyman- can be carried out, since typically 1% of quasars have radio emission at the 250mJy flux level reached by Ellison et al. (2001). Hooper et al. (1995) observed 3 out of 256 quasars (1.2%) with mB18.5 and S8GHz250mJy , rising to 14 (5.5%) with S8GHz 25mJy). Using a deeper radio survey is possible but at the mJy level, radio surveys are dominated by faint galaxies and the follow-up of such surveys could be prohibitive.
Our approach is similar to the KX technique of Warren, Hewett, and Foltz (2000) which proposes selecting quasar candidates by their K-excess in a VJ/JK colour-colour diagram (see Croom, Warren and Glazebrook (2001) for an application of the method). As an alternative to VJK based candidate selection we demonstrate a technique based on gzH observations. There are two reasons for our alternate band selection.
1) Only one near IR band is required. The use of the z band, readily obtained with large format CCD based cameras, leads to an increase in the practicality of surveying a large area. The relatively small field of view of IR array cameras is imposed only on H band observations.
2) We demonstrate that after accounting for sky brightness, K-correction and potential differential dust extinction effects between the H and K bands, observations in either band are equivalent with respect to practical observational requirements. The current availability of wide area IR imaging observations in the H band with CIRSI (section 2) make sample definition possible over a wide field of view (in excess of 10deg2).
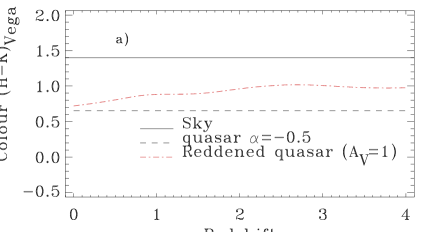
Based on information obtained from the ESO ISSAC and SOFI exposure time calculator (http://www.eso.org/observing/etc/) we find the H and K sky brightnesses to be H=14.4 and K=13.0. The quasar (HK) K-correction is estimate to be 0.6 (assuming a simple power law quasar model =0.5). Under these assumptions quasars are 0.8mag brighter relative to the sky in H than in K. Strong reddening (AV(rest)2.0) in the quasar rest frame or along the line of site is required before this situation is reversed due to the shallow slope of the reddening function at longer wavelengths under most parameterization of the reddening law (figure 1).
Although several papers have used the colours of previously known quasars to discuss quasar selection using combined optical and near-IR imaging, we demonstrate this technique by carrying out a survey for previously unknown quasars. We present follow-up spectroscopic observations that confirm the technique, and suggest high selection efficiency, high surface density, and relative independence from reddening.
In the following section (2) we discuss the infrared and optical imaging data, section (3) describes the selection of quasar candidates using colour criteria, section (4) is concerned with the implications from detection of the host galaxy. The spectroscopic observations are described in section (5), and the sample of confirmed quasars is presented in section (6).
Unless stated otherwise we use conventional Vega magnitudes and H50 km s-1 Mpc-1, q0=0.5 throughout this work.
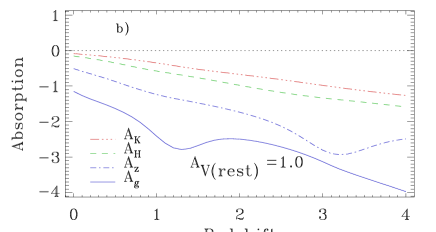
b) Absorption as a function of redshift for AV=1.0 in the rest frame is shown in the gzH and K bands.
The galactic reddening law of Seaton 1979 is used.


2 Optical and Near-IR Observations
We use optical and near-IR imaging data for three fields covering a total of deg2 to mH18 (see Table 1). These fields were chosen due to the availability of both optical and near-IR imaging from a number of survey programs.
The optical imaging was obtained as part of the Isaac Newton Telescope Wide Angle Survey (McMahon et al. (2001); http://www.ast.cam.ac.uk/wfcsur/). This survey is being carried out with the prime focus Wide Field Camera (WFC; Ives, Tulloch, and Churchill 1996) at the 2.5m Isaac Newton telescope (INT) on La Palma. The WFC consists of a closely-packed mosaic of 4 thinned EEV42 2k4k CCDs with a pixel size of 13.5m corresponding to 0.33” / pixel and effective field of view of 0.25deg2. Observations are taken in 5 wavebands (ugriz) with single exposures of 600sec over an area 100deg2 to nominal 5 limiting magnitudes of 23, 25, 24, 23 and 22 respectively. The CCD mosaic data is pipeline processed and calibrated in Cambridge (Irwin and Lewis 2000). We use a preliminary photometric calibration that is accurate to mag.
The near-IR imaging was obtained as part of two survey projects that use CIRSI (the Cambridge Infrared Survey Instrument; Beckett et al. 1996, Mackay et al. 2000). CIRSI is a JH-band mosaic imager consisting of 4 Rockwell 1k1k HgCdTe detectors, providing an instantaneous field of view of 15.6’ x 15.6’ on the INT (0.45” / pixel) and 6.6’ x 6.6’ on the du Pont 2.5m (0.19” / pixel) at the Las Campanas Observatory. The 12040736 field observations were taken with the du Pont 2.5m as part of the Las Campanas IR Survey (Firth et al. 2001, Chen et al. 2001) during the nights 29,30 December 1999; 1,2 January 2000; and 14-17 February 2000. The 1636+4101 and 02180500 field observations were taken with the INT on 13 June 2000 and 4,6,8 November 1998 respectively as part of the Infra Red CIRSI-INT survey. Total exposure times were 2000s for the 12040736 field (up to 4300s in some regions), 2400s for the 1636+4101 field, and 2480s for the 02180500 field. The typical observation sequence consisted of a 7-point dither with three 30 second exposures at each dither position, and four telescope pointings to fill in the gaps between the chips.
The CIRSI near-IR data were reduced and mosaiced using an automated pipeline (Sabbey et al. 2001), and object catalogs were produced using SExtractor (Bertin and Arnouts 1996). The photometric zeropoint was established by comparison to 2MASS (see Figure 3). With the precise astrometry available in both optical and infrared catalogs (0.3” rms with respect to the APM catalog), we were able to merge the catalogs by looking for positional matches within 1”. The merged catalog was limited to point sources to remove galaxies from the quasar candidate list. For the spectroscopic observations undertaken to date, the star/galaxy seperation was perfromed by requireing a stellar classification for candidate objects in gr and i band imaging data. Section 4 discusses the implication of this restriction to the quasar candidate list and suggests that the criterion should be relaxed to a g band stellar classification alone to prevent lower redshift quasars, with resolved host galaxies, being removed from the candidate list.
3 Colour Selection of z3 quasar candidates
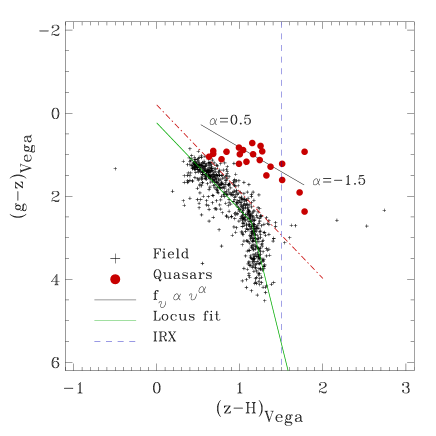
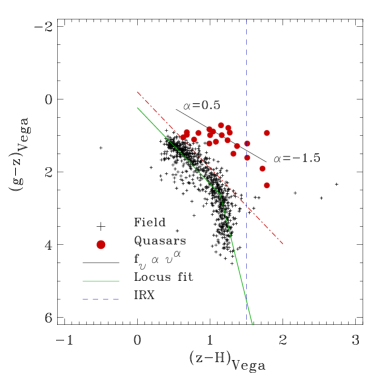
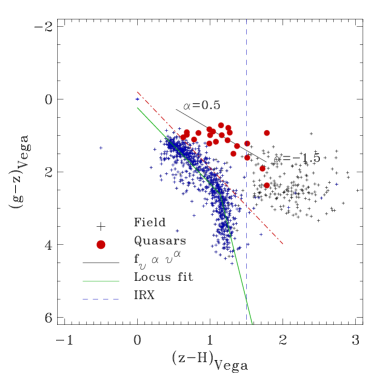
Figure 2 shows model quasar colours computed assuming an underlying quasar spectrum based on a power law with spectral index =0.50 () and with an emission line spectrum based on the Francis et al. (1991) composite spectrum. The influence of a range of values for is indicated in the plot. The reddening vector is derived over a range of redshifts using the galactic reddening model of Seaton (1979). Synthetic photometry calculations are performed with the IRAF/STSDAS package SYNPHOT. The stellar locus is calculated syntheticaly using the stellar atlas of Gunn-Stryker (1983) using the extended spectral coverage spectra from the Bruzual-Persson-Gunn-Stryker spectrophotometric atlas found in SYNPHOT. Representative filter transmission curves for the observing system are applied to the input spectra to predict the colours of objects.
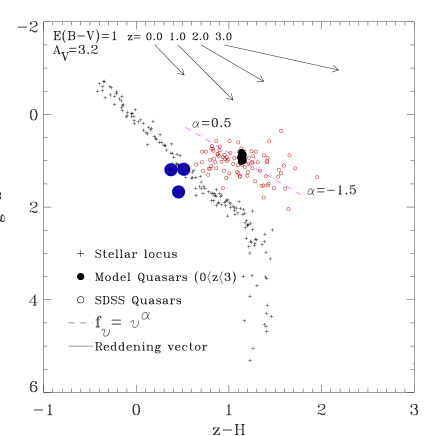
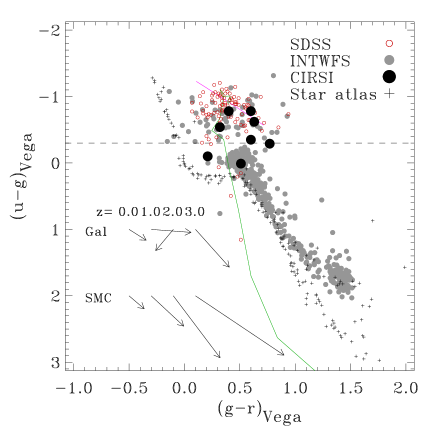
The optical and near-IR colour diagram (figure 2) shows that quasar candidates are expected to lie separated from the stellar locus in colour space and that reddening due to dust, either in the host galaxy or along the line of sight to the quasar, will not drive the quasars into the stellar locus (in contrast to purely optical colour-colour plots, see figure 11). Reddening of foreground stars moves stars parallel to the stellar locus preventing a broadened stellar locus overlapping the quasar region.
The mainly optically selected quasar sample of Richards et al. (2001) with SDSS photometry and matched with the 2MASS second incremental release is overlayed for comparison. There is evidence that the colours of the three quasars hidden with in the stellar locus in this plot are strongly effected by variability (NED identifiers NGC0450:01260019 (z=1.76), UM357:01400050 (z=0.33), PKS1215002 z=(0.42)). One object, UM357:01400050, is a known Optical Violent Variable (OVV) and all three objects are located on the quasar power law spectrum locus in gz v JK colour space. This latter space is insensitive to variability since for 2MASS the IR data is recorded simultaneously through the use of dichroics and for the SDSS bands the lag between observation is insignificant (minutes) when compared to the variability timescale for broad band optical observations of quasars.
To identify quasar candidated the stellar locus is approximated by a two component linear fit of the form,
| (1) |
The offset value being chosen to minimize the number of stray stars in the sample while rejecting a minimum of quasar candidates.
The region above these boundaries (lower gz for a give value of zH) defines the candidate selection region. All stellar objects in this region are visually inspected to check for spurious photometry due for example to stellar diffraction spikes or cosmic rays in the single exposure INT WFS data.
At redshift z3, the Lyman- forest passes into the g band and absorption in the Inter Galactic Medium (IGM) moves quasar colours into the stellar locus. Few z3 quasars would therefore be expected in a gzH selected sample.
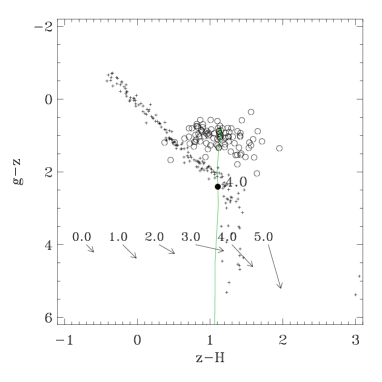
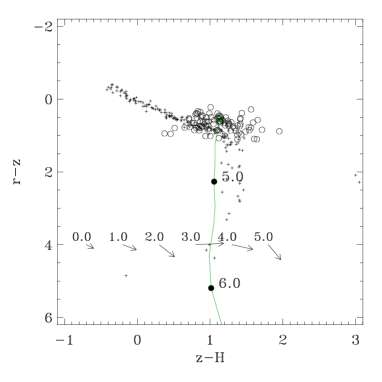
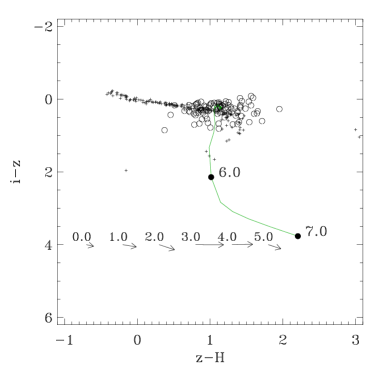
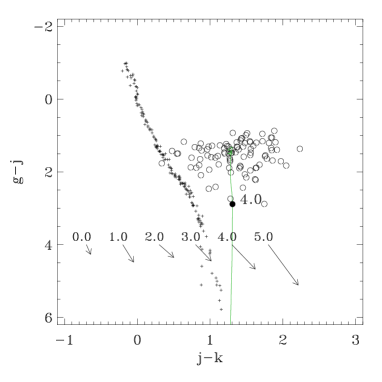
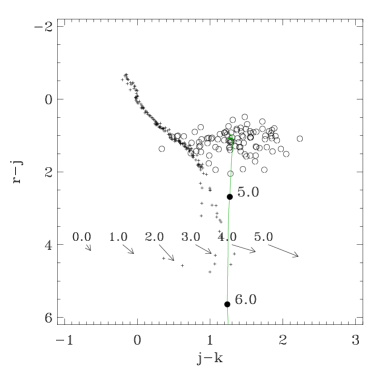
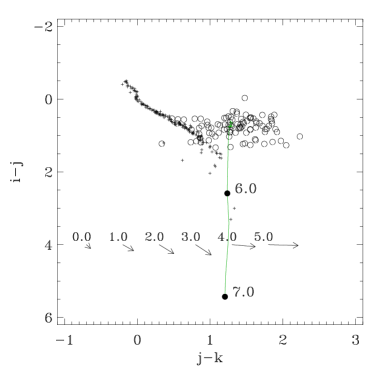
3.1 Prospects for extending the technique to z3.0
As part of the Isaac Newton Telescope Wide Angle Survey (Walton, Lennon, Irwin and McMahon 2001) optical observations, over the full range of wavelengths ugri and z, are available for two of the fields examined in this paper. This data set has been successfully used for the identification of high redshift (z5) quasars via optical colour selection techniques (Sharp, McMahon, Irwin and Hodgkin 2001). However, the gzH technique can not be used at higher redshift (z3, after the onset of IGM absorption in the g band) by replacement of the g band alone with the r or i bands as quasars merge with the stellar locus (as shown in the colour diagrams of figure 7). Figure 7 shows, as discussed by Barkhouse and Hall (2001), it is possible to use the RJK diagram. Pushing the technique into the i band and using the iJK diagram allows the selection of targets out to redshift 5 (before IGM absorption confuses the selection with the low mass region of the stellar locus) but blending with the main sequence is greater than that in the rJK diagram. Figure 7 demonstrates a range of possible selection plots.
The lower surface density of 3z4 quasars, in comparison to the high selection efficiency (65%) gzH z3 quasars, implies that a rzH selected quasar sample could be effectively integrated into a joint IR quasar selection campaign, using wide field of view multi-object spectrograph observations, capitalizing on the high multiplex capabilities of instruments such as HYDRA.
4 Potential effects of the host galaxy

There are two potential problems associate with the detection of the quasar host galaxy. Both are illustrated in figure 8.
1) The magnitude limit of the gzH selection technique is essentially set by the depth of the H band data due to the relative easy with which deep g and z observations can be achieved. However the depth of the INT WFS imaging data is sufficient that potentially the host galaxy of quasars may be detected and spatially resolved in one or more of the optical passbands. Star/galaxy separation is used to remove many galaxies from the sample and this step may also reject lower luminosity quasars with bright host galaxies.
2) The addition of a galaxy component to the observed flux may alter the objects colour to the extent that it would no longer fall within the colour selection boundary.
The absence of any quasar with z0.8 in our current sample is indicative of the first problem. Using the luminosity function of Boyle et al. (2000), and within the uncertainties of the conversion from mH to MB, we expect 2.6 quasars per deg2 to mH18.0 in the range 0.0z0.8 and MB23. However with only 47% of candidates observed at this time and a nominal survey area of 0.7deg2 this becomes 0.9 quasars that may be missing from the sample, not inconsistent with the small sample size.
Above z=0.8 the optical g band, with which star/galaxy separation is performed, samples the rest frame UV continuum (longword of the 4000Å break) where the host galaxy presence in imaging data will be at it’s weakest.
Morphological classification of objects within the INT WFS is based on an analysis of the curve of growth of an objects flux in apertures of radius 1/2, 1 ,, 2, 2 times the seeing for the observation. A detailed discussion of the classification algorithm is beyond the scope of this paper. However investigation of the aperture flux ratio and classification of simulated and observed early type galaxies and PSF limited point source profiles show that quasar cores will be classified as stellar in the INT WFS g band in the presence of an extended host galaxy component provided the host is 2 magnitudes fainter than the quasar core (assuming a De Vaucouleur light profile for the host galaxy with half-light radius 0.5” and axis ratio 0.8). This comparison is based on the seeing radius aperture magnitude as oppose to a total magnitude. A stellar classification will be obtained for the quasar core of a composite object for a lower separation in total magnitude, the value depending strongly on the definition of total magnitude.
Figure 10 addresses the second effect. A reproduction of figure 2 is shown with the colour evolution track (0z, 0.1 steps in z) for an non evolving Early type galaxy overlayed. A colour evolution track assuming a combination of the model quasar and such a host galaxy, with the galaxy normalized to 4 magnitudes fainter than the quasar in the rest frame B band, is indicated by the solid line.
While it is clear that any host galaxy contribution to the quasar colour has a significant effect, it acts to increase the detectability of the quasar in the sense that it improves separation from the stellar locus.
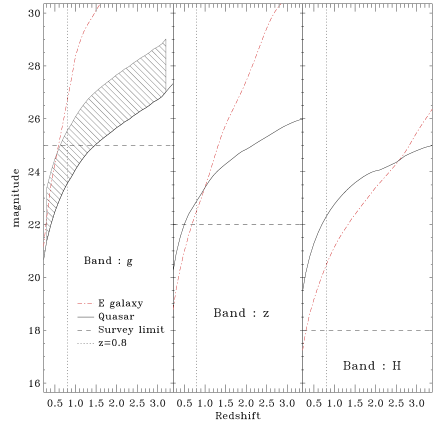
From Figure 8, the nominal H band magnitude limit of our survey of mH=18.0 corresponds to an absolute B band magnitude of 24.5 and 25.5 at z=1 and 2 respectively. Therefore if the quasar host galaxy is uncorrelated with the quasar luminosity and is assumed to correspond to an unevolved L* ellipical galaxy (MB=19.5, Madgwick et al. 2001) the quasar host will be 3-5 magnitudes fainter than the quasar nucleus. However, if the quasar host galaxy is correlated with the quasar luminosity such as one would expect from the observed correlations in the local Universe between dormant quiescent Black hole masses and galaxy bulge luminosities (Magorrian et al. 1998) the quasar host galaxy may contribute to the H band light. Taking the observed correlation between rest frame absolute magnitudes of z0.5 quasars and quasar hosts observed by Hooper, Impey and Foltz (1997) where MB=2 (see figure 9) the quasar host may contribute 50% of the light in H in the redshift range 1 to 2 (see figure 8).

5 Spectroscopic Observations
Multi-object spectroscopy was obtained using the Hydra multi-fiber spectrograph (Barden and Armandroff 1995) on the 3.5m WIYN telescope at the Kitt Peak Observatory. The 1637+4101 and 02180500 fields were observed during 2 and 3 September 2000 (as part of an observing program containing other projects) in clear sky conditions with a seeing of ”. We used the Bench Spectrograph Camera and a 316 lines/mm grating with a central wavelength of 6027Å. The total wavelength coverage was from 4240Å to 8728Å (the blue end was set by a long pass filter). The dispersion was 2.64Å/pix and the resolution was 5.7Å. Arc lamp (Cu-Ar) calibration frames were taken to set the wavelength scale. With the 1 degree field diameter and 97 red fibers (2” diameter) available, we were able to obtain spectra for both quasar candidates and a sample of random targets spread throughout the colour diagram. The minimum exposure time was 1.7 hours, although many objects were observed twice in overlapping Hydra fields resulting in 3.4 hour exposures.
Long-slit spectroscopic observations were taken during the five nights from 22 to 26 February 2001 at the du Pont 2.5m telescope at Las Campanas Observatory. The weather conditions and seeing were both good. The Modular Spectrograph was used with the SITe#2 detector and the 150mm grating to obtain spectra with 4Å/pixel over the wavelength range 4300-8500Å. We obtained spectra for 38 objects (including separate projects), with exposure times ranging from 10 minutes to 1 hour. Wavelength calibration was performed with arc spectra.
6 Confirmed Quasars
The confirmed quasars are listed in Table 2. Object 16 has a possible broad emission-line at 6500Å, but the spectrum is low signal-to-noise and requires independent confirmation. Based on Veron-Cetty and Veron (2000), 2 of the 22 confirmed quasars were previously known. Both known quasars where discovered as part of the slitless spectroscopy survey of Crampton et al. (1988). Three additional objects are listed in the NED data base as candidate quasars from Crampton, Cowley, Hartwick and Ko (1992) but without prior spectroscopic confirmation and redshifts. The redshift distribution is shown in figure 6. The median redshift is z=1.211.
The current spectroscopic sample size hampers a full comparison of the quasar space density with other works. The sample is mH limited making comparisons with optical samples complex due to uncertainties in the K-correction required to compute optical absolute magnitude indicators. The sample is not complete to an optical magnitude limit in mg or mz due to incomplete follow up of the fainter optical candidates.
U band observations are available for a subsample of 8 quasars. Two quasars, 17 and 22, do not exhibit strong UV emission and could be missing from a classical UVX selected sample. Defining a IRX criterion of z-H1.5, neither object is IRX (z-H=1.27 and 1.37 respectively). However, five IRX quasars are identified in the sample, quasars 6, 14, 15, 16 and 19. Objects 15 and 16 show low UVX (-0.35 and -0.30) while quasar 19 has a more typical value of -0.6. No u band observations are available for objects 6 and 14 at this time.
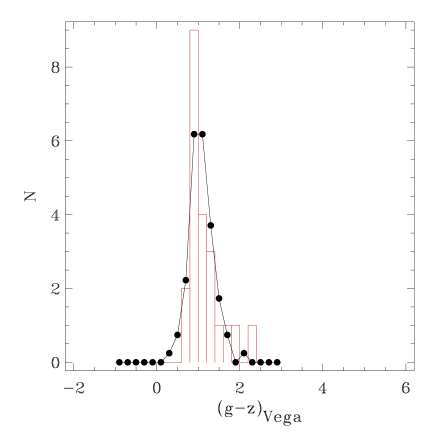
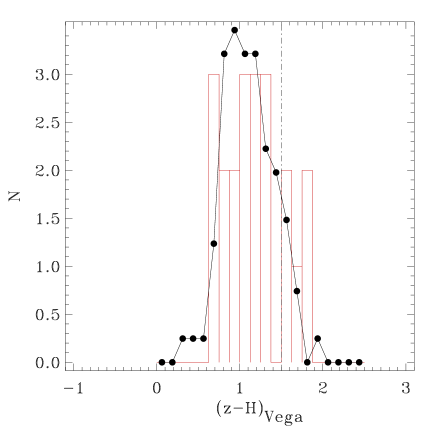
Figure 12 compares the histogram of quasar colours for
the 22 quasar CIRSI sample and 89 redshift z2.6 quasars from the
Richards et al. (2001) sample matched to the 2MASS point source
catalogue to provide H band magnitudes. The Richards et al. (2001)
sample is normalized to the total sample size of the CIRSI
observations. Within the limited sample size the colour distributions
are similar with a possible excess of IRX quasars in the CIRSI
sample.
As discussed in section 4, the lack of quasar in the sample with redshift z0.8 is not inconsistent with the luminosity function predictions within the constraints of the current survey area (0.7deg2) and 47% candidate follow up. The low number of quasars at z2 is also not inconsistent.
7 Conclusions
We report the identification of a gzH selected sample of z3 quasars. The colour diagram is used with high selection efficiency (65%) and reduced sensitivity to reddening and extinction. The initial sample has 22 confirmed quasars, but the full INT CIRSI survey will contain several hundred. To date two objects within a subsample of the identified quasars, for which UV observations are available, do not possess a significant UV excess and would not have been recovered by a UVX based selection. The full CIRSI-INT gzH quasar sample will cover an area of in excess of 10deg2 including observations across the full range of bands ugrizJ and H. Contrasting the sample with those compiled through a range of selection techniques, such as UVX colour selection and radio identifications from overlapping surveys such as the VLA-FIRST survey, will provide an excellent tool for identifying biasing within quasar selection methodologies.
| Name | R.A. (J2000) Dec | Area | Depth (Vega) | |||
|---|---|---|---|---|---|---|
| deg2 | ||||||
| 12040736 | 12:04:50 | 07:36:00 | 0.18 | 24 | 21 | 18 |
| 1636+4101 | 16:36:50 | +41:01:50 | 0.35 | 24 | 21 | 18 |
| 02180500 | 02:18:00 | 05:00:00 | 0.17 | 24 | 21 | 17.5 |
| Name | R.A. (J2000) Dec | magnitude (Vega) | g-z | z-H | Comments | ||||
|---|---|---|---|---|---|---|---|---|---|
| CIRSI1 | 12:03:48.61 | 07:19:00.7 | 19.98 | 18.76 | 17.77 | 0.858 | 1.22 | 0.99 | |
| CIRSI2 | 12:04:21.62 | 07:22:01.0 | 19.46 | 18.41 | 17.78 | 1.189 | 1.05 | 0.63 | |
| CIRSI3 | 12:04:09.20 | 07:24:22.8 | 19.89 | 18.96 | 18.12 | 1.625 | 0.93 | 0.84 | |
| CIRSI4 | 12:04:08.18 | 07:21:45.6 | 20.13 | 19.41 | 18.26 | 1.097 | 0.72 | 1.15 | |
| CIRSI5 | 12:05:34.59 | 07:41:21.4 | 19.08 | 17.97 | 17.19 | 2.660 | 1.11 | 0.78 | |
| CIRSI6 | 12:05:07.68 | 07:45:26.6 | 21.01 | 19.40 | 17.89 | 1.420 | 1.61 | 1.51 | IRX, No UV data |
| CCS88 163351.6+410628 | 16:35:31.05 | +41:00:27.2 | 19.14 | 18.25 | 17.21 | 1.151 | 0.89 | 1.04 | Crampton et al. (1988) |
| CIRSI8 | 16:37:10.03 | +40:56:42.9 | 20.21 | 19.22 | 18.06 | 1.434 | 0.99 | 1.16 | Candidate Crampton et al. (1992) |
| CIRSI9 | 16:37:00.64 | +41:05:55.2 | 19.69 | 18.78 | 18.10 | 2.061 | 0.91 | 0.68 | Candidate Crampton et al. (1992) |
| CIRSI10 | 16:36:47.16 | +41:03:35.0 | 20.54 | 19.37 | 18.29 | 1.077 | 1.17 | 1.08 | |
| CIRSI11 | 16:37:14.80 | +41:12:32.6 | 20.16 | 19.18 | 18.50 | 1.642 | 0.98 | 0.68 | Candidate Crampton et al. (1992) |
| CIRSI12 | 16:35:30.51 | +41:10:41.6 | 20.86 | 19.36 | 18.04 | 1.211 | 1.50 | 1.32 | |
| CCS88 163447.3+405448 | 16:36:27.11 | +40:48:48.9 | 19.72 | 18.89 | 17.90 | 0.904 | 0.83 | 0.99 | Crampton et al. (1988) |
| CIRSI14 | 16:37:34.03 | +41:16:09.0 | 22.42 | 20.05 | 18.27 | 1.384 | 2.37 | 1.78 | IRX, No UV data |
| CIRSI15 | 02:17:56.51 | 05:06:51.7 | 20.72 | 19.79 | 18.01 | 1.087 | 0.93 | 1.78 | IRX, low UVX |
| CIRSI16 | 02:18:34.44 | 05:13:56.9 | 20.95 | 19.04 | 17.32 | 1.351 | 1.91 | 1.72 | IRX, low UVX |
| CIRSI17 | 02:17:11.99 | 04:46:19.8 | 18.92 | 18.00 | 16.73 | 1.102 | 0.92 | 1.27 | Non UVX |
| CIRSI18 | 02:18:08.56 | 05:12:23.9 | 20.22 | 19.43 | 18.18 | 1.038 | 0.79 | 1.25 | |
| CIRSI19 | 02:18:17.42 | 04:51:12.5 | 19.41 | 18.19 | 16.68 | 1.085 | 1.22 | 1.51 | IRX |
| CIRSI20 | 02:18:13.94 | 04:52:41.1 | 19.80 | 18.67 | 17.43 | 1.443 | 1.13 | 1.24 | |
| CIRSI21 | 02:18:30.57 | 04:56:22.7 | 17.60 | 16.61 | 15.61 | 1.401 | 0.99 | 1.00 | |
| CIRSI22 | 02:17:21.66 | 05:06:28.9 | 19.97 | 18.68 | 17.31 | 0.983 | 1.29 | 1.37 | Non UVX |

Acknowledgments
RGS acknowledges the receipt of a PPARC Studentship. RGM thanks the Royal Society for support.
Optical imaging data was made publicly available through the Isaac Newton Groups’ Wide Field Camera Survey Program. The Isaac Newton Telescope is operated on the island of La Palma by the Isaac Newton Group in the Spanish Observatorio del Roque de los Muchachos of the Instituto de Astrofisica de Canarias.
The construction of CIRSI was made possible by a generous grant from the Raymond and Beverly Sackler Foundation.
Bibliography
Barden, S.C., and Armandroff, T. 1995, SPIE, 2476, 56
Barkhouse,W.A., and Hall, P.B. 2001 AJ 121 2843
Beckett, M.G. et al. 1996, SPIE, 2871, 1152
Bertin, E., and Arnouts, S. 1996, A&AS, 117, 393
Beichman C.A., Chester T.J., Cutri R., Lonsdale C.J., Kirkpatrick D., Smith H.E., Skrutskie M. 1998 PASP 110 367
Bohlin R.C., Savage B.D. and Drake J.F. 1978 ApJ 132
Boyle B. J., Shanks, T., Croom S.M., Smith R.J., Miller L., Loaring N., Heymans C. 2000 MNRAS 317 1014
Braccesi A., Lynds R., Sandage A. 1968 ApJ 152 105
Chen H.-W. 2001 arXiv:astro-ph/0108171
Coleman G.D., Wu C.-C. and Weedman D.W. 1980 ApJS 43 393
Crampton D., Cowley, A.P., Hartwick F.D.A., Ko P.W. 1992 AJ104 1706
Crampton, Cowley, Schmidtke, Janson and Durrell 1988 AJ 96 816
Croom S.M., Warren S.J., Glazebrook K. arXiv:astro-ph/0107451
Ellison S.L., Yan L., Hook I.M., Pettini M., Wall J.V., Shaver P. 2001 A&A 379 393
Fall S.M., Pei Y.C. 1995 ApJ 454 69
Fall S.M., Pei Y.C., McMahon R.G. 1989 ApJ 341L 5
Firth A.E. 2001 arXiv:astro-ph/0108182
Francis, P.J., Whiting, M.T., and Webster, R.L. 2000, PASA, 53, 56
Francis P.J. et al. , 1991, ApJ, 373, 465
Gunn J.E., Stryker L.L. 1983 ApJS 52 121
Hewett and Foltz 1994 PASP 106 113
Hooper E.J., Impey C.D., Foltz C.B. and Hewett P.C. 1995 ApJ 445 62
Hooper E.J., Impey C.D. and Foltz C.B. 1997 ApJ 480 L95
Ives D.J., Tulloch S, Churchill J. 1996 SPIE 2654 266
Kochanek C.S. 1996 ApJ 466 638
Mackay, C.D., et al. 2000, SPIE, 4008, 1317
Madau P. 1995 ApJ, 441, 18
Madgwick D.S. et al. 2001 arXiv:astro-ph/0107197
Magorrian et al. 1998 AJ, 115 2285
Masci F.J. Webster R.L., Francis P.J. 1998 MNRAS 301 975
McCarthy P., Chen H.-W., Martini P., Persson S.E., Oemler A., Carlberg R.,Abraham R.,Firth A., McMahon R., Lahav O., Sabbey C., Marzke R., Ellis R., Somerville R., Wilson J. 2001 AAS 198 7901
McMahon R.G., WaltonN.A., Irwin M.J., Lewis J.R., Bunclark P.S., Jones D.H. 2001 NewAR 4597M
Péroux C., Storrie-Lombardi L.J., McMahon R.G., Irwin M.,Hook I.M. 2001 AJ 121 1799
Prevot et al. 1984 A&A 132 389
RichardsG.T. et al. 2001AJ 122 1151
Sabbey, C.N., McMahon, R.G., Lewis, J.R., and Irwin, M.J. 2001, ASP Conference, ADASS X, (arXiv:astro-ph/0101181)
Seaton M.J. 1979, MNRAS, 187, 73
Sharp R.G., McMahon M.G., Irwin M.J. and Hodgkin S.T. 2001 MNRAS 326L 45
Storrie-Lombardi L.J., McMahon R.G., Irwin M.J. 1996 MNRAS 283L 79
Vanden Berk D.E., SDSS Collaboration arXiv:astro-ph/0105231
Veron-Cetty M.P., Veron P., 2000, ESO Scientific Report 19, 1
Walton N.A., Lennon D.J., Irwin M.J., McMahon R.G. 2001 INGN 4 3
Warren, S.J., Hewett, P.C., and Foltz, C.B. 2000, MNRAS, 312, 827