Measurement of fast bars in a sample of early-type barred galaxies
Abstract
We present surface photometry and stellar kinematics of a sample of 5 SB0 galaxies: ESO 139-G009, IC 874, NGC 1308, NGC 1440 and NGC 3412. We measured their bar pattern speed using the Tremaine-Weinberg method, and derived the ratio, , of the corotation radius to the length of the bar semi-major axis. For all the galaxies, is consistent with being in the range from 1.0 and 1.4, i.e. that they host fast bars. This represents the largest sample of galaxies for which has been measured this way. Taking into account the measured distribution of and our measurement uncertainties, we argue that this is probably the true distribution of . If this is the case, then the Tremaine-Weinberg method finds a distribution of which is in agreement with that obtained by hydrodynamical simulations. We compared this result with recent high-resolution -body simulations of bars in cosmologically-motivated dark matter halos, and conclude that these bars are not located inside centrally concentrated dark matter halos.
keywords:
galaxies: elliptical and lenticular, cD — galaxies: haloes — galaxies: kinematics and dynamics — galaxies: photometry1 Introduction
The pattern speed of a bar, , is its main kinematic observable. When parameterized by the distance-independent ratio (where is the Lagrangian/corotation radius, at which a star is at rest in the bar’s rest frame, and is the bar semi-major axis), it permits the classification of bars into fast () and slow () ones. If orbits are elongated perpendicular to the bar, so that self-consistent bars cannot exist in this regime (Contopoulos 1980).
A robust method for measuring relies on hydrodynamical simulations to model gas, particularly at shocks. These studies find fast bars (e.g. Lindblad et al. 1996; Lindblad & Kristen 1996; Weiner et al. 2001). Hydrodynamical simulations can also obtain by matching morphological features in H I (e.g. Laine 1996; England et al. 1990; Hunter et al. 1989; Aguerri et al. 2001). Moreover, if the leading, offset dust lanes frequently found in bars can be identified with shocks, then fast bars seem to be the norm in late-type galaxies (van Albada & Sanders 1982; Athanassoula 1992). A model-independent method for measuring directly was obtained by Tremaine & Weinberg (1984). The Tremaine-Weinberg method (hereafter, the TW method) is given by the simple expression , where and are luminosity-weighted mean position and velocity measured along slits parallel to the line-of-nodes. If a number of slits at different offsets from the major-axis are obtained for a galaxy, then plotting versus for the different slits produces a straight line with slope . To date this method has been applied successfully to 3 early-type barred galaxies (Kent 1987; Merrifield & Kuijken 1995; Gerssen et al. 1999; Debattista et al. 2002) and preliminary results have been obtained for another 5 galaxies ranging from SB0 to SBb (Debattista & Williams 2001; Gerssen 2002). Although all these galaxies are consistent with having fast bars, the sample size is still small enough that the range of recovered by the TW method is still poorly defined. We have started a program to enlarge the sample of pattern speeds measured with the TW method, including to galaxies of various bar strength, environment, luminosity, inclination etc. In a previous paper, (Debattista et al. 2002, hereafter Paper I), we reported on the special case of NGC 1023, a system which shows evidence of a past interaction with one or more of its satellite galaxies. In this paper, we present results for an additional 5 SB0 galaxies.
2 The Sample
Our preliminary sample of galaxies consisted of 11 SB0 objects selected to be bright and undisturbed, with no evidence of dust or spiral arms to complicate the TW analysis, generally not too many nearby stars, and a bar at intermediate angle between the orientation of the major and minor axes. After detailed analysis of their photometrical properties (as described in Section 3 below), 5 of them were rejected due to either strong variation in the ellipticity and/or position angle of the isophotal profiles at large galactocentric distances, or due to the presence of dust in their inner regions. Of the remaining 6, Paper I studied one of them, NGC 1023; in this paper we will analyze the remaining 5 galaxies: ESO 139-G009 (SAB0), IC 874 (SB0), NGC 1308 (SB0), NGC 1440 (SB0), and NGC 3412 (SB0). A compilation from the literature of their properties is given in Table 1.
| Galaxy | Type | PA | ||||||
|---|---|---|---|---|---|---|---|---|
| (RC3) | (∘) | (∘) | (mag) | (arcsec) | () | (Mpc) | (mag) | |
| (1) | (2) | (3) | (4) | (5) | (6) | (7) | (8) | (9) |
| ESO 139-G009 | (R)SAB0(rs) | 94 | 14.35 | 5389 | 71.9 | |||
| IC 874 | SB0(rs) | 17 | 13.60 | 2602 | 34.7 | |||
| NGC 1308 | SB0(r) | 135 | 14.70 | 6180 | 82.4 | |||
| NGC 1440 | (R’)SB0(rs) | 28 | 12.90 | 1382 | 18.4 | |||
| NGC 3412 | SB0(s) | 155 | 11.43 | 1202 | 16.0 |
NOTE – Col.(2): Morphological classification from RC3. Col.(3): Galaxy inclination from in RC3. Col.(4): Major-axis position angle from RC3, except for NGC 1308 and NGC 3412 (LEDA). Col.(5): Total observed blue magnitude from LEDA. Col.(6): Apparent isophotal diameters measured at a surface-brightness level of mag arcsec-2 from RC3. Col.(7): Radial velocity with respect to the CMB radiation from RC3, except for NGC 1308 (LEDA). Col.(8): distance obtained as with Mpc-1. Col.(9): Absolute total blue magnitude from corrected for inclination and extinction as in LEDA and adopting .
Four of these galaxies, ESO 139-G009, IC 874, NGC 1308, and NGC 1440 were previously poorly studied. Indeed no surface photometry or stellar kinematics was available for the first three of these, and only band photometry was available for NGC 1440 (Kodaira et al. 1990), from which Baggett et al. (1998) obtained a decomposition into bulge and disc.
This was not the case of NGC 3412, for which both surface photometry and stellar kinematics were available. Optical and NIR imaging of NGC 3412 were obtained by Kent (1984, ), Kodaira et al. (1990, ), Shaw et al. (1995, JHK) and Ann (2001, UBVRI and H). Both Shaw et al. (1995) and Ann (2001) measured an isophotal twist in the nuclear region of this galaxy, suggesting that its bulge is triaxial. Bulge-disc decompositions were perfomed by Kent (1985, ) and Baggett et al. (1998, ). Kuijken et al. (1996) obtained the position-velocity diagram of the stellar component along (the “major-axis”, but see our discussion in Section 3 below) of NGC 3412, to search for counter-rotation. They found that the fraction of counter-rotating disc stars is less than 5 per cent. Spatially resolved stellar kinematics of this galaxy have been measured by Fisher (1997, ) and Neistein et al. (1999, ), who derived the Tully-Fisher relation for a sample of nearby lenticular galaxies.
3 Surface Photometry
The photometric observations of ESO 139-G009 and IC 874 were carried out with the 3.5-m New Technology Telescope (NTT) at the European Southern Observatory (ESO) in La Silla (Chile) in May 2001. We used the ESO Multi-Mode Instrument (EMMI) in red imaging and low-dispersion spectroscopic (RILD) mode. The detector was the No. 36 Tektronik TK2048 EB CCD with pixels. The image scale was 0.27 arcsec pixel-1. We imaged NGC 1308 and NGC 3412 at the 1-m Jacobus Kapteyn Telescope located at the Roque de los Muchachos Observatory (ORM) in La Palma (Spain) in October 2001 and May 2000, respectively. We used a SITe2 CCD with pixels and an image scale of 0.33 arcsec pixel-1. Finally, we observed NGC 1440 with the Danish 1.54-m telescope at ESO in La Silla in November 2001. The telescope mounted the Danish Faint Object Spectrograph and Camera (DFOSC) with the EEV/MAT 44-82 CCD with pixels. The image scale was 0.39 arcsec pixel-1. The log of the photometrical observations is given in Table 2.
All images were reduced using standard IRAF111IRAF is distributed by NOAO, which is operated by AURA Inc., under contract with the National Science Foundation tasks. First, we subtracted a bias frame consisting of 10 exposures for each night. The images were then flat-fielded using sky flats taken at twilight. The sky-background level was removed by fitting a second order polynomial to the regions free of sources in the images. Special care was taken at this point to obtain a final background in the images free of sources, in order to reach the outermost parts of the objects. Cosmic rays were removed by combining the different exposures for each filter using a sigma clipping rejection algorithm.
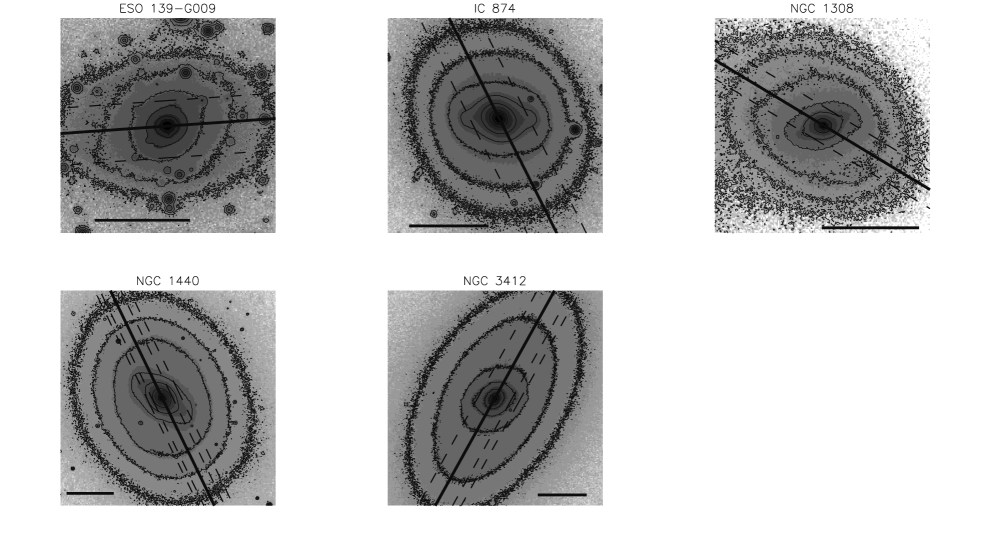
Photometric calibrations were achieved by means of standard stars. The calibration constants include corrections for atmospheric and Galactic extinction, and a colour term. Fig. 1 shows calibrated -band images of the galaxies.
| Galaxy | Date | Exp. Time (sec) | ||
|---|---|---|---|---|
| ESO 139-G009 | 22-23 May 2001 | |||
| IC 874 | 22-23 May 2001 | |||
| NGC 1308 | 11 Oct 2001 | |||
| NGC 1440 | 11 Nov 2001 | |||
| NGC 3412 | 27-28 May 2000 | |||
NOTE – a Bessel, b Gunn, c Harris
4 BAR LENGTH
4.1 Photometrical parameters
Isophote-fitting with ellipses, after masking foreground stars and bad pixels, was carried out using the IRAF task ELLIPSE. In all cases, we first fit ellipses allowing their centers to vary; within the errors, no variation in the ellipse centers was found for the 5 galaxies studied in this paper. Since patchy obscuration can cause variations of ellipse centers, we conclude that there is no evidence for such obscuration in our sample, as we also verified from colour maps and colour profiles, where possible. The final ellipse fits were done at fixed ellipse centers. In Figs. 2-6, we show the resulting surface brightness, colour, ellipticity and position angle profiles of the galaxies. The inclination and position angle of the galaxies were determined by averaging the outer isophotes, as shown in Fig. 1. The values obtained are reported in Table 3. The inclinations obtained for the galaxies are, within the errors, consistent with the values reported in the literature. The position angle has larger differences, the biggest being in the case of NGC 1308. We speculate that the LEDA value of the position angle for this galaxy is contaminated by the bright star to its east. In measuring the photometrical parameters of this galaxy, we masked out the whole eastern part, to minimize the contamination from this star. In the case of NGC 3412, it is possible to compare our values of and with the ones obtained by Kent (1984), who found and . These data are in very good agreement with our measurements, as given in Tab. 3.
Using the ellipse fits, we measured the angle, , between the bar major-axis and the line-of-nodes in the deprojected plane of the disc. The values of this parameter are reported in Tab. 3.
| Galaxy | P.A.disc | ||
|---|---|---|---|
| (∘) | (∘) | (∘) | |
| ESO 139-G009 | |||
| IC 874 | |||
| NGC 1308 | |||
| NGC 1440 | |||
| NGC 3412 |


4.2 Bar semi-major axis length
Determining the length of a bar is not entirely trivial. This is particularly true in early-type galaxies, for which there is usually no obvious spiral structure or star formation beyond the bar marking its end, so that the luminosity distribution of the bar gradually melds into that of the disc. The presence of a large bulge may complicate further the measurement of . Fourier decomposition of the galaxy light (Ohta et al 1990; Aguerri et al 2000), identification of a change in the slope of the surface-brightness profile along the bar major-axis (Chapelon et al. 1992), visual ispection of galaxy images (Martin 1995), location of minimum/maximum in the ellipticity profile (Wozniak et al. 1995), and modeling the structural components contributing to the galaxy surface brightness (Prieto et al 2001) are among the several methods which have been proposed for measuring . We have used three of these, yielding 4 estimates of ( to ). The mean of these is our best estimate of and we use the largest deviations from the mean for the error estimates. The values obtained are given in Table LABEL:tab:bars_length. The three methods are the following:
-
1.
Fourier amplitudes. Since a bar represents a bisymmetric departure from axisymmetry, a Fourier decomposition is a natural way to measure . The method of Aguerri et al. (2000) is based on the ratios of the intensities in the bar and the inter-bar region. The azimuthal surface brightness profile of the deprojected galaxies is decomposed in a Fourier series. The bar intensity, , then is defined as: (where and are the , 2, 4 and 6 terms of the Fourier decomposition, respectively). The inter-bar intensity is defined as: . The bar region is defined as the region where ; thus the semi-major axis of the bar is identified as the outer radius at which . Athanassoula & Misiriotis (2002) applied this method to the analytic models of Athanassoula (1992) (for which are known exactly) and found an accuracy of better than 8 per cent. In practical applications to early-type galaxies, adjustment for the presence of a massive bulge, which in deprojection may result in a higher peak in than that due to the bar, may be required (e.g. Paper I). The values listed as in Table LABEL:tab:bars_length are the ones which were obtained using this method. Figure 7 shows relative amplitudes of the Fourier components and the bar/interbar intensity ratio of the galaxies.
-
2.
Fourier and ellipse phases. In their analysis of -body models, Debattista & Sellwood (2000) also made use of a Fourier decomposition of the surface density. Here we adopt their (deprojected) phase method for , namely that a bar can extend only as far out as the phase of the moment is constant (within the errors, which here must include uncertainties in PA and ). In -body simulations, secondary structures, such as rings or spirals, sometimes lead to an over-estimate of the semi-major axis. However, our early-type galaxies were selected to be free of spirals and rings. A related, but not equivalent, method uses the phases of the ellipse fits, which then gives us estimate in Table LABEL:tab:bars_length. In Figure 7, we plot the phases of the Fourier moments and of the ellipses, showing and .
-
3.
Decomposition of surface brightness profiles. The surface brightness profiles of galaxies can be decomposed into a number of structural components, each of which may be described by some simple analytic model. Barred galaxy models are complicated by their non-axisymmetric nature; a method for such decompositions has been developed by Prieto et al. (2001), which we used here. We assumed four different components: bulge, disc, bar and lens. The bulge luminosity was modeled with a Sérsic’s law (Sérsic 1968), while the disc was modelled by an exponential profile (Freeman 1970). Two profile types for the bars were used: elliptical (Freeman 1966) and flat (Prieto et al. 1997). The best fit for NGC 3412 was obtained with an elliptical bar; for the other galaxies, we used flat bars. The lenses were characterized by a smooth luminosity gradient with a very sharp cut-off (Duval & Athanassoula 1983). The model of NGC 1308 did not need to include a lens; for all the other galaxies, the fit was improved by including one.
In all, ten free parameters needed to be fit: the central surface brightness and the scale-length of the disc, the effective surface brightness, the effective radius, and the Sérsic index of the bulge, the central surface brightness, the semi-major and the semi-minor axes of the bar, the central surface brightness and the scale-radius of the lens. The fits were performed on the major and minor-axes of the bar, after deprojecting the image by means of a flux-conserving stretch along the disc minor-axis.
We used an interactive, iterative method, described in Prieto et al. (2001) to obtain initial estimates of all the parameters. Then, these estimates of the parameters were used as input parameters in an automatic fitting routine using a Levenberg-Marquardt nonlinear fitting algorithm (Press et al. 1992). Figure 7 shows the best fit of the surface-brightness profiles along the major axis of the bar for the galaxies of our sample. Table LABEL:tab:bars_length also includes the bar semi-major axis measured with this method ().
| Galaxy | |||||
|---|---|---|---|---|---|
| (arcsec) | (arcsec) | (arcsec) | (arcsec) | (arcsec) | |
| ESO 139-G009 | 23.4 | 14.0 | 16.1 | 14.4 | |
| IC 874 | 18.7 | 21.0 | 25.0 | 15.0 | |
| NGC 1308 | 13.2 | 9.0 | 13.2 | 14.2 | |
| NGC 1440 | 23.2 | 24.6 | 30.5 | 19.2 | |
| NGC 3412 | 28.2 | 30.0 | 32.2 | 34.0 |
5 Long-Slit Spectroscopy
The spectroscopic observations of ESO 139-G009, IC 874, NGC 1308 and NGC 1440 were carried out with NTT at ESO in La Silla in May and November 2001. The NTT mounted EMMI in red medium-dispersion spectroscopic (REMD) mode, using the grating No. 6 with 1200 in first order with a arcsec arcmin slit. The detector was the No. 36 Tektronix TK2048 EB CCD with pixels of . It yielded a wavelength coverage between about 4840 Å and 5490 Å with a reciprocal dispersion of 0.320 . The instrumental resolution was Å (FWHM) corresponding to at 5170 Å. The spatial scale was arcsec pixel-1.
We observed NGC 3412 with the 3.6-m Telescopio Nazionale Galileo (TNG) at the ORM in La Palma in February 2001. The TNG was equipped with the Low Resolution Spectrograph (DOLORES); we used the HR-V grism No. 6 with 600 in combination with the arcsec arcmin slit and the Loral CCD with pixels of . The wavelength range between about 4700 and 6840 Å was covered with a reciprocal dispersion of 1.055 Å pixel-1. The instrumental resolution (obtained by measuring the width of emission lines of a comparison spectrum after the wavelength calibration) was Å (FWHM). This corresponds to an instrumental dispersion of at 5170 Å. The spatial scale along the slit was arcsec pixel-1.


| Galaxy | Date | Slit | Exp. Time |
| (sec) | |||
| ESO 139-G009 | 24 May 2001 | arcsec N | |
| 23 May 2001 | major axis | ||
| 23 May 2001 | arcsec S | ||
| IC 874 | 23 May 2001 | arcsec E | |
| 22 May 2001 | major axis | ||
| 24 May 2001 | arcsec W | ||
| NGC 1308 | 15 Nov 2001 | arcsec E | |
| 17 Nov 2001 | major axis | ||
| 16 Nov 2001 | arcsec W | ||
| NGC 1440 | 17 Nov 2001 | arcsec E | |
| 15 Nov 2001 | arcsec E | ||
| 15 Nov 2001 | major axis | ||
| 16 Nov 2001 | arcsec W | ||
| 17 Nov 2001 | arcsec W | ||
| NGC 3412 | 01 Feb 2001 | arcsec E | |
| 02 Feb 2001 | major axis | ||
| 01 Feb 2001 | arcsec W | ||
| 02 Feb 2001 | arcsec W |
For each galaxy, we took a spectrum with the slit along the major axis, as well as two or more offset spectra with the slit parallel to the major axis on each side of the center. The major axis position angles were chosen according to the values obtained from the surface photometry, as described in Sect. 4.1 and listed in Table 3. The location of the offset spectra was chosen, using the photometry, to give large (and therefore large ) and high . Integration time of the galaxy spectra was split into exposures of 2700/3600 sec to deal with cosmic rays. A log of the observations is given in Table LABEL:tab:log_spec. In each observing run we obtained spectra of twelve giant stars with spectral type ranging from late-G to early-K, selected from Faber et al. (1985), to use as templates in measuring stellar kinematics. Arc lamp spectra were taken before and/or after every object exposure to allow an accurate wavelength calibration. The range of the seeing FWHM during the observing runs was – arcsec in February 2001 (as measured by fitting a two-dimensional Gaussian to the TNG guide star), – arcsec in May 2001, and – arcsec in November 2001 (as measured by the ESO Differential Image Motion Monitor).
All the spectra were bias subtracted, flatfield corrected, cleaned of cosmic rays, corrected for bad pixels and columns, and wavelength calibrated using standard MIDAS222MIDAS is developed and maintained by the European Southern Observatory routines as in Paper I. We checked that the wavelength rebinning was done properly by measuring the difference between the measured and predicted wavelengths (Osterbrock et al. 1996) for the brightest night-sky emission lines in the observed spectral ranges. The resulting accuracy in the wavelength calibration is better than 2 .
The spectra taken along the same axis for the same galaxy were co-added using the center of the stellar continuum as reference. The contribution of the sky was determined from the outermost arcsec at the two edges of the resulting spectra, where the galaxy light was negligible, and then subtracted, giving a sky subtraction better than 1 per cent. A one-dimensional sky-subtracted spectrum was obtained for each kinematical template star.

6 Bar and disc kinematics
6.1 Stellar kinematics
We measured the stellar kinematics from the galaxy absorption features present in the wavelength range centered on the Mg line triplet ( Å, see Tab. 7) using the Fourier Correlation Quotient method (Bender 1990; Bender et al. 1994), as done in Paper I. We adopted HR 6817 (K1III) as the kinematical template to measure the stellar kinematics of NGC 3412, HR 7429 (K3III) for the kinematics of ESO 139-G009 and IC 874, and HR 3145 (K2III) for the kinematics of NGC 1308 and NGC 1440.
The values of line-of-sight velocity , and velocity dispersion measured along the different slits for each sample galaxy are given in Table LABEL:tab:kinematics.
| (arcsec) | (km s-1) | (km s-1) | (arcsec) | (km s-1) | (km s-1) | (arcsec) | (km s-1) | (km s-1) | (arcsec) | (km s-1) | (km s-1) |
|---|---|---|---|---|---|---|---|---|---|---|---|
| ESO 139-G009 - 10 arcsec N | |||||||||||
| NGC 1308 - 5 arcsec E | |||||||||||
| ESO 139-G009 - major axis | |||||||||||
| NGC 1440 - 6 arcsec W | |||||||||||
| NGC 1308 - major axis | |||||||||||
| ESO 139-G009 - 8 arcsec S | |||||||||||
| NGC 1308 - 5 arcsec W | |||||||||||
| NGC 1440 - 11 arcsec W | |||||||||||
| IC 874 - 10 arcsec E | |||||||||||
| NGC 1440 - 9 arcsec E | |||||||||||
| NGC 3412 - 10 arcsec W | |||||||||||
| NGC 3412 - 10 arcsec E | |||||||||||
| IC 874 - major axis | |||||||||||
| NGC 1440 - 6 arcsec E | |||||||||||
| NGC 3412 - 15 arcsec W | |||||||||||
| NGC 3412 - major axis | |||||||||||
| NGC 1440 - major axis | |||||||||||
| IC 874 - 10 arcsec W | |||||||||||
6.2 Pattern speed measurement
We measured the bar pattern speed for each sample galaxy by applying the TW method as done in Paper I.
To compute the mean position of stars, , along the slits, we generally extracted profiles from and -band surface photometry along the positions of the slits. In the case of NGC 1440, because of the radial colour gradient, we preferred to use the intensity from the slit spectra themselves, although they are somewhat noisier. For the remaining galaxies, the -band profiles match very well the profiles obtained by collapsing the spectra along the wavelength direction, confirming that the slits were placed as intended. We used the broad band profiles to compute because these are less noisy than the spectral profiles, particularly at large radii. We computed the value of at each slit position by Monte Carlo simulation, with photon, read-out and sky noise to compute the errors. Formally, the integrals in TW equation are over , but can be limited to if has reached the axisymmetric part of the disc; still larger values of add noise only. The values thus obtained are given in Tab. 7.
To measure the luminosity-weighted line-of-sight stellar velocity, , for each slit position, we collapsed each two-dimensional spectrum along its spatial direction to obtain a one-dimensional spectrum. The resulting spectra have been analysed with the FCQ method using the same template star adopted in Sect. 6.1 to derive the stellar kinematics of the galaxy; is then the radial velocity derived from the LOSVD of the one-dimensional spectra. For each slit position, the uncertainty on was estimated by means of Monte Carlo simulations as done for in measuring the stellar kinematics. The values we derived along each slit and the adopted wavelength (always including the Mg triplet) and radial ranges (limited by the noise, and after removing the contribution of foreground stars by linear interpolation) are given in Tab. 7.
For each galaxy, we derived by fitting a straight line to the values obtained from the available slit positions (Fig. 9). Finally the value of (Table LABEL:tab:bar_kinematics) was derived from the adopted galaxy inclination, as given in Table 3.

| Galaxy | Offset | ||||
| (arcsec) | () | (arcsec) | (Å) | ||
| ESO 139-G009 | arcsec N | 5014.1,5486.2 | |||
| major axis | 5014.1,5486.2 | ||||
| arcsec S | 5014.1,5486.2 | ||||
| IC 874 | arcsec E | 5039.2,5486.2 | |||
| major axis | 5039.2,5486.2 | ||||
| arcsec W | 5039.2,5486.2 | ||||
| NGC 1308 | arcsec E | 5115.3,5431.7 | |||
| major axis | 5115.3,5431.7 | ||||
| arcsec W | 5115.3,5431.7 | ||||
| NGC 1440 | arcsec E | 5115.3,5431.7 | |||
| arcsec E | 5115.3,5431.7 | ||||
| major axis | 5115.3,5431.7 | ||||
| arcsec W | 5115.3,5431.7 | ||||
| arcsec W | 5115.3,5431.7 | ||||
| NGC 3412 | arcsec E | 4964.2,5541.4 | |||
| major axis | 4964.2,5541.4 | ||||
| arcsec W | 4964.2,5541.4 | ||||
| arcsec W | 4964.2,5541.4 |
6.3 Systemic and mean streaming velocities
To measure the systemic velocity of the galaxies, we fit interpolating splines to the measured velocities and fitted “tilted rings”, of fixed and PA (as obtained from the photometry), to the inner parts of the galaxies. In the case of NGC 1308, our data were not of sufficient S/N to permit such fits, in which case we used on the major axis; for the other four galaxies, comparision of Tables 7 and LABEL:tab:bar_kinematics shows that the major-axis is a very good approximation to . In Table LABEL:tab:bar_kinematics, we compare our measurements of with those in RC3. In all cases we find excellent agreement.
Once is measured, we obtain the stellar mean streaming velocities, , by subtracting , then folding about the origin the major-axis data. Figure 8 shows that our folded spectra have no substantial asymmetries on the two sides.
6.4 Asymmetric drift correction
Measurement of with the TW method requires no modeling. However, in the absence of gas velocities at large radii, measurement of requires some modeling to recover the rotation curve from the observed stellar streaming velocities. This asymmetric drift correction can be fairly large in early-type disc galaxies, where the velocity dispersions are large. We start from the asymmetric drift equation (e.g. Binney & Tremaine [1987] Eqn. 4-33)
| (1) |
where is the circular velocity, is the disk’s volume density, and and are the tangential and radial velocity dispersions in the cylindrical coordinates of the galaxy’s intrinsic plane. We then make the following assumptions:
-
1.
We assume that the true rotation curve is flat at large radii. This is usually a very good approximation in high surface-brightness galaxies. Thus we only measure , the amplitude of the rotation curve. A flat rotation curve implies , which allows us to write, for the observed velocity dispersion on the major-axis, , where . We use 3 values of , 0.7, 0.85 and 1.0, which bracket a plausible range for this parameter in early-type disc galaxies extrapolating from the only 3 measured values in later-type systems (Dehnen & Binney 1998; Gerssen et al. 1997; Gerssen et al. 2000). The variations in this parameter are included in our error estimate of .
-
2.
We assume that decreases exponentially with radius, with scale-length . We fit with the major-axis data, outside the bar region when the S/N permits; these fits are shown in Fig. 8.
-
3.
We assume the the disc’s volume density is radially exponential. Since we are interested here in the total mass density, we fitted an exponential to the surface brightness measured in ellipses with position angle and ellipticity fixed to the values determined from large radii. The fits to started outside ; we varied the radial range of the fits to obtain error estimates on ; these were as large as 15 per cent. Variations in are also included in our error estimate on .
With these assumptions, the asymmetric drift equation becomes
| (2) |
We apply this correction to all velocity data points (including those not on the major-axis) outside the bar radius and within of the major-axis. We average over all these points to obtain , with an additional error from the scatter of the points added in quadrature. We report our findings of in Table LABEL:tab:bar_kinematics, and in Fig. 8.
In Paper I, the high surface brightness of NGC 1023 allowed us to drop the assumption that , and instead we used the velocity dispersion data from all slits to obtain (having assumed ; because of its high inclination for this galaxy is not very sensitive to the value of ). For comparison, we have redone the asymmetric drift correction of NGC 1023 with the method described above for the new sample. We found , which is in excellent agreement with the value of Paper I.
We finally measured as . We used Monte Carlo to estimate the uncertainties in by varying and uniformly in their respective ranges, and varying assuming the errors of Table LABEL:tab:bar_kinematics are Gaussian. We report the median and the 67 per cent interval of in Table LABEL:tab:bar_kinematics.

| Galaxy | ||||||
|---|---|---|---|---|---|---|
| () | () | () | () | (arcsec) | ||
| ESO 139-G009 | ||||||
| IC 874 | ||||||
| NGC 1308 | ||||||
| NGC 1440 | ||||||
| NGC 3412 |
7 Discussion and Conclusions
The 5 SB0’s presented in this work, together with NGC 1023 studied in Paper I, which we include in our sample for this discussion, represent the largest sample of barred galaxies, with measured by means of the TW method. For all of them, is consistent with being in the range 1.0 to 1.4, within the errors, i.e. with each having a fast bar. The unweighted average for the sample is . The apparent range of spans from 0.8 to 1.6 (0.6 to 2.1, within the 67 per cent intervals). This spread is not related to the properties of the galaxies in any obvious way (e.g. for the two galaxies at , NGC 1023 and NGC 1440, the measured values of are at opposite extremes of the distribution). The fact that some of the values of are nominally less than unity leads us to suggest that the large range of is a result of random errors and/or scatter in the measurements.
The sources of random errors are largely due to measurement uncertainties in all 3 quantities used to compute , i.e. , and . Of these, the largest is in , amounting to typical fractional uncertainties of 30 per cent, followed by , for which the typical fractional uncertainty is 20 per cent. These uncertainties account for the typical large (and asymmetric towards large values) errors on measurements of .
A likely source of scatter is errors in the disc PA. Debattista (2002) shows that, for PA errors of FWHM (note that the root-mean-square PA uncertainty in our sample is ), the scatter in is of order 0.44, large enough to account for the cases. Since PA errors scatter to both larger and smaller values, then the largest measured value of is probably an over-estimate. If this is the case, then TW measurements are finding the same range of as do hydrodynamic simulations.
The conclusion that bars are fast constrains the dark matter distribution in disk galaxies. Debattista & Sellwood (1998, 2000) argued that bars this fast can only survive if the disc in which they formed is maximal. Recent high resolution -body simulations with cosmologically-motivated dark matter halos produce bars with in the range between 1.2 and 1.7 (Valenzuela & Klypin 2002). Even discounting our argument above in favor of a more restricted range of , Fig. 10 shows that is possible only for the bars of IC 874, NGC 1440 NGC 3412 and, marginally, NGC 936, while the bars of ESO 139-G009, NGC 1023, NGC 1308 and NGC 4596 never reach this value of . Note, moreover, that 3 of the galaxies that do reach have amongst the largest fractional errors in . Therefore we conclude that the -body models of Valenzuela & Klypin (2002) probably produce slower bars than the observed.
The galaxy ESO 139-G009 is classified as SAB (i.e. weakly barred) in RC3; the fact that it hosts a fast bar suggests that weak bars form via the same mechanism that forms the strong ones. Thus the hypothesis of Kormendy (1979), that weak bars are the end state of slowed down fast bars, already in question from -body simulations (Debattista & Sellwood 2000), is also unsupported by the limited observational data. Further measurements of for weak bars would be of considerable interest.
Acknowledgements.
VPD and JALA acknowledge support by the Schweizerischer Nationalfonds through grant 20-64856.01. JALA was partially supported by Spanish DGC (Grant AYA2001-3939). EMC acknowledges the Astronomisches Institut der Universität Basel for the hospitality while this paper was in progress. We are indebted to R. Bender and R. Saglia for providing us with the FCQ package which we used for measuring the stellar kinematics. We are also grateful to A. Pizzella for the images he acquired. This research has made use of the Lyon-Meudon Extragalactic Database (LEDA) and of the NASA/IPAC Extragalactic Database (NED). This paper is based on observations carried out with the New Technology Telescope and the Danish 1.54-m Telescope (Prop. No. 67.B-0230 and No. 68.B-329) at the Europen Southern Observatory, La Silla (Chile), with the Italian Telescopio Nazionale Galileo (Prop. AOT-3, 3-06-119) operated on the island of La Palma by the Centro Galileo Galilei of the Consorzio Nazionale per l’Astronomia e l’Astrofisica, and with the Jacobus Kapteyn Telescope operated by the Isaac Newton group at La Palma island at the Spanish Observatorio del Roque de los Muchachos of the Instituto de Astrofísica de Canarias.
References
- [1] Aguerri J. A. L., Muñoz-Tuñón C., Varela A. M., Prieto M. 2000, A&A, 361, 841.
- [2] Aguerri J. A. L., Hunter J. H., Prieto M., Varela A. M., Gottesman S. T., Muñoz-Tuñón C. 2001, A&A, 373, 786.
- [3] Ann H. B. 2001, Ap&SS, 276, 683
- [4] Athanassoula E. 1992, MNRAS, 259, 345
- [5] Athanassoula E., Misiriotis A. 2002, MNRAS, 530, 35
- [6] Baggett W. E., Baggett S. M., Anderson K. S. J. 1998, AJ, 116, 1626
- [7] Bender R. 1990, A&A, 229, 441
- [8] Bender R., Saglia R. P., Gerhard O. E. 1994, MNRAS, 269, 785
- [9] Binney J., Tremaine S. 1987, Galactic Dynamics, Princeton University Press, Princeton
- [10] Chapelon S., Contini T., Davoust E. 1999, A&A 345, 81
- [11] Contopoulos G. 1980, A&A, 81, 198
- [12] Debattista V. P. 2002, in preparation
- [13] Debattista V. P., Sellwood J. A. 1998, ApJL, 493, L5
- [14] Debattista V. P., Sellwood J. A. 2000, ApJ, 543, 704
- [15] Debattista V. P., Corsini E. M., Aguerri J. A. L., 2002, MNRAS, 332, 65
- [16] Dehnen W., Binney J. J. 1998, MNRAS, 298, 387
- [17] de Vaucouleurs G., de Vaucouleurs A., Corwin H. G., Buta R. J., Paturel G., Fouquè P. 1991, Third Reference Catalogue of Bright Galaxies. Springer-Verlag, New York (RC3)
- [18] Duval M. F., Athanassoula E. 1983, A&A, 121, 297
- [19] England M. N., Gottesman S. T., Hunter, J. H., 1990, ApJ, 348, 456
- [20] Faber S. M., Friel E. D., Burstein D., Gaskell C. M. 1985, ApJS, 57, 711
- [21] Fisher, D. 1997, AJ, 113, 950
- [22] Freeman K. C. 1966, MNRAS, 133, 47
- [23] Freeman K. C. 1970, ApJ, 160, 811
- [24] Gerhard O. E. 1993, MNRAS, 265, 213
- [25] Gerhard O. E., Jeske G., Saglia R. P., Bender R. 1998, MNRAS, 295, 197
- [26] Gerssen J., 2001, in J. G. Funes & E. M. Corsini, eds, ASP Conf. Ser. Vol 230, Galaxy Disks and Disk Galaxies. Astron. Soc. Pac., San Francisco, p. 553
- [27] Gerssen J., 2002, in E. Athanassoula & A. Bosma, eds, ASP Conf. Ser., Disks of Galaxies: Kinematics, Dynamics and Perturbations. Astron. Soc. Pac., San Francisco, to appear
- [28] Gerssen J., Kuijken K., Merrifield M. R. 1997, MNRAS, 288, 618
- [29] Gerssen J., Kuijken K., Merrifield M. R. 1999, MNRAS, 306, 926
- [30] Gerssen J., Kuijken K., Merrifield, M. R. 2000, MNRAS, 317, 545
- [31] Hunter J. H., Ball R., Huntley J. M., England M. N., Gottesman S. T. 1989, ApJ, 324, 721
- [32] Kent S. M. 1984, ApJS, 56, 105
- [33] Kent S. M. 1985, ApJS, 59, 115
- [34] Kent S. M. 1987, AJ, 93, 1062
- [35] Kodaira K., Okamura S., Ichikawa S. 1990, Photometric Atlas of Northern Bright Galaxies. University of Tokyo Press, Tokyo
- [36] Kormendy J. 1979, ApJ, 227, 714
- [37] Kuijken K., Fisher D., Merrifield M. R. 1996, MNRAS, 283, 543
- [38] Laine S. 1996, Ph. D. Thesis, Florida University.
- [39] Lindblad P. A. B., Kristen H. 1996, A&A, 313, 733
- [40] Lindblad P. A. B., Lindblad P. O., Athanassoula E. 1996, A&A, 313, 65
- [41] Martin P. 1995, AJ 109, 2428
- [42] Merrifield M. R., Kuijken K. 1995, MNRAS, 274, 933
- [43] Neistein E., Maoz D., Rix H.-W., Tonry J. L. 1999, AJ, 117, 2666
- [44] Osterbrock D. E., Fulbright J. P., Martel, A. R., Keane M. J., Trager S. C., Basri, G. 1996, PASP, 108, 277
- [45] Ohta K., Masaru H., Wakamatsu K. 1990, ApJ 357, 71
- [46] Press W. H., Teukolsky S. A., Vetterling W. T., Flannery B. P. 1992, Numerical Recipes, Cambridge Univ. Press, Cambridge
- [47] Prieto M., Gottesman S. T., Aguerri J. L., Varela A. 1997, AJ, 114, 1413
- [48] Prieto M., Aguerri J. A. L., Varela A. M., Muñoz-Tuñón C., 2001, A&A, 367, 405
- [49] Sérsic J. L. 1968, Atlas de Galaxias Australes. Observatorio Astronómico, Córdoba
- [50] Shaw M., Axon D., Probst R., Gatley I. 1995, MNRAS, 274, 369
- [51] Tremaine S., Weinberg M. D. 1984, ApJ, 282, L5
- [52] Valenzuela O., Klypin A., 2002, MNRAS, submitted
- [53] van Albada T. S., Sanders R. H. 1982, MNRAS, 201, 303
- [54] van der Marel R. P., Franx M. 1993, ApJ, 407, 525
- [55] Weiner B. J., Sellwood J. A., Williams T. B. 2001, ApJ, 546, 931
- [56] Wozniak H., Friedli D., Martinet L., Martin P., Bartschi P. 1995, A&AS 111, 115