The discovery of 2.78 hour periodic modulation of the X-ray flux from globular cluster source Bo 158 in M31.
Abstract
We report the discovery of periodic intensity dips in the X-ray source
XMMU J004314.1+410724, in the globular cluster Bo158 in M31. The X-ray
flux was modulated by at a period of 2.78 hr (10017 s) in
an XMM-Newton observation taken 2002 Jan 6-7. The X-ray intensity dips
show no energy dependence. We detected weaker dips with the same period
in observations taken 2000 June 25 (XMM-Newton) and 1991 June 26
(ROSAT/PSPC). The amplitude of the modulation has been found to be
anticorrelated with source X-ray flux: it becomes lower when the source
intensity rises. The energy spectrum of Bo158 was stable from
observation to observation, with a characteristic cutoff at
keV. The photo-electric absorption was consistent with the Galactic
foreground value. No significant spectral changes were seen in the course
of the dips. If the 2.78 hr cycle is the binary period of Bo158 the system
is highly compact, with a binary separation of cm. The
association of the source with a globular cluster, together with spectral
parameters consistent with Galactic neutron star sources, suggests that
X-rays are emitted by an accreting neutron star. The properties of Bo 158
are somewhat reminiscent of the Galactic X-ray sources exhibiting a dip-like
modulations. We discuss two possible mechanisms explaining the
energy-independent modulation observed in Bo 158: i) the obscuration of the
central source by highly ionized material that scatters X-rays out of the
line of sight; ii) partial covering of an extended source by an opaque
absorber which occults varying fractions of the source.
Subject headings: galaxies: individual (M31) — stars: individual
(Bo158) — galaxies: star clusters — X-rays: galaxies — X-rays: stars
1. INTRODUCTION
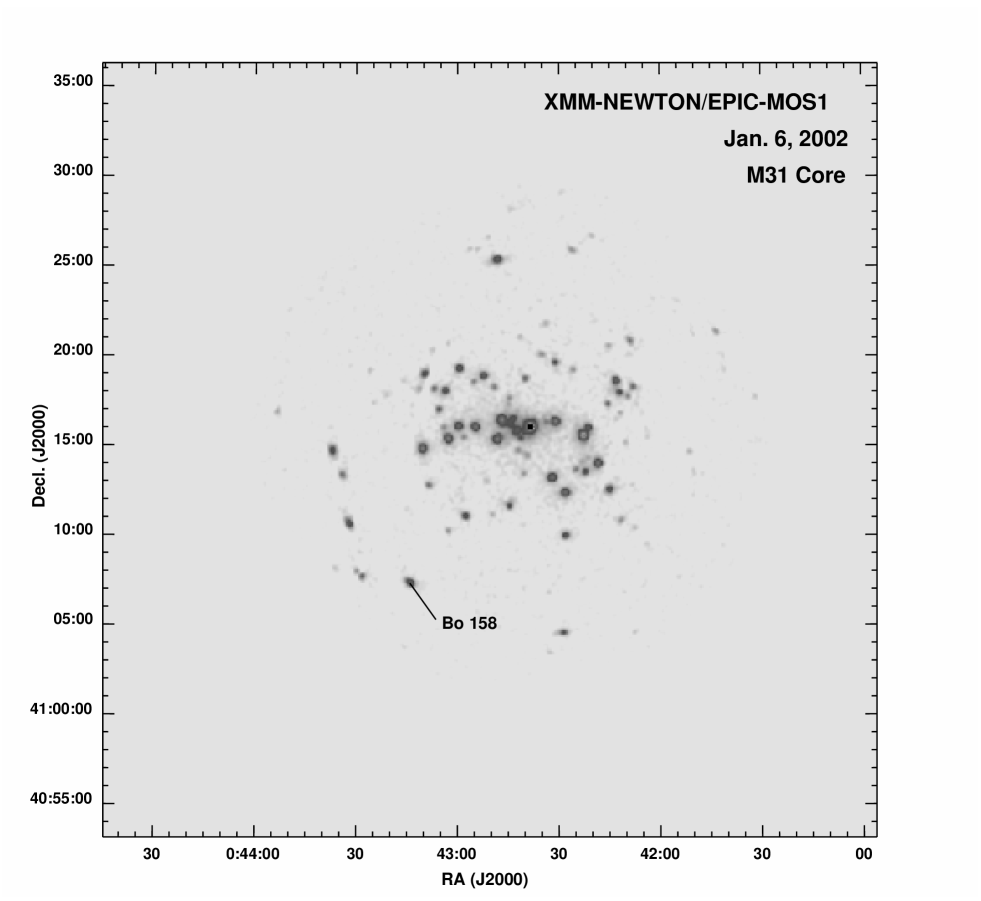
The X-ray source XMMU J004314.1+410724 was discovered in M31 by the Einstein observatory (source in Trinchieri & Fabbiano (1991)) and was detected in subsequent observations with ROSAT (Primini et al. (1993); Supper et al. (2001)), XMM-Newton (Shirey et al. (2001)) and Chandra (DiStefano et al. (2002)). Based on the Chandra aspect solution, which is currently limited by systematics to accuracy, the source location is , (2000 equinox) (DiStefano et al. (2002))(Fig. 1). This position of the source is consistent with the optically identified globular cluster candidate Bo 158 (source in Table IV of Battistini et al. (1987)) (we will use the designation “Bo 158” as a source name throughout this Letter).
The previous observations were too insensitive for detailed study of individual sources in M31. The large collecting area and bandpass of XMM-Newton allow us to study the short-term variability and spectral properties of these sources. In this Letter we report the discovery of periodic X-ray modulation of the lightcurve of Bo 158 and report its spectra.
2. OBSERVATIONS AND DATA ANALYSIS
In the following analysis we use data from three XMM-Newton observations of the bulge of M31 (Table 1, Figure 1). The first observation of the central part of M31 was performed on June 25, 2000 as a part of the Performance Verification Program (PI: M.G. Watson) (Shirey et al. (2001); Osborne et al. (2001)). Two other observations were performed on June 29, 2001 (Shirey (2001)) and on January 6, 2002 as a part of the Guaranteed Time Program (PI: K.O. Mason and M.G. Watson). We use data from three European Photon Imaging Camera (EPIC) instruments: two EPIC MOS detectors (Turner et al. (2001)) and the EPIC PN detector (Strueder et al. (2001)). In all observations the EPIC instruments were operated in the full window mode ( diameter FOV) with medium (2000 June 25 and 2001 June 29 observations) and thin (2002 January 6 observation) optical blocking filters.
During all three XMM-Newton observations, the X-ray source Bo 158 was offset by from the center of the field of view (Fig. 1). In spite of the significant degradation in the sensitivity of the EPIC cameras at high offset angles, the statistics (more than 3000 counts in each observation) were sufficient for a detailed spectral and timing analysis.
We reduced EPIC data with the XMM-Newton Science Analysis System (SAS v 5.3)111See http://xmm.vilspa.esa.es/user. We performed standard screening of the EPIC data to exclude time intervals with high background levels. To generate lightcurves and spectra of the source, we used an extraction radius of and subtracted as background the spectrum of adjacent source-free regions with subsequent normalization by a ratio of detector areas. We used data in the keV energy band because of the uncertainties in the calibration of the EPIC instruments outside this range. All fluxes and luminosities presented below apply to this band. In the following analysis we assume a source distance of 760 kpc (van den Bergh 2000).
We used standard XANADU/XRONOSv.5 222http://heasarc.gsfc.nasa.gov/docs/xanadu/xronos/xronos.html Fourier transform and epoch folding tasks to search for the periodic modulation of the source X-ray flux and determine its period.
We used spectral response matrixes generated by SAS tasks. The energy spectra of the source were fitted to two analytic models using XSPEC v.11 (Arnaud (1996)): an absorbed simple power law (powerlaw) and comptonization (comptt) models333For model description see http://heasarc.gsfc.nasa.gov/docs/xanadu/xspec/xspec.html and references therein. EPIC-PN, MOS1 and MOS2 data were fitted simultaneously, but with independent normalizations.
3. RESULTS
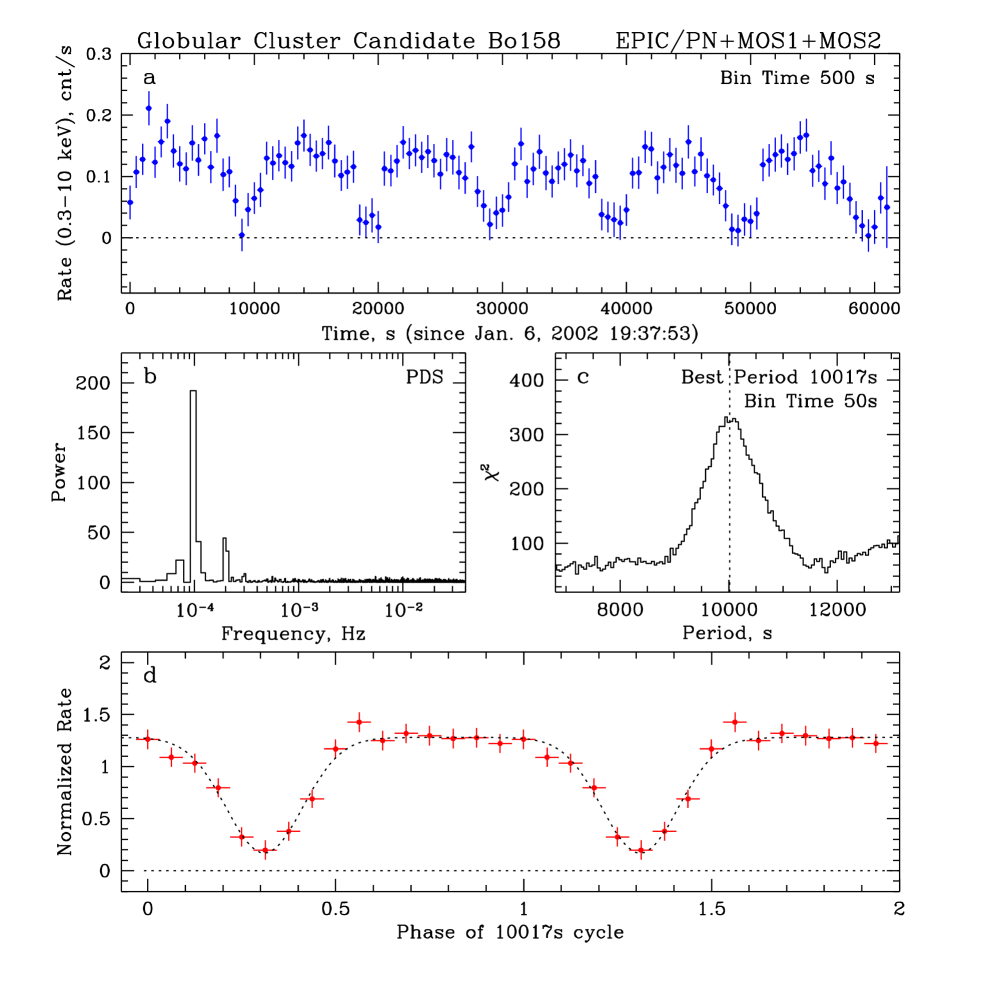
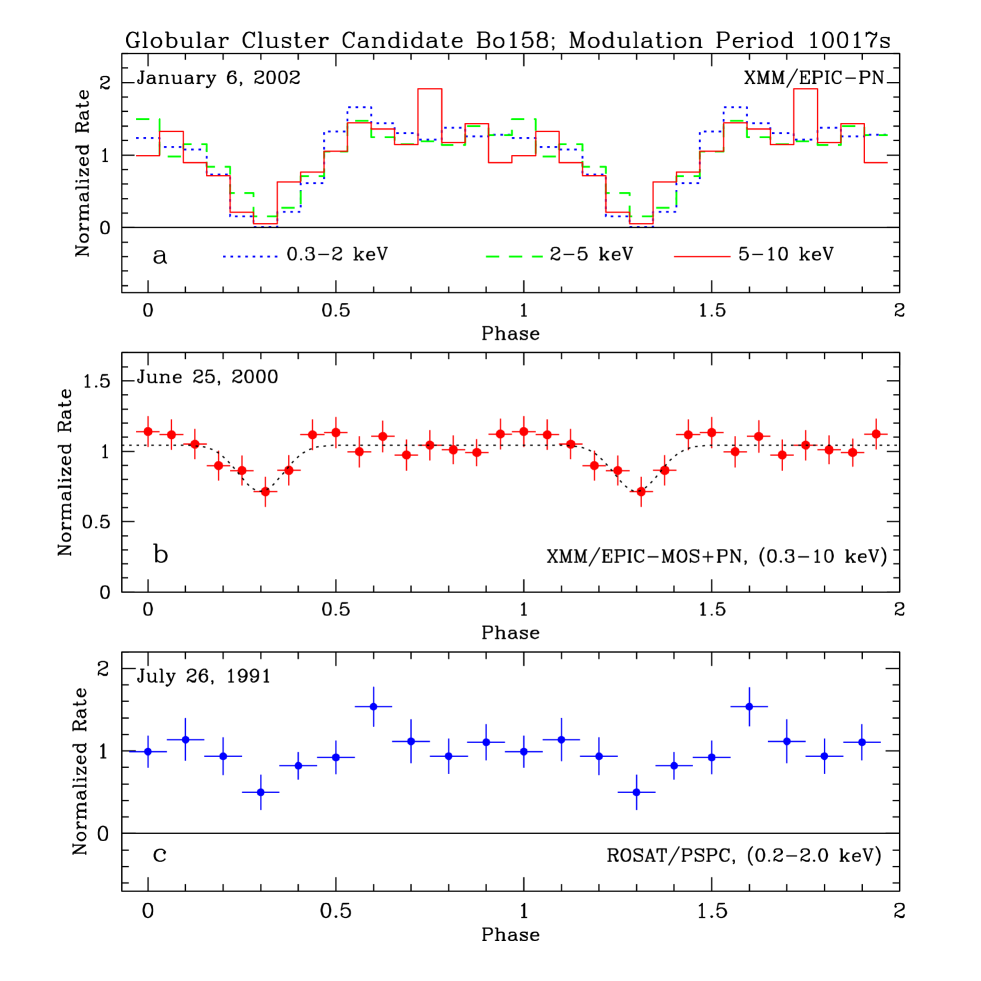
We generated X-ray lightcurves of the source in the keV energy band using data from the EPIC-PN, MOS1 and MOS2 detectors, combining them in order to improve statistics. The resulting lightcurve of Bo 158 for the 2002 Jan. 6 observation (Fig. 2a) shows a pattern of recurrent dips in the X-ray intensity with a period of s. The dips are broad, lasting for of the -s cycle. Their FWHM varies between 2200 and 3000 s, and their depths range from to of the out-of-dip flux. The recurrence period is s. Figure 2b,c shows the power density spectrum of the source from to Hz, and our determination of the period with an epoch folding analysis. Figure 2d shows the combined EPIC (PN+MOS1+MOS2) light curve for the Jan. 6 observation folded on the 10017 s best period of the modulation (phase 0.0 is set arbitrarily at TJD=12279.0). In order to investigate the energy dependence of the X-ray modulation during 2002 Jan. 6 observation, we constructed lightcurves in the , , and keV bands. As it is clearly seen in Figure 3a, there is no significant energy dependence of the modulation.
We searched for this modulation in earlier observations of M31, including 2000 Jun. 25 and 2001 Jun. 29 XMM-Newton observations of the center of M31, and ROSAT/PSPC observation from 1991 Jul. 26. We produced combined EPIC-MOS lightcurves in the keV energy range and a PSPC lightcurve in the keV energy band. X-ray flux modulations with periods close to s ( s and s respectively) were marginally detected in the 2000 Jun. 25 and 1991 Jul. 26 observations. Figure 3 shows the XMM-Newton/EPIC and ROSAT/PSPC light curves folded on the 10017 s period determined above. The lightcurves of 2000 Jun. 25 and 1991 Jun. 26 observations show a and intensity drop during the dip (Fig. 3b,c), while for the 2001 Jun. 29 observation, dips were not detected with a upper limit of .
In case of 2002 Jan. 6 and 2000 Jun. 25 observations, where regular dips in the X-ray lightcurve of the source were clearly detected, we fit the folded keV lightcurves with a simple model, consisting of a constant plus a Gaussian with negative normalization centered at the dip minimum: 444where is a phase of 10017-s cycle, is a source out-of-dip intensity level, , and are normalization, centroid phase and FWHM of Gaussian respectively(the best-fit model approximation is shown with dotted lines in Fig. 2d and Fig. 3b). Using this approximation, we obtain a amplitude of the dip with respect to the out-of-dip intensity and (in phase units of s cycle) for the 2002 Jan. 6 observation, and amplitude and for the 2000 Jun. 25 observation. The values of imply an average FWHM for the dips of order s.
The averaged XMM/EPIC spectra of Bo 158 was analyzed by fitting two different spectral models (Table 2). A model with a quasi-exponential cut-off (the Comptonization model in Table 2) at keV describes the energy spectra significantly better than a simple power law. This spectrum is somewhat reminiscent of Galactic neutron star systems with high luminosity (Iaria et al. (2001); DiSalvo et al. (2001)). The spectrum is stable from observation to observation, despite the change in X-ray luminosity from (2002 Jan. 6) to ergs s-1 (2001 Jun. 29), although the cut-off energy may increase at the higher luminosities.
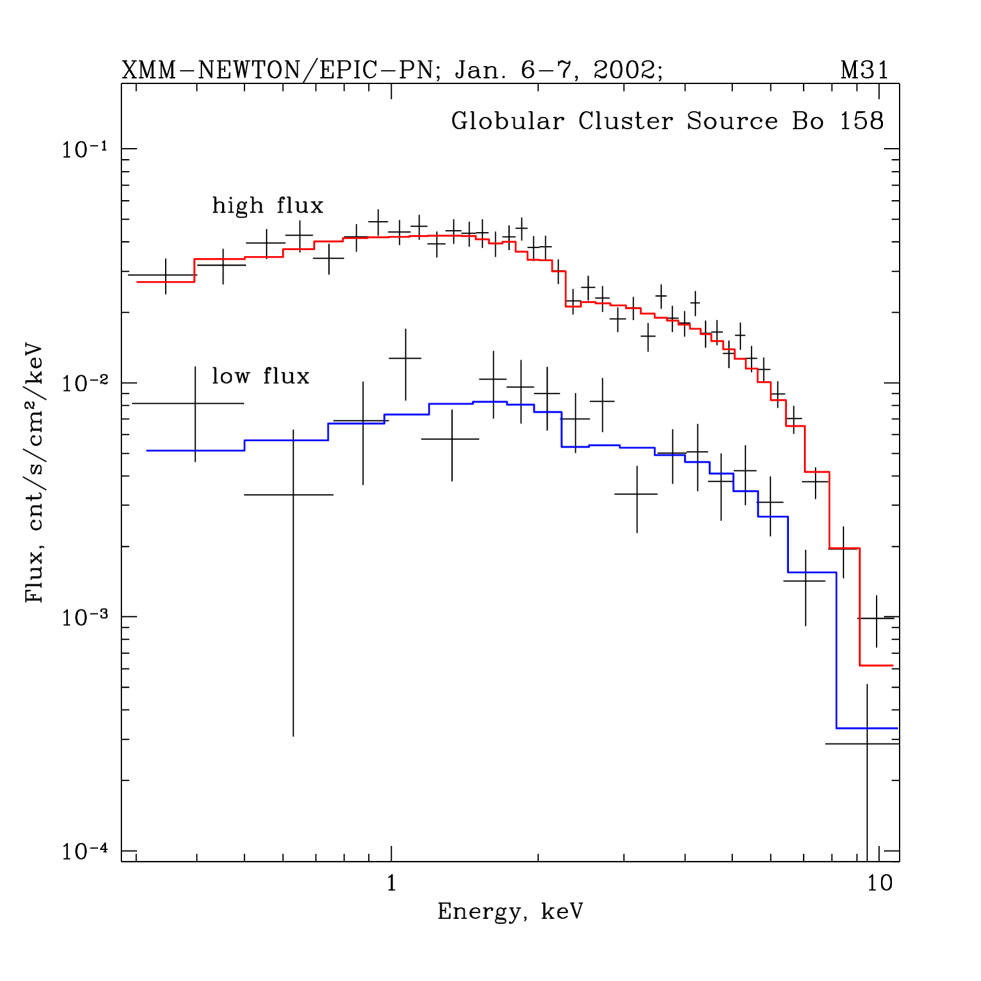
In order to investigate any changes in the energy spectrum during the intensity dips, we divide the spectra from 2002 Jan. 6 observation into two states corresponding to the out-of-dip and dip intensity (Fig. 4)(i.e. the fluxes higher and lower than cnt/s in Fig. 2a). A saturated comptonization model with electron temperature keV and optical depth gives a good approximation to both spectra (Fig. 4). The resulting upper limit on an increase in neutral absorbing column density during the dips is (assuming a single spectral component). However, if the dips are caused by electron scattering in a cloud along the line of sight, the electron column density must be cm-2 ( dipping) and cm-2 ( dipping) for 2002 Jan. 6 and 2000 Jun. 25 observations respectively.
It should be mentioned that the Comptonization model which fits the spectrum during the intensity dips does not provide a unique determination of the spectral form. Other complex models (e.g. two-component models with different low-energy absorption column densities) also give acceptable fits. The low statistical significance of the data does not allow us to discriminate between these models.
There is an anti-correlation between the average amplitude of the modulation and the source intensity on a long time scale. The values of modulation fraction were in 2002 Jan. 6 observation, in 2000 Jun. 25 observation and in 2001 Jun. 29 observation, corresponding to the source luminosities of , and ergs s-1 respectively. In addition, a dependence of the dip strength upon the luminosity on a time scale of hours was marginally detected during the 2000 Jun. 25 observation.
4. DISCUSSION
We have discovered a -hour periodic dip-like modulation with variable amplitude in the X-ray flux of the globular cluster candidate source Bo 158 in M31. The amplitude of the modulation is anticorrelated with source intensity: it becomes lower with increasing X-ray flux. The most interesting feature of this modulation is its lack of energy dependence.
If the -hour modulation represents the binary period, , the binary separation is cm 555where is a mass of the compact object in solar units and is a mass ratio of the secondary star and a compact object. The association of the source with a globular cluster, and spectral parameters consistent with Galactic neutron star sources, suggest that the compact object in Bo158 is probably a neutron star in a low-mass binary. This implies a highly compact binary with separation cm.
The properties of Bo 158 are somewhat reminiscent of Galactic X-ray sources that exhibit dip-like modulations (e.g. Cygnus X-3 and some ”dipping” sources).
Although there are similarities between the light curve of Bo 158 and the Galactic binary Cygnus X-3, it is unlikely that these systems have a common nature. The broad minimum in the 4.8-hour cycle of Cygnus X-3 is explained as variable scattering in the dense photoionized wind of a Wolf-Rayet companion (Paerels et al. (2000)). Moreover, in contrast to Bo 158, the amplitude of X-ray modulation in Cygnus X-3 is extremely stable in spite of drastic changes in luminosity.
The duration of the intensity dips in phase is similar to those seen in some Galactic LMXB dipping sources such as X1755-338 (Mason et al. (1985)), XB1254-690 (Courvoisier et al. (1986)) and XB 1916-053 (Yoshida et al. (1995)), although Bo 158 is much more luminous. The lack of energy dependence of the modulation is a common feature of a number of dipping sources. The dips in these systems are believed to be caused by absorption and scattering in an obscuring medium, i.e. a bulge or thickened region of the accretion disk, or inhomogeneities in the mass transfer stream (White & Swank (1982); Lubow & Shu (1976); Frank, King Lasota (1987)).
If the dips in Bo 158 are caused by an obscuring structure, at least two explanations could be proposed to explain the energy independence of the intensity dips: i) the obscuring material is highly ionized (Mason et al. (1985)); ii) the dips are caused by partial covering of an extended source (Church et al. (1997)).
(i) If the obscuring structure is located close to the X-ray emission region, the obscuring medium could be strongly ionized. The compactness and high X-ray luminosity of Bo 158 could imply a high ionization in the region responsible for the dips. The obscuring matter in the Galactic dipping sources, with their smaller luminosities ( ergs s-1), is less strongly ionized. For the material causing the dips to be completely ionized, the ionization parameter (where is the central source luminosity, is the gas density of the cloud, and is the distance from the central source to the obscuring medium)(Hatchett, Buff & McCray (1976)) should be larger than ergs cm s-1. For the 2002 Jan. 6 observation, an average intensity reduction requires a column, , of cm-2. Assuming an out-of-dip luminosity of Bo 158 to be ergs s-1, and following Mason et al. (1985), we conclude that all material closer than cm 666where filling factor, , is the scattering column length will be highly ionized. Another estimate of the ionization stage of the obscuring medium is based on the duration of the intensity dips (Remillard & Canizares (1984)). For s, assuming that the absorbing medium is roughly spherical and fixed in the frame of the binary, . To obtain , the ionized region must be closer than cm (2002 Jan. 6 observation) and cm (2000 Jun. 25 observation). The absorbing medium in a 2.78-hour binary could fall well within these limits, and be highly ionized.
(ii) For an opaque absorber to produce broad dips, the emission region must be extended and the eclipse partial. The source could be a scattering corona-like structure, and/or thick disk/outflow located close to the compact object, and the absorber a thickened region of accretion disk, or a mass transfer stream from the companion star.
The diminution of the modulation with increase of the X-ray flux could indicate a decrease of the obscured fraction of the emission region, caused by increasing the size of the emitter or decreasing the size of the absorber.
We would like to thank the referee for his/her helpful comments. This paper is based in part on observations obtained with XMM-Newton, an ESA science mission with instruments and contributions directly funded by ESA Member States and the USA (NASA). This research has made use of data obtained through the High Energy Astrophysics Science Archive Research Center Online Service, provided by the NASA Goddard Space Flight Center.
References
- Arnaud (1996) Arnaud, K. 1996, in Astronomical Data Analysis Software and Systems V, ASP Conference Series 101, ed. G. Jacoby J. Barnes (San Francisco: ASP) 17
- Battistini et al. (1987) Battistini, P., et al. 1987, AAS, 67, 447
- Church et al. (1997) Church, M. J., Dotani, T., Balucinska-Church, M., Mitsuda, K., Takahashi, T., Inoue, H., & Yoshida, K. 1997, ApJ, 491, 388
- Courvoisier et al. (1986) Courvoisier, T. J.-L., Parmar, A. N., Peacock, A., Pakull, M. 1986, ApJ, 309, 265
- DiSalvo et al. (2001) DiSalvo, T., Robba, N. R., Iaria, R., Stella, L., Burderi, L., & Israel, G. L. 2001, ApJ, 554, 49
- DiStefano et al. (2002) DiStefano, R., et al. 2002, ApJ, 570, 618
- Frank, King Lasota (1987) Frank, J., King, A. R., & Lasota, J. P. 1987, AA, 178, 137
- Hatchett, Buff & McCray (1976) Hatchett, S., Buff, J., & McCray, R. 1976, ApJ, 206, 847
- Iaria et al. (2001) Iaria, R., Burderi, L., Di Salvo, T., La Barbera, A., & Robba, N. R. 2001, ApJ, 547, 412
- Lubow & Shu (1976) Lubow, S. H., & Shu, F. H. 1976, ApJ, 207, L53
- Mason et al. (1985) Mason, K. O., Parmar, A. N., & White, N. E. 1985, MNRAS, 216, 1033
- Osborne et al. (2001) Osborne, J. P., et al. 2001, AA, 378, 800
- Paerels et al. (2000) Paerels, F., Cottam, J., Sako, M., Liedahl, D. A., Brinkman, A. C., van der Meer, R. L. J., Kaastra, J. S., & Predehl, P. 2000, ApJ, 533, L135
- Primini et al. (1993) Primini, F. A., Forman, W., & Jones, C., 1993, ApJ, 410, 615
- Remillard & Canizares (1984) Remillard, R. A., & Canizares, C. R. 1984, ApJ, 278, 761
- Shirey et al. (2001) Shirey, R., et al. 2001, AA, 365, L195
- Shirey (2001) Shirey, R. 2001, IAU Circ. 7659
- Strueder et al. (2001) Strueder, L. et al., 2001, A&A, 365, L18
- Supper et al. (2001) Supper, R., et al. 2001, AA, 373, 63
- Trinchieri & Fabbiano (1991) Trinchieri, G., & Fabbiano, G., 1991, ApJ, 382, 82
- Turner et al. (2001) Turner, M. J. L., et al. 2001, A&A, 365, L27
- van den Bergh (2000) van den Bergh, S. 2000, The Galaxies of the Local Group, (Cambridge University Press, Cambridge)
- White & Swank (1982) White, N. E., & Swank, J. H. 1982, ApJ, 253, L61
- Yoshida et al. (1995) Yoshida, K., Inoue, H., Mitsuda, K., Dotani, T., Makino, F. 1995, PASJ, 47, 141
| Date, UT | , UT | Field | Obs. ID | RA (J2000)a | Dec (J2000)a | Exp.(MOS)b | Exp.(PN)b |
|---|---|---|---|---|---|---|---|
| (h:m:s) | (h:m:s) | (d:m:s) | (ks) | (ks) | |||
| 25/06/2000 | 10:44:42 | M31 Core | 0112570401 | 00:42:43.0 | 41:15:46.1 | 34.8 | 31.0 |
| 29/06/2001 | 06:21:38 | M31 Core | 0109270101 | 00:42:43.0 | 41:15:46.1 | 32.6 | 30.8 |
| 06/01/2002 | 18:07:17 | M31 Core | 0112570101 | 00:42:43.0 | 41:15:46.1 | 63.0 | 61.0 |
-
a
– coordinates of the center of the FOV
-
b
– instrument exposure used in the analysis
| Parameter | Observation Date | ||
| Jun. 25, 2000 | Jun. 29, 2001 | Jan. 6, 2002 | |
| Absorbed Power Law (powerlaw*wabs) | |||
| Photon Index | |||
| N | |||
| Fluxb | |||
| (d.o.f) | |||
| Absorbed Comptonization Model (comptt*wabs) | |||
| kT | |||
| kT | |||
| N | |||
| Fluxb | |||
| (d.o.f) | |||
-
a – equivalent absorbing hydrogen column density in units of cm-2
-
b – model flux in the keV energy range in units of erg s-1 cm-2
-
c – temperature of soft photons, keV
-
d – electron temperature, keV
-
e – Thomson optical depth for the spherical geometry