An der Sternwarte 16
D-14482 Potsdam (Germany)
11email: ssanchez@aip.de 22institutetext: Instituto de Física de Cantabria
Universidad de Cantabria-CSIC
Avd. de Los Castros S/N
35005-Santander (Spain)
22email: gserrano@ifca.unican.es
Cluster of galaxies around seven radio-loud QSOs at 1z1.6
We have conducted a NIR study of the environments of seven radio-loud quasars at redshifts 1z1.6. In present paper we describe deep band images obtained for the fields of 66 arcmin around the quasars with 3 limiting magnitudes of 20.5. These fields were previously studied using deep and band images (Sánchez & González-Serrano 1999). Using together optical and NIR data, it has been found a significant excess of galaxies which optical-NIR colours, luminosity, spatial scale, and number of galaxies are compatible with clusters at the redshift of the quasar.
We have selected a sample of cluster candidates analyzing the vs. diagram. A 25% of the candidates present red optical-NIR colours and an ultraviolet excess. This population has been also found in clusters around quasars at the same redshifts (Tanaka et al. 2000; Haines et al. 2001). These galaxies seem to follow a mixed evolution: a main passive evolution plus late starformation processes. The quasars do not inhabit the core of the clusters, being found in the outer regions. This result agrees with the hypothesis that the origin/feeding mechanism of the nuclear activity were merging processes. The quasars inhabit the region were a collision is most probably to produce a merger.
Key Words.:
Galaxies: clusters: general – quasars: general1 Introduction
There is much evidence for a connection between the QSO activity and clustering of galaxies (Stockton 1982; Yee & Green 1984, 1987; Gehren et al. 1984; Hutchings et al. 1984; Hintzen 1984; Yee 1987; Ellingson et al. 1991; Hintzen et al. 1991; Yee& Ellingson 1993; Fisher et al. 1996; Yamada et al. 1997; Hall et al. 1998; Hall & Green 1998; Sánchez & González-Serrano 1999; Cimatti et al. 2000; Wold et al. 2000). It seems that interaction/merging processes amoung cluster galaxies could rule a fundamental role in the origin/feeding process of the nuclear activity. The large fraction of host galaxies of radio quasars with distorted morphologies (e.g. Disney et al. 1995; Hutchings & Neff 1997; Sánchez 2001; Sánchez et al. 2002), their large luminosities at 1 (Carballo et al. 1998; Sánchez et al. 2002, and references therein), direct evidences in their spectra (Nolan et al. 2001), and the velocity distribution of galaxies around QSOs (Heckman et al. 1984; Ellingson et al. 1991) give support to this hypothesis (Yee & Ellingson1993).
Yee & Green (1987), Ellingson et al. (1991), Yee & Ellingson et al. (1993) and Wold et al. (2000) have shown evidences of the connection between radio emission and galaxy clustering around QSOs. They found differences between the environment of radio-loud and radio-quiet quasars. Since radio-loud QSOs are found in clusters of galaxies with an Abell richness class between 0-2 (Abell 1958), radio-quiet relatives inhabit groups of galaxies of richness similar or even lower than 0. However, these results were based in studies of overdensities of galaxies around low- quasars (0.7). At higher redshifts, the number of studies decreases (Hitzen et al. 1991; Boyle & Couch 1993; Hall & Green 1998), or were based in a reduced number of objects (Hutchings et al. 1993; Yamada et al. 1997; Sánchez & González-Serrano 1999; Teplitz et al. 1999; Cimatti et al. 2000). However, the differences between the environment of radio-loud and radio-quiet quasars appear to persist at high- (12).
Hall et al. (1998) and Hall & Green (1998) showed that the excess of galaxies around their sample of 31 radio-loud QSOs at 12 seems to present a two component distribution, with a peak around the quasars at 35 and a smooth component that extends to r100 (his maximun sampled distance). They explained this two-component distribution as a cluster of galaxies embebbed in a large scale structure. In Sánchez & González-Serrano (2001), hereafter Paper I, we have analyzed the deep and band images of seven radio loud quasars at 1z1.6, with a larger sampled spatial region, finding a similar result. However, the explanation to this peculiar distribution was found more simple, since the quasars seem not to be in the center of the overdensities of galaxies. Once corrected for the correct overdensity centers, the two-component distribution blurs, and a typical cluster overdensity profile remains.
We present here deep -band images of fields of 66 around the seven radio quasars studied in Paper I (Section 2). We have looked for possible overdensities of galaxies also in this band (Section 3), and, together with the and data, we have selected a sample of candidates to cluster members (Section 4). We have tried to find if the results presented in Paper I could be confirmed with these new data. The combined , and band data for the different galaxies detected have been used to study the characteristics of these cluster candidates (Section 5). Throughout this article we have assumed a standard cosmology with Ho=50 km s-1 Mpc-1 and qo=0.5. It is interesting to note here that at the redshift range considered in this article the differences in the scales were small (10%) if we use a cosmology with Ho=70 kms-1 Mpc-1 =0.3 and =0.7.
2 Observations, reduction and photometry
Deep NIR images of the 7 quasars studied here have been obtained in the night February the 3th 1999 at the 3.5m telescope of the Centro Astronómico Hispano-Alemán of Calar Alto. The data were obtained using Omega Prime, with a pixel scale of 0.396/pixel, and a field-of-view of 6’6’. A standard NIR observing procedure was used: 25 unregistered exposures of 4 seconds each were taken and the average image was registered. A number of 9 average images were obtained following a grid pattern around the object central position, with an offset of 35 arcseconds. Both the target and the photometric standards were observed using the same procedure. The whole procedure was repeated three times, which allowed a total exposure time of 2700s. Omega is an array of 10241024 pixels, formed by 4 arrays of 512512 pixels. In order to avoid the posibility that the QSO image lies in the junction of the different arrays, we have off-centered the image 30 North-West.
The data were reduced using standard IRAF packages. First, a dark frame, obtained before each sequence of exposures along the grid, was subtracted to each registered image. Domeflats were obtained as suggested by the Omega (and Magic) observer’s manual. The sky-flux frame was then obtained for each sequence of 9 images, averaging them. The flux from astronomical sources was masked by a 1 clipping rejection over the mean value. The sky-flux frame was subtracted to each of the images of the sequence. Once sky subtracted, the images of each sequence were recentred and co-added. When more than one sequence was obtained for a certain object, we recentred and coadded all the sequences to obtain the final image.
All the images were obtained in good photometric conditions. Flux calibration for each night was carried out using UKIRT faint standard stars observed along the night. The error of the photometric calibration was about 0.09 mag, the mean 3 limiting surface brightness was 21.0 mag/arcsec2, and the mean seeing was 1.3.
3 Analysis of the data
3.1 Detection of galaxies
Searching galaxies over the images were made using the SExtractor program (Bertín & Arnauts 1996). This program detects and split objects up to a certain flux limit over the local sky background (ie, in each object environment), producing a catalogue of objects with their main properties. This catalogue includes the position, ellipticity, effective surface brightness, magnitude and a classification parameter (star/galaxy), for each detected object. The objects were classified by a neural network which takes as input parameters 8 areas determined by the same number of isophotes, similar for every object, the intensity peak and the FWHM, together with the seeing , defined as the mean FHWM of the stellar images. This neural network determines the so-called stellar index, which is, by definition, 0 for the galaxies and 1 for the stars. In practice a value of 0.7 works fine to split galaxies from stars.
The detection area and significance detection limit were fixed to be similar to values used in Paper I, being 1.4 arcsec2 and 4.5, respectively. We have used a different number of connected pixels and detection limit per pixel in present study due to the differences in pixel size in optical and NIR images. The detection process was done looking for 9 connected pixels with a flux per pixel up to 1.5. Once the objects near the border of the images, near clear foreground galaxies and dead regions of the detector were masked, we got the final catalogues. The mean magnitude of the faintest detected objects field by field were =20.30.3 (=25.60.4 and =24.80.3, for the optical images).
The parameter to determine the depth of a certain image is the 3 limiting magnitude for the detection area. This magnitude can be estimated determining the standard deviation of the sky background flux in the detection area, which yields =20.50.12 for the studied images. This limit implies a 4.5 detection limit of 20.1 mag, consistent with the mean magnitude of the faintest detected objects. This a good test of the consistency of the detection method.
This limiting magnitude is similar to the presented in other studies of cluster of galaxies at similar redshifts and wavelenghts. E.g., Tanaka et al. (2000) presented a study of the overdensities of galaxies around the radio quasar B2 1335+28 at =1.1, finding a possible cluster of galaxies at the redshift of the object. The faintest detected galaxies in the band on that study have 20 mag.
| Mag. Range | Nexp | |
|---|---|---|
| all | 5.412.33 | 1.000.15 |
| 19 | 3.621.95 | 1.030.14 |
| 18 | 1.801.41 | 1.050.12 |
| 17 | 0.600.68 | 0.880.07 |
| 16 | 0.170.38 | 0.920.06 |
| 15 | 0.030.18 | 0.990.04 |
3.2 Number counts
An appropiate determination of the number of field galaxies and its standard deviation is fundamental for a correct detection of excess of galaxies and its significance. As discussed in Paper I, galaxies tend to cluster which makes the standard deviation of number counts to depend not only in this number (like in a poisson distribution, =). Therefore, the standard deviation depends on the number of galaxies, , and the angular scale, , which can be expressed as =. The factor reflects the two point correlation and depends on the angular scale, since it is expected that there were no angular correlation at all scales. This factor tends to 1 at large scales (Yee & Green 1987), which corresponds to the poisson distribution.
Both the number of field galaxies or number counts and the standard deviation were determined directly on the images, comparing latter with similar results from the literature. We have counted the number of galaxies in a grid of 25 not overlapping circular areas of r=35 arcsec (1.1arcmin2). This angular scale corresponds to 0.5Mpc at the mean quasar redshift. To minimize possible contaminations from cluster members, we have used only the measurements of areas at more than 70 arcsec (1Mpc) from the quasars. With this method we got 16 measurements of the number of galaxies for each field, and a total of 112 measurements, which yields a good estimation of both the number of galaxies and the factor . As we explained in Paper I, this method does not guarantee that there were no contaminations from putative clusters. However, any possible contamination would produce an increase of both the estimated number of field galaxies and the factor and, therefore, they would reduce the significance of the possible excesses.
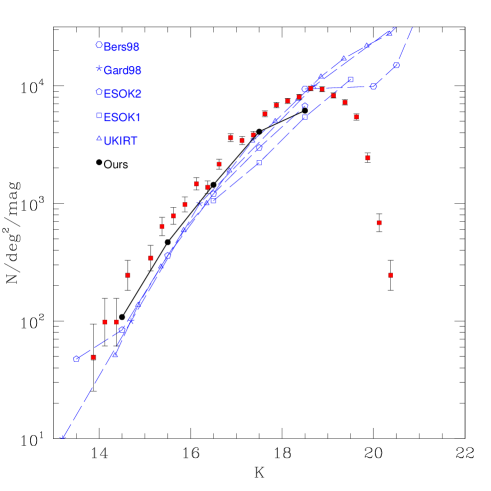
Table 1 lists the estimated number of field galaxies per circular area of 1.07 arcmin2 at different magnitude ranges (Nexp), together with the factor . This value, near to 1, is similar to the value found on the optical images (1.08, Paper I). Figure 1 shows the distribution of number counts of field galaxies for different -band ranges (solid circles), together with different estimations extracted from litetature. We have also plotted the total number of detected galaxies in the different fields, scaled to one square degree area (solid circles). It is seen that there is a clear excess of galaxies down to 19 mag, using both our estimated number counts and values from the literature. This excess will be discussed below. The slope of this distribution is 0.45 in the range of magnitudes 14.5K18.5 (similar to values found in Paper I for and band, 0.37 and 0.49, respectively). The 100% completeness magnitude, defined as the magnitude where the distribution deviates from the power law, was 19 mag. This magnitude corresponds to objects detected with a signal-to-noise ratio of 30, i.e., with photometric errors down to 0.03 mag. Both the number of field galaxies, its distribution along the magnitude range and its slope agree with previous results published in literature (Sarocco et al. 1997: ESO K1 and K2; Gardner et al. 1998; Bershady et al. 1998; Hall et al. 1998:UKIRT). However, there are small differences in the estimated number counts from different authors, as it is seen in Figure 1. These differences are mainly due to different image quality (different seeing, photometric conditions… etc), small differences in the transmission of the filters, and the use of different method for the detection and classification of the objects (Hintzen et al. 1991; Kron 1980). These are the main reasons to use number counts estimated from the same images where the excess of galaxies would be studied.
3.3 Excess of galaxies
As we quoted above, in Paper I we found an excess of galaxies around the radio quasars studied also in the present article using deep and images. This excess, significant for both bands, had a clear dependence with the magnitude range, being stronger for the faintest range of magnitudes (up to 3 for 22 and 22.5), which induced us to think that it was due to galaxies at the redshift of the quasar. The peak of the excess was not found nearby the QSOs, but at a certain distance (70, 1Mpc). In order to confirm/reinforce this result we have repeated the analysis over the new -band images.
We have measured the number of galaxies in two different angular scales around the quasars, all the image (which correspond to an angular scale of 170), and nearby the QSOs, 35, and at different magnitude ranges. The number of galaxies found around each quasar was coadded and them it was compared with the expected number of galaxies. It was then splitted in groups by their ranges of magnitudes, down to the 100% completeness magnitude, and an additional group for the galaxies faintest than this magnitude. It is important to note here that all the galaxies, even the galaxies fainter than this completeness magnitude, were detected with a signal-to-noise up to 4.5. Moreover, the number of expected galaxies were estimated from the same images, using the same detection/classification method, and therefore it was affected by the same incompleteness effects.
Table 2 lists the number of galaxies detected for both angular scales (35 and 170), the number of expected galaxies and significance of the excess, for each magnitude range and for all ranges (indicated as tot). It is seen that there is a significant excess of galaxies for the largest scale, and mainly for the range of magnitudes 19. The excess is less significant for the smallest scale, nearby the QSO. This is expected from results of Paper I, where we found that the peak of the excess was not at the QSO position. We will discuss this topic below.
Using present results and results from Paper I together, it seems that the excess is not due to foreground galaxies, since there is no significant excess of galaxies in the brightest ranges for the optical magnitudes, 21 and 22.5 (e.g., Benítez et al. 1995). The excess is most probably due to galaxies at the redshift of the quasars: (i) the mean optical-NIR colours of the excess galaxies are 4.5-6.5, assuming that they are the same galaxies in both bands, and (ii) at the mean redshift of the quasars (1.4), galaxies with magnitudes 22.5, 22.5 and 18 would have –18.6, –20.9 and –24.79, which are not unusual values (e.g., Bromley et al. 1998; Muriel et al. 1998; Mobasher et al. 1993). We have used typical -correction for elliptical galaxies, using the model (Bruzual 1983), with the GISSEL code (Bruzual & Charlot 1993), assuming a formation redshift of =5, and only one starburst period of 1Gyr, and a Salpeter initial mass function (Salpeter 1955), with a mass range between 0.1 and 125 M⊙. Furthermore, Hall & Green (1998) concluded that galaxies with 23 and colours 5 could be associated with quasars with a 1.5. Taking in account the proper conversion between and bands, these galaxies would have 22.3 and 4.3, values similar to those presented here.
|
a 1.0
In Paper I we found that, once corrected for the off-centering, the angular scale of the overdensity has a peak of 30-40 and a smooth excess until 160-170. If it is due to galaxies at the redshift of the quasars, the peak would be at 350 kpc, extending down to 1500 kpc. These scales were compatible with physical scales of well known clusters at lower redshifts (e.g. Dressler 1980; Ellingson et al. 1991). The overdensity is due to 20-40 galaxies for each field, which would correspond to not very dense clusters, with an Abell richness between 0 and 1 (Abell 1958). In summary, magnitudes, colours, physical scales and number of galaxies are compatible with clusters of galaxies at the redshift of the QSOs.
4 Colours of the excess galaxies
4.1 Distribution of galaxies in ranges of colours
The overdensity found in previous section and Paper I was mainly due to galaxies with magnitudes 22.5, 22 and 16-18. If these galaxies are the same for all the bands, their mean colours were 0.5 and 4-6. The colours are compatible with a population of old galaxies, similar to well known early-type galaxies that dominate cluster population, at least down to 1.3 (Visvanathan & Sandage 1977; Bower et al. 1992; Aragón-Salamanca et al. 1993; Kodama & Arimoto 1997). However, even in the case that the colours are considered a lower limit (since the number of detected galaxies was lower in than in , Paper I), we have to admit that a fraction of these galaxies deviate from pasive evolution, formed at lower redshifts or/and present a starformation process at recent epochs.
In order to determine the range of colours of the galaxies that produces the excess, we have made an analysis similar to the previous one: (i) estimate the number of expected galaxies at different colour ranges, and (ii) look for overdensities at 170 from the QSO, for these colour ranges. It is needed to cross-correlate the different catalogues of galaxies for each band, to produce a unique catalogue that includes both the , and band magnitudes. This would reduce the sampled region to 55.4, due to the above mentioned off-centering of the QSOs in the NIR band images.
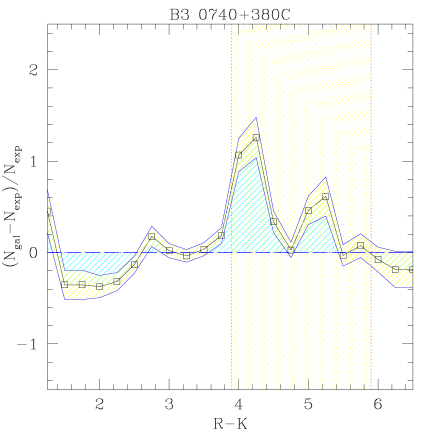
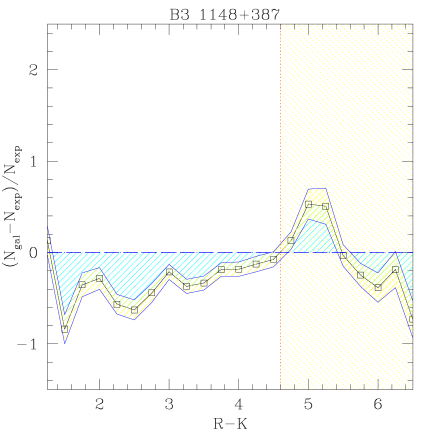
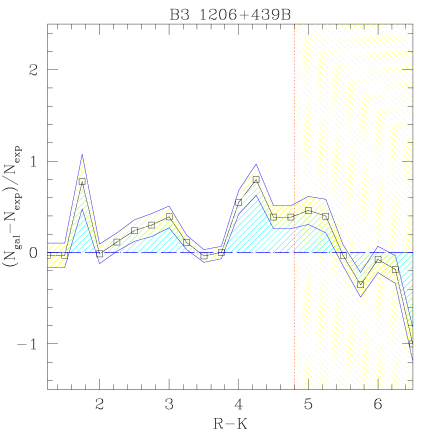
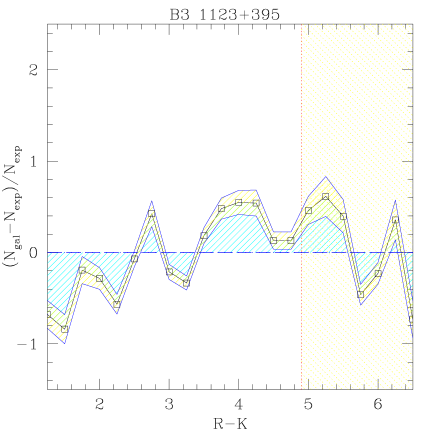
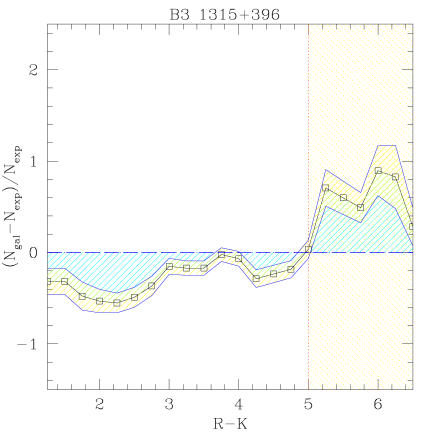
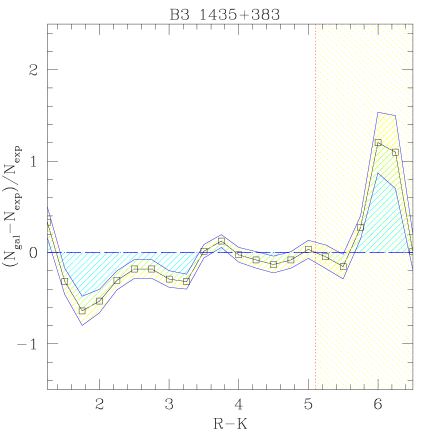
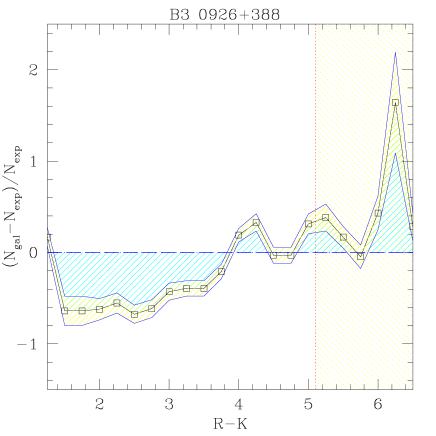
Figure 2 shows the distribution of relative excess of galaxies for the different colour ranges. The range of expected colours for old elliptical galaxies (4.5) at the redshift of the QSOs has been represented by a shaded vertical band. It is seen that the excesses present at least a peak within the range of these colours, and for 5 of the 7 fields, the excess is only found within this region. The observed defects could be due to differences in the mean colour distribution, field-to-field, combined with the different depth, band-to-band. However, these figures are a good estimate of the distribution of excesses at different ranges of colours. These results show that the excesses were due to galaxies which optical-NIR colours are compatible with being old galaxies at the redshift of the quasars. A similar analysis was used by Tanaka et al. (2000) to determine the existence of a cluster around a quasar at 1.1. Although spectroscopical confirmation is needed, our data indicate a similar result.
For 2 of the 7 fields the excess extends to bluer values than expected. Excesses partially due to galaxies at redshifts lower than the quasar redshift could explain this result. Another possibility could be the presence of blue galaxies in the cluster around the quasar. Tanaka et al. (2000) studied the objects around a quasar at 1.1, using broad-band images together with narrow band images ([OII]3727Å, centered at the quasar redshift), from Hutchings et al. (1993), finding a cluster at the quasar redshift. They found that the distribution was wider than expected for a sample of old elliptical galaxies, indicating a recent star formation, possible due to a collision process. Butcher & Oemler (1978,1984) observed that the optical colours of cluster galaxies tend to bluer with the redshift. This effect, known as the Butcher-Oemler effect, has been found in a large number of clusters at low redshifts. Our results, like Tanaka et al. (2000), could be the extension of this effect to beyond 1.
4.2 Colour-Magnitude relation
It is well known that there is a relation between the optical-NIR colours and the NIR magnitudes for the cluster galaxies, compatible with a population of old galaxies (e.g., Stanford et al. 1998; Kodoma et al. 1998). The slope of this relation is constant along a wide range of redshifts, 0.021.27, and there is evidence that it remains constant at higher redshifts (López-Cruz 1997; Kodoma et al. 1998). This limits significantly the formation redshift of the bulk of stars up to 2.5. It is necessary to note here that recent studies analyzed more exotic models, where the cluster members do not form at the same redshift, but this depends on the the galaxy luminosity (Ferreras et al. 1999; Ferreras & Silk 2000). This process could produce a conspiracy in which the observational results were the same. We do not attempt to determine the physic nature of this relation in present study, but it is necessary to note here that any model predict the existence of this relation.
The best situation to determine if the excess galaxies constitute a cluster would be to know the redshift, spectroscopic or at least photometric one. We could not afford an adequate photometric redshift estimation with the present data. Instead, we used the CM relation to select a sample of cluster candidates, and study their properties. This procedure have an inherent misclassification, including in cluster candidates galaxies that do not belong to the cluster, and excluding cluster members. Taking into account results from Figure 2, we extimated that the fraction of missclassified objects would be lower than 20%. This fraction could be larger for the fields around B3 1206+439B and B3 1123+395, in case of a the presence of a population of blue galaxies, similar to found by Tanaka et al. (2000). To select only the red galaxies (around the CM relation), could be considered as a conservative selection.
It would be interesting to test if it is possible to resconstruct the CM relation for our clusters, before making the proposed selection. We have followed the procedure proposed by Tanaka et al. (2000), used to reconstruct the CM relation for a cluster at 1.1. This procedure was based on the assumption that the CM correlation were due to bulk formation of the cluster population at a certain redshift (at least 2.5), and its slope was due to the relation between the galaxy metallicity and luminosity/mass (Kodoma & Arimoto 1997; Ferreras & Silk 2000). Therefore, the galaxies that produce this relation should be old, red in both the optical and optical-NIR colours, and faint in the optical bands.


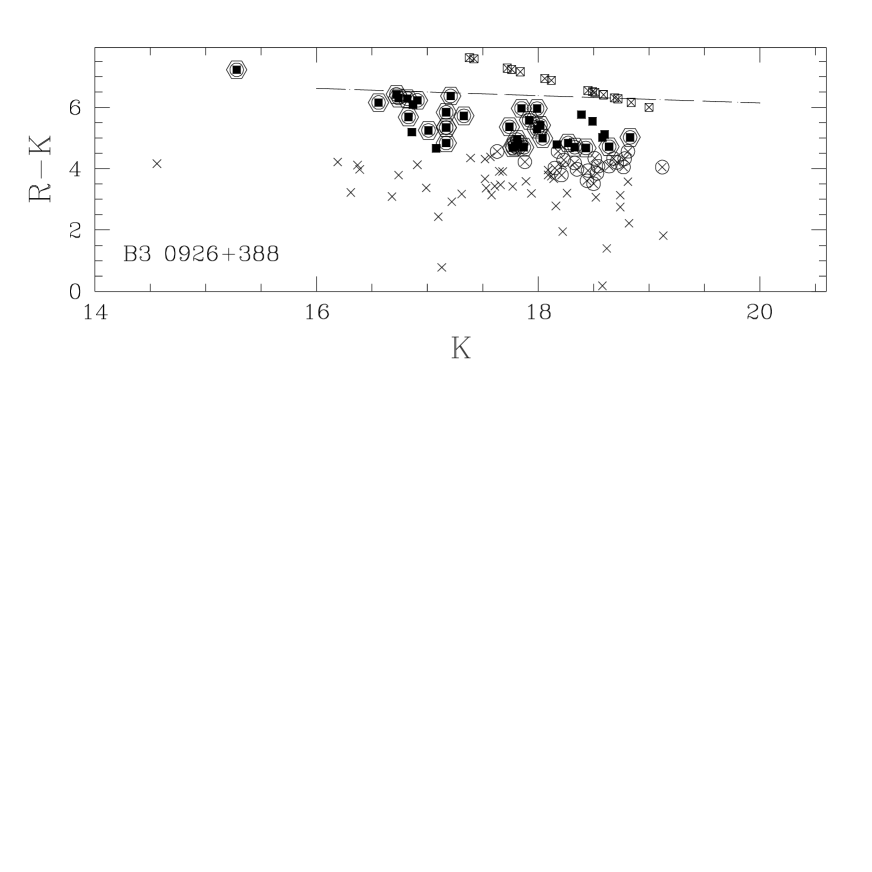
Figure 3 shows the distribution of the colours versus the -band magnitude for the galaxies detected in each field. The discontinous line shows the expected CM relation for a bulk of galaxies formed at 10, assuming a passive evolution (Bruzual-Charlot -model, =1Gyr, =10, initial mass function from Salpeter between 0.1 and 125 M⊙), with a constant slope. The was selected to match the zero-points of the CM relation of a sample of spectrocopically confirmed clusters, with a range of redshifts between 0.2-1.3 (Kodoma et al. 1998). Open squares show objects detected in but not in band ( lower limit). Solid squares show the galaxies with colours less than 1.5 mag from the expected CM relation, i.e., candidates to be cluster members. Open circles show faint galaxies with red colours in the optical bands (23.5, 22, 1.5), and from them, open hexagons show the galaxies with red optical-NIR colours (4.5). As we discussed above, the CM relation should be produced by this last group.
It is seen in Figure 3 that open circles conform an upper envelope in the colour-magnitude diagram, which traces the the expected CM relation. The hexagons (old galaxies, without recent star formation) reproduce this relation more accurately, although the dispersion is larger than found in lower redshift samples (Aragón-Salamanca 1993; Stanford et al. 1997). The fact that it is possible to reconstruct the red sequence support our adopted procedure to select a sample of cluster candidates.
The relation shows a larger dispersion for the fields around the quasars with highest redshifts (Fig. 3). This increase of the dispersion could be due to three main causes: (a) an increase of the contamination from field galaxies, extimated to be as large as a 20%, (b) an increase of the photometric errors of and magnitudes, stronger for the faintest galaxies, which ranges between 0.14–0.42 magnitudes, (c) an intrinsic increase of the dispersion. It is clear that our data are affected by (a) and (b), which could produce the observed increase. However, (c) has to be taken in account as well: (i) if the CM relation is due to bulk formation of the cluster population, an increase of the dispersion towards higher redshifts would be expected (if we assume a range of 2.5–5, at =1.6 we are at 0.4–1 Gyr from the formation time), (ii) in case of latter starformation process (Tanaka et al. 2000; Haines et al. 2001), an increase of the dispersion is also expected. It is needed to reduce at maximum the effects of (a) and (b) to determine the quantative contribution of (c) to the observed increase of the dispersion.
5 Properties of cluster candidates
5.1 colour distribution
The number of galaxies selected to be cluster candidates using the above described procedure ranges between 40 and 47 for each field. This number is similar to the number of galaxies that produces the excess field-to-field, which ranges between 30 and 40. Furthermore, the differences between both numbers is 20%, which is the extimated fraction of misclassified galaxies.
Only a fraction between 15% and 41% of the galaxies selected from their colours were detected in the band. The -band images were less deep than the -band, therefore only the bluer galaxies with 1.5 mag of cluster candidates were detected in this band. These galaxies form a population of red galaxies in the optical-NIR range (4.5) and blue in the ultraviolet range (1.5, 1760Å-2200Å at 1.5). This population has been found before in other clusters at similar redshifts (Tanaka et al. 2000; Haines et al. 2001).
Figure 4 shows the and colour distribution versus the redshift for two different evolution models: (i) passive evolution, with three different formation redshifts (=2.5,4 and 10), black lines, and (ii) a second model in which the bulk of the galaxy follows passive evolution (the previous model, with =10), but with a fraction of the mass showing more recent star formation. The dashed line shows the result for a fraction of 5% under star formation, while the shaded region traces the evolution when this fraction reduces from 5% to 0% (i.e., passive evolution). Solid squares show the zero points of the CM relation for spectroscopically confirmed clusters with a redshift range between =0.3 and 1.3 (Kodoma et al. 1998). It is seen that passive evolution models with high formation redshifts (4), describe the observational data accurately. The zero points of CM relation from our cluster candidates are shown as solid circles. As they were selected based on this CM relation, it is expected that they fit quite well with a passive evolution model for old galaxies.
We have plotted the mean colours of candidate galaxies as open stars. The colours present an evolution compatible with old elliptical galaxies, whereas the are clearly bluer. It should be noted here that the colours are a lower limit, since we have detected only a fraction of the candidates in the -band images. Therefore, the range of colour is expected to be wider, from plotted data to values expected for old elliptical galaxies. A first conclusion that could be extracted from Figure 4 is that the observed distribution rejects the possibility of a young population formed at low redshifts (3). Although the colours of some galaxies (25%) were compatible with this hypothesis, their colours are clearly redder than expected.
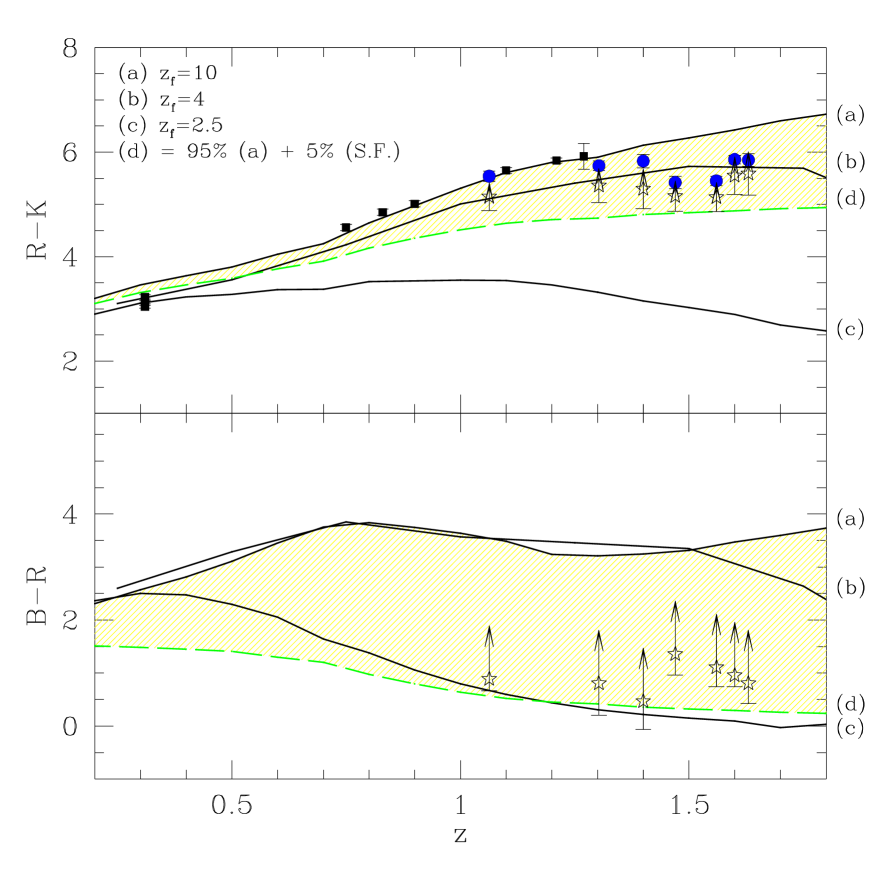
A pure passive evolution model, with galaxies formed at 2.5, cannot explain the data either. Although the colours fit accurately to this model, the observer range of colours from those galaxies detected at does not agree with it. Only a mixed model, where clusters present recent star formation, could explain the observed data. With a reduced fraction of the galaxy mass under starformation (5%), juxtaposed to passively evolving population, it is possible to describe the observed data. It is needed to note here that the mixed model does not mean that 5% of the cluster galaxies were formed at lower redshifts. In that case, the dispersion of the colours would be larger than observed. What we found is that clusters contain a population of old elliptical galaxies, and a fraction of them (25%) has undergone recent star formation including 5% of their masses.
Haines et al. (2001) and Tanaka et al. (2000) presented similar results for two clusters at 1.3 and 1.1, respectively. They found a larger fraction (50%) of red galaxies with ultraviolet excess compared with 10-40% on our clusters, but their physical interpretation was similar. Our estimation of the fraction of blue galaxies is similar to those found in clusters at 0.9 (Postman et al. 1998a; Lubin et al. 1998; Racos & Schombert 1998), but larger than the fraction of these objects found at lower redshifts, 0.2 (Smail et al. 1998). Spectroscopic studies of clusters at 0.3–0.5, have shown that there is a significant fraction of galaxies in post star formation periods (e.g., Dressler & Gunn 1992; Couch et al. 1994, 1998; Poggianti et al. 1999). It seems that these galaxies has undergone star formation at higher redshifts, and they could be the fossils of the galaxies with ultraviolet excess found in higher clusters.
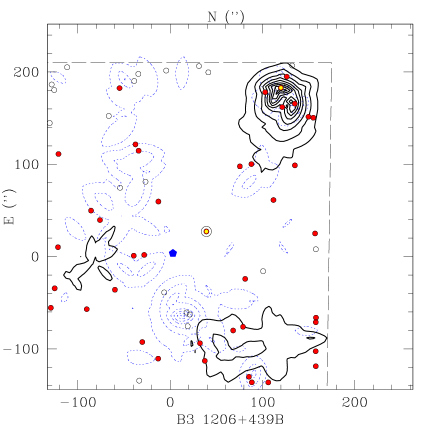
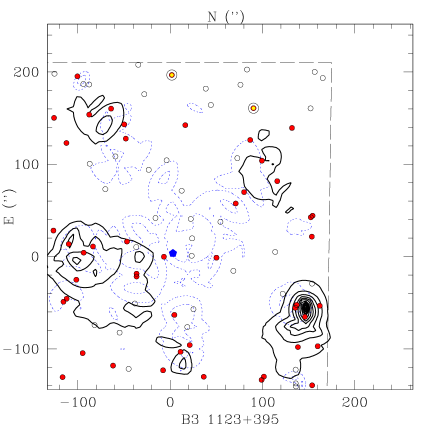
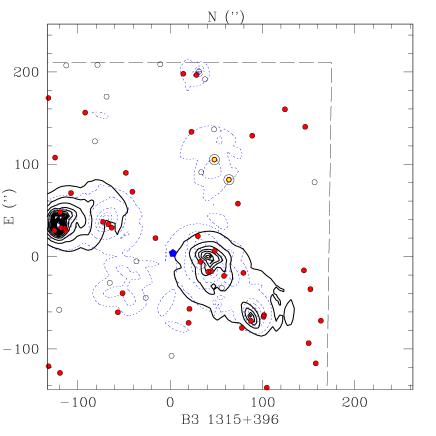
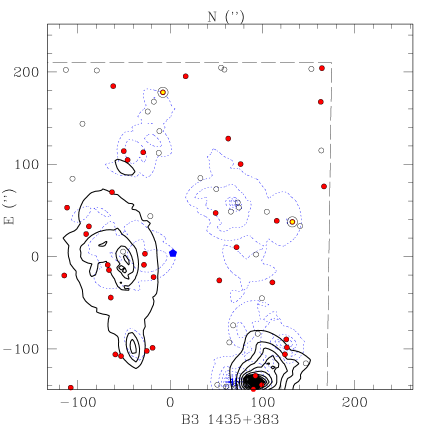
5.2 Spatial distribution
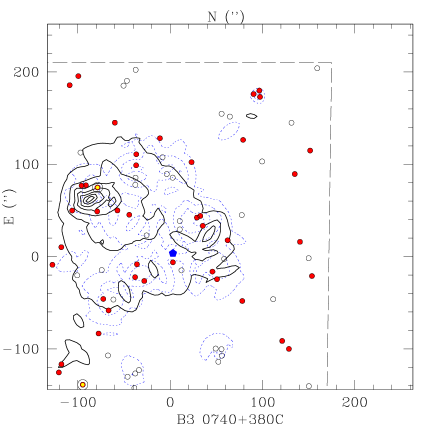
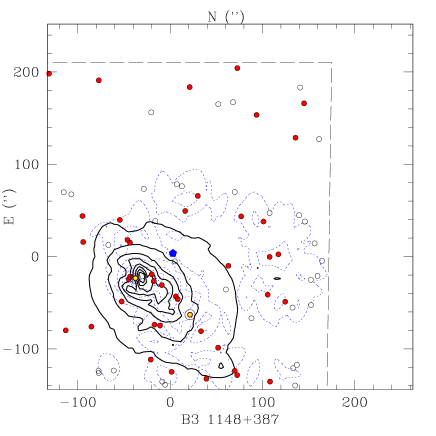
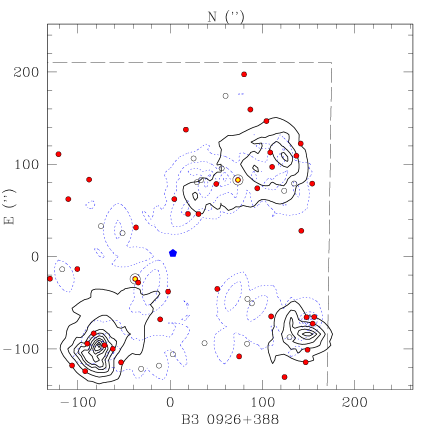
Figure 5 shows, for each field, the bidimensional spatial distribution of the galaxies selected as cluster candidates (solid circles), together with galaxies detected in but not in band (open circles). A fraction of this latter group could be also members of the clusters (Figure 3). We have also plotted in Figure 5 an estimation of the cluster density, determined using the variable kernel method (used in Paper I; Silverman 1986) with the Epanechnikov kernel (Epanechnikov 1969). This method is an improvement of the nearest neighbour method, matching the smoothing factor to the local density for each point. The density estimation generally used is based in the number of objects counted in a certain box of fix size, centered in the interest point. However, the estimator used here is inversely proportional to the area needed to contain a certain number of observables, (galaxies in our case), and inversely proportional to a smoothing parameter . The number of observables was fixed to mean galaxy density for each image. This density estimation reflects the properties of the distribution better than the more extended used procedure (read discussion on Silverman 1986).
The density estimation of candidate galaxies is shown as a continous contour, whereas the density estimation for all the galaxies plotted in figure (solid circles and open circles) is shown as a dotted contour. The quasar position is indicated with a pentagone, and the two brighest galaxies in each field with two concentric open and solid circles. Figures are centered on the field-of-view of -band images, showing the dashed lines the limit of the overlapping region with optical images (i.e., the region sampled by , and band images).
As we found in Paper I for the overdensities of galaxies in the optical images, the quasars are not located in the center of the clusters, but at 100 far from them (1Mpc at the mean redshift of the quasars). This off-centering is observed for the distribution of the cluster candidates, even including the galaxies not detected in the band. The peaks of both samples match only for the two quasars at lowest redshift, for which the density shows a 3 unique peak, being similar to the spatial distribution of well known low- clusters. For the remaining fields at higher redshift, the distribution is more similar to groups of galaxies or proto-clusters than totally assembled clusters. All of them shows a peak up to 6 that can be considered as the center of the cluster. The radial profiles of the density around these peaks fit to a King model, with core radii ranging between 202 kpcrc850 kpc, and a mean value of rc570 kpc. This result reinforces our suspicion that we have found clusters (or proto-clusters) at the redshift of the quasars.
The fact that quasars do not inhabit the more dense regions of the clusters (core) agrees with the hypothesis of a merging process as the origin/feeding mechanism of the nuclear activity. Aarseth & Fall (1980) demonstrated that for merging process to work, velocities at encounters between galaxies should not exceed significantly their internal velocity (200 km s-1). Similarly, Bekki & Noguchi (1994) demonstrated using simulations that the upper limit to the relative velocity of the gas clouds of galaxies that collide should be 600 km s-1 to allow these clouds to concentrate within 10 kpc, once the collision takes place. This is a first condition to allow these clouds to feed the AGN. This implies that in cluster cores (where velocity of galaxies is 600 km s-1) the merging processes due to collisions were less efficient than in the outer regions of the clusters, where the velocity of galaxies decreases. Similar results have been found by other authors at similar redshift ranges (Haines et al. 2001; Tanaka et al. 2000; Thompson et al. 2000; Nakata et al. 2001). The differences in populations of galaxies at the core and outer regions of clusters (with a larger fraction of gas rich galaxies) could play a role in this process.
In Figure 5 we have indicated the position of the two brightest cluster galaxies (BGC) as concentric open and solid circles (using -band magnitudes). In four of the seven fields one of these two galaxies inhabits regions close to the core of the cluster, three of them are the lowest redshift objects. Similar features have been found in well known low- clusters, where it is usual to find a cD galaxy in the cluster core. We have not found this effect on the fields at highest redshifts, even in the case that we take in account the galaxies not detected in the band. This result, together with the lack of uniformity in their spatial distribution, could indicate an evolution of structure. However, a spectroscopic confirmation of the cluster candidates, and a study over larger, statistically significant samples is needed before a firm conclusion can be made.
6 Discussion and Conclusions
In this article we have analyzed deep -band images around seven radio loud quasars, with a redshift range 11.6. In Paper I, we presented the analysis over deep and band images around the same quasars. Using the present results together with the results from Paper I, we found that there is a significant excess of galaxies around these quasars, with magnitudes, colours, spatial scale and number of galaxies compatible with clusters of galaxies at the redshift of the quasars. This result agrees with previous studies of possible overdensities of galaxies around radio-loud quasars (Hintzen et al. 1991; Hall & Green 1998), in contrast with results obtained on similar studies over radio-quiet samples (Boyle & Couch 1993; Teplitz et al. 1999), although some of these studies found significant excesses around radio-quiet quasars (Haines et al. 2001). These results also agree with studies based on samples of lower redshift quasars, where the environment of radio-loud and radio-quiet quasars seem to present significant differences (Yee & Green 1987; Elligson et al. 1991).
There are different mechanisms that could explain the described differences: (i) it is expected that radio loud sources inhabit gas rich clusters, if the intracluster gas plays a substancial role as the fuel of the radio source. It is reasonable to assume that intracluster gas increases with cluster density, which could explain the differences in the environments of radio-loud and radio-quiet sources; (ii) extended radio emission, with steep-spectrum emission, is normally explained as the result of the interaction of the jets with the intergalactic medium (e.g. Miley 1980). This medium confines the radio emission lobes. It is expected that the intergalactic medium was denser in more populated clusters, and therefore, there could be a relation between cluster density and radio loudness. Maybe the combination of both mechanism is needed to explain the observed differences. It is interesting to note here that the second mechanism could explain the correlation between the excess of galaxies and the slope of radio emission found by Hall & Green (1998) and Mendes de Oliveira et al. (1998).
Two mechanisms have been proposed to explain the connection between nuclear activity and its environment: the dynamic state of the clusters and the evolution of intracluster gas (Yee & Ellingson 1993). In both schemes the merging/interaction processes between the host galaxy and its neighbours play a substancial role, which reinforce the hypothesis that a merging process could be the origin of nuclear activity (Barnes & Hernquist 1992; Shlosman 1994; Bekki 1999). There is ample evidence to support this idea, like the large fraction of host galaxies under possible interaction/merging processes, their large luminosities, and possible traces in their spectra (Hutchings 1987; Disney et al. 1995; Hutchings & Neff 1997; Carballo et al. 1998; Sánchez et al 2002; Nolan et al. 2001).
We found an envelope of red galaxies in the colour-magnitude diagram ( vs. ), using the combined information from the three bands. This envelope was consistent with the CM relation found for clusters with a redshift range between 0.31.3. Extrapolating this relation to the redshift range of our sample (interpolating in some cases) we selected a sample of cluster candidates. Among these galaxies selected as candidates by their and magnitudes, only 25% were detected in the band. This group of galaxies comprises a subsample of red galaxies with ultraviolet excess, similar to found by Tanaka et al. (2000) and Haines et al. (2001).
The colour evolution of the cluster candidates was compatible with a model in which the bulk of the galaxies follows a passive evolution typical of old galaxies (4-10), whereas a fraction of 25% follows a mixed evolution. This mixed evolution implies that at least 95% of the mass follows a passive evolution and a fraction lower than 5% has undergone presents star formation, even at the observation redshift. This star formation could be induced by collision processes (Lubin et al. 1998; Tanaka et al. 2000; Haines et al. 2001). Spectroscopic studies of these galaxies are needed to clarify these results.
We have found that the quasars of our sample do not inhabit the cluster cores. The position of the quasars in the clusters is also compatible with the hypothesis of a merging process as the QSO origin. Only collisions between galaxies with relative velocity similar to their internal velocity could induce merging. This merging was a prerequisite for the infall of mass into the inner region and the formation or feeding of the nuclear source. This limits the region where collisions could lead to merging to the outer region of the clusters, since the velocity were too large in the cluster cores.
Summarizing, out results suggest that radio-loud quasars inhabit the outer regions of low populated clusters at high redshift. Clusters that show mixed evolution, which main component would be passive evolution for old galaxies with a reduced fraction under a recent starformation process. These results support the hypothesis of a merging process as the origin/feeding mechanism of nuclear activity.
Acknowledgements.
We thank all Calar Alto observatory staff for the friendly support and the unestimable help during the observing runs. S.F.Sánchez thanks Danny Lennon (ING Head of the astronomy group) for its support his the realization of this research. We thank L. Wisotzki for his kind and unestimable help in the correction of the poor english of the first version of this article, and for his useful comments. We thank Dr. Stockton, who refereed this article, for valuable comments, which help to improve the present article. S.F.Sánchez would like to thank Eresmas S.A., and in particular to Mariano Tejedor, for their support with time and computers to finish this article. J.I. Gonzalez-Serrano wants to aknowledge financial support from DGESIC (Ministerio de Educacion y Cultura) under project PB98-0409-C02-02.References
- (1) Aarseth, S.J., Fall, S.M., 1980, ApJ, 236, 43
- (2) Abell, G.O., 1958, ApJS, 3, 211
- (3) Aragón-Salamanca, A., Ellis, R.S., Couch, W.J., Carter, D., 1993, MNRAS, 262, 764
- (4) Barnes, J.E., Hernquist, L., 1992, ARA&A, 30, 705
- (5) Bekki, K., Noguchi, M., 1994, A&A, 290, 7
- (6) Bekki, K., 1999 [astro-ph/9904044]
- (7) Benítez, N., Martínez-González, E., González-Serrano, J.I., Cayón, L., 1995, AJ, 109, 935
- (8) Bershady, M.A., Lowenthal, J.D., Koo, D.C., 1998, ApJ, 505, 50
- (9) Bertín, E., Arnouts, S., 1996, A&AS, 117, 393
- (10) Bower, R.G., Lucey, J.R., Ellis, R.S., 1992, MNRAS, 254, 601
- (11) Boyle, B.J., Couch, W.J., 1993, MNRAS, 264, 604
- (12) Bromley, B.C., Press, W.H., Lin, H. , Kirshner, R.P., 1998, ApJ, 505, 25
- (13) Bruzual, A.G., 1983, ApJ, 273, 105
- (14) Bruzual, A.G., Charlot, S., 1993, ApJ, 405, 558
- (15) Butcher, H., Oemler, A. Jr., 1978, ApJ, 226, 559
- (16) Butcher, H., Oemler, A. Jr., 1984, ApJ, 285, 426
- (17) Carballo, R., Sánchez, S.F., González-Serrano, J.I., Benn, C.R., Vigotti, M., 1998, AJ, 115, 1234
- (18) Cimatti, A., Villani, D., Pozzetti, L., di Serego Alighieri, S., 2000, MNRAS, 318, 453
- (19) Couch, W.J., Ellis, R.S., Sharples, R.M., Smail, I., 1994, ApJ, 430, 121
- (20) Couch, W.J., Barger, A.J., Smail, I., Ellis, R.S., Sharples, R.M., 1998, ApJ, 497, 188
- (21) Disney, M., Boyce, P.J., Blades, J.C. , et al., 1995, Nat , 376, 15
- (22) Dressler, A., 1980, ApJ, 236, 351
- (23) Dressler, A., Gunn, J.E., 1992, ApJS,78,1
- (24) Ellingson, E., Yee, H.K.C., Green, R.F., 1991, ApJ, 371, 49
- (25) Epanechnikov, V.A. , 1969, Theor. Probab. Appli. 14, 15
- (26) Ferreras, I., Silk, J., 2000, ApJ, 532, 193
- (27) Ferreras, I., Charlot, S., Silk, J., 1999, ApJ, 521, 81
- (28) Fisher, K.B., Bahcall, J.N., Kirkhakos, S., Schneider, D.P., 1996, ApJ, 468, 469
- (29) Gardner, P., 1998, PASP, 110, 291
- (30) Gehren, T., Fried, J., Wehinger, P.A., Wycoff, S., 1984, ApJ, 278, 11
- (31) Haines, C.P., Clowes, R.G., Campusano, L.E., Adamson, A.J., 2001, MNRAS, 323, 688
- (32) Hall, P.B., Green, R.F., 1998, ApJ, 507, 558
- (33) Hall, P.B., Green, R.F., Cohen M., 1998, ApJS, 119, 1
- (34) Hamabe, M., Kormendy, J., 1987, Structure and Dynamics of Elliptical Galaxies, IAU Symp. 127, p. 379, ed. de Zeeuw T., Reidel, Dordrecht
- (35) Heckman, T.M., Bothun, G.D., Balick, B., Smith E.P., 1984, AJ, 89, 958
- (36) Hintzen, P., 1984, ApJS, 55, 533
- (37) Hintzen, P., Romanishin, W., Valdes, F., 1991,ApJ, 366, 7
- (38) Hutchings, J.B., 1987, ApJ 320,122
- (39) Hutchings, J.B., Crampton, D., Campbell, b., 1984, ApJ, 280, 41
- (40) Hutchings, J.B., Crampton, D., Persram, D., 1993, AJ, 106, 1324
- (41) Hutchings, J.B., Neff, S.G., 1997, AJ, 113, 550
- (42) Kodama, T., Arimoto, N., 1997, A&A, 320, 41
- (43) Kodama, T., Arimoto, N., Barger, A.J., Aragón-Salamanca, A., 1998, A&A, 334, 99
- (44) Kron, R., 1980, ApJS, 43, 305
- (45) López-Cruz, O., 1997, PhD Thesis, Universidad de Toronto
- (46) Lubin, L.M., Postman, M., Oke, J.B., Ratnatunga, K.U., Gunn, J.E., Hoessel, J.G., Scheneider, D.P., 1998, AJ, 116, 584
- (47) Mendes de Oliveira, C. , Drory, N., Hopp, U., Bender, R., Saglia, R.P., 1998, Proceedings of the XIV IAP meeting, Wide field surveys in cosmology, Paris, Editions Frontieres, p. 169
- (48) Miley, G., 1980, ARA&A, 18, 165
- (49) Mobasher, B., Sharples, R.M., Ellis, R.S., 1993, MNRAS, 263, 560
- (50) Muriel, H., Valotto, C.A., Lambas, D.G., 1998, ApJ, 506, 540
- (51) Nakata, F., Kajisawa, M., Yamada, T., Kodama, T., Shimasaku, K., Tanaka, I., Doi, M., Furusawa, H., Hamabe, M., Iye, M., Kimura, M., Komiyama, Y., Miyazaki, S., Okamura, S., Ouchi, M., Sasaki, T., Sekiguchi, M., Yagi, M., Yasuda, N., 2001, PASJ, 53, 1139
- (52) Nolan, L.A., Dunlop, J.S., Kukula, M.J., Hughes, D.H., Boroson, T., Jimenez, R., 2001, MNRAS, 323, 385
- (53) Poggianti, B.M., Smail, I., Dressler, A., Couch, W.J., Barger, A.J., Butcher, H., Ellis, R.S., Oemler, A., 1999, ApJ, 518, 576
- (54) Postman, M., Lubin, L.M., Oke, J.B., 1998a, AJ, 116, 560
- (55) Postman, M., Lauer, T.R., Szapudi, I. , Oegerle, W., 1998b, ApJ, 506, 33
- (56) Racos, K.D., Schombert, J.M., 1995, ApJ, 439, 47
- (57) Salpeter, E.E., 1955, ApJ, 121, 161
- (58) S.F. Sánchez, 2001, PhD Thesis, Univ. of Cantabria.
- (59) Sánchez, S.F., González-Serrano, J.I., 1999, A&A, 352, 395
- (60) Sánchez, S.F., González-Serrano, J.I., Benn, C.R., 2002, in preparation
- (61) Sarocco, P., Iovino, A., Garilli, B., Maccagni, D., Chincarini, G., 1997, AJ, 114, 887 [ESO K1,K2]
- (62) Shlosman, I., ed. 1994, Mass-Transfer Induced Activity in Galaxies (New York: Cambridge Univ. Press)
- (63) Silverman, B.W., 1986, Density estimation for statistics and data analysis, monograph on statistics and applied probability (London: Chapman and Hall)
- (64) Smail, I., Edge, A.C., Ellis, R.S., Blandford, R.D., 1998, MNRAS, 293, 124
- (65) Stanford, S.A., Elston, R., Eisenhardt, P.R.M., Spinrad, H., Stern, D., Dey, A., 1997, AJ, 114, 2232
- (66) Stanford, S.A., Eisenhardt, P.R., Dickinson, M., 1998, ApJ, 492, 461
- (67) Stockton, A., 1982, ApJ, 257, 33
- (68) Tanaka, I., Yamada, T., Aragón-Salamanca, A., Kodama, T., Miyaji, T., Ohta, K., Arimoto, N., 2000, ApJ, 528, 123
- (69) Teplitz, H.I., McLean, I.S., Malkan, M.A., 1999, ApJ, 520, 469
- (70) Thompson, D., Aftreth, O., Soifer, B.T., 2000, AJ, 120, 2331
- (71) Visvanathan, N., Sandage, A., 1977, ApJ, 216, 214
- (72) Wold, M., Lacy, M., Lilje, P.B.& Serjeant, S., 2000, MNRAS, 316, 267
- (73) Yamada, T, Tanaka, I., Aragón-Salamanca, A., et al., 1997, ApJ, 487, L125
- (74) Yee, H.K., 1987, AJ, 94, 1461
- (75) Yee, H.K., Ellingson, E., 1993, ApJ, 411, 43
- (76) Yee ,H.K., Green, R.F., 1984, ApJ, 280, 79
- (77) Yee, H.K., Green, R.F., 1987, ApJ, 319, 28