Cooling of Neutron Stars: Two Types of Triplet Neutron Pairing
Abstract
We consider cooling of neutron stars (NSs) with superfluid cores composed of neutrons, protons, and electrons (assuming singlet-state pairing of protons, and triplet-state pairing of neutrons). We mainly focus on (nonstandard) triplet-state pairing of neutrons with the projection of the total angular momentum of Cooper pairs onto quantization axis. The specific feature of this pairing is that it leads to a power-law (nonexponential) reduction of the emissivity of the main neutrino processes by neutron superfluidity. For a wide range of neutron critical temperatures , the cooling of NSs with the superfluidity is either the same as the cooling with the superfluidity, considered in the majority of papers, or much faster. The cooling of NSs with density dependent critical temperatures and can be imitated by the cooling of the NSs with some effective critical temperatures and constant over NS cores. The hypothesis of strong neutron superfluidity with is inconsistent with current observations of thermal emission from NSs, but the hypothesis of weak neutron superfluidity of any type does not contradict to observations.
1 Introduction
The cooling of neutron stars (NSs) strongly depends on the properties of the matter in their cores, primarily on the equation of state for the matter (Lattimer and Prakash 2001) and on the critical temperatures of NS nucleon superfluidity (Lombardo and Schulze 2001). At present, both are known incompletely, because there is no reliable microscopic theory. The available knowledge about the properties of the matter in NS cores can be improved by comparing observational data with NS cooling models.
Here, we consider some cooling models. For definiteness, we assume the standard composition of NS cores: neutrons (n), protons (p), and electrons (e).
It is well known that the neutrons and protons in NS cores can be in a superfluid state (Yakovlev et al. 1999; Lombardo and Schulze 2001). Model calculations of superfluid gaps show that proton pairing takes place in the singlet state of the proton pair. Neutron pairing can take place in the singlet and triplet () states; singlet pairing generally arises in matter of moderate density ( , where g cm-3 is the nuclear density) and triplet pairing arises in denser matter. The triplet pairing, in turn, can be of several types that differ by the component of the total moment of the nucleon pair along the quantization axis (. Following the review articles by Yakovlev et al. (1999, 2001), we call the singlet pairing case , the triplet pairing with case , and the triplet pairing with case . Case stands out among the remaining cases in that the superfluid gap in the dispersion relation for neutrons becomes zero at some points of the Fermi surface (at its poles). This leads to a fundamentally different (power-law rather than exponential) dependence of the NS neutrino energy losses on the gap amplitude (Yakovlev et al. 1999). The type of superfluidity with a minimum free energy occurs in nature. The -type proton pairing in the NS core, the -type neutron pairing in the crust and in the outer core, and the -type pairing in the inner core are commonly considered in cooling calculations. The -type neutron pairing in the NS core seems less realistic, but it is not ruled out by current microscopic theories.
Up until now, virtually nobody has modeled the NS cooling with the -type neutron superfluidity. We know only the recent paper by Schaab et al. (1998), who attempted to take into account the effect of such pairing on the main processes of neutrino energy release in NS cores and on the NS cooling. Unfortunately, the authors failed to completely consider all of the factors that determine the thermal evolution of NSs. Thus, for example, when considering one of the most important neutrino processes, the neutrino emission during Cooper neutron pairing, the authors used an exponential dependence instead of the correct power-law dependence of the rate of energy release on ( is the critical neutron temperature).
Here, we analyze the NS cooling for the -type neutron pairing more rigorously. We compare the coolings for the - and -type superfluidities. Our results are compared with observations.
2 NS cooling for the -type neutron pairing
For the cooling to be adequately modeled, we must know the rate of neutrino energy release in superfluid NS interiors and the heat capacity of the NS matter. Recall that the main neutrino processes in NS cores are the direct Urca process, the modified Urca process, the nucleon-nucleon scattering reactions, and the Cooper pairing of nucleons. The first process, the most powerful mechanism of neutrino energy release, is a threshold process. The direct Urca process is open if , where and are the neutron and proton Fermi momenta, respectively.
The neutrino processes and heat capacity for cases , , and have been studied extensively. The results can be found in the review article by Yakovlev et al. (2001) and in Gusakov (2002). Yakovlev et al. (2001) considered the neutrino processes with the - or -type neutron and A-type proton superfluidities; they took into account the effect of the -type superfluidity on the direct Urca process, the neutrino energy release during Cooper neutron pairing, and the neutron heat capacity. Gusakov (2002) investigated the modified Urca process during the -type pairing and the - and -scattering reactions. He also rigorously took into account the effect of the combined - or -type nucleon superfluidity on the modified Urca process.
Here, we use the relativistic nonisothermal NS cooling code (see Yakovlev et al. 2001) adapted for the model with the -type neutron superfluidity. This code allows us to construct the cooling curves, i.e., to determine the dependence of the surface temperature of a star, , (recorded by a remote observer with allowance made for the gravitational redshift) on its age, . Following Kaminker et al. (2002), we use the equation of state by Negele and Vautherin (1973) in the NS crust and the equation of state by Prakash et al. (1988) in the NS core with the compression modulus MeV for symmetric nuclear matter at (model I from their paper for the symmetry energy). For this equation of state, the direct Urca process opens at g cm-3, i.e., at . In this case, the maximum NS mass is . In the cooling code used, the effective proton and neutron masses in the inner NS layers renormalized with allowance made for multiparticle effects were assumed to be 0.7 of the mass of the free particles. The relationship between the NS surface and internal temperatures was taken from Potekhin et al. (1997).
To better understand at which critical nucleon temperatures the -type neutron superfluidity in NS cores differs from case , we mentally replace the NS under consideration by a sphere with a radially constant density characteristic of this star. In that case, after the completion of thermal relaxation and before the beginning of the photon NS cooling stage, the time derivative of the internal NS temperature can be estimated as , where is the energy released in the form of neutrinos per unit volume per unit time and is the heat capacity per unit volume. This formula holds for both - and -type neutron superfluidities. Since the -type superfluidity suppresses the NS energy release more weakly and since the energy released via Cooper pairing is higher than that in case , we may say that always. Similarly, , therefore, it is not clear in advance which stars cool down faster: with the - or -type neutron superfluidity in the NS core. If we introduce the critical nucleon temperatures and for the characteristic density under consideration, then, depending on and , the function will be convenient for understanding when the cooling for cases and proceeds almost identically and when the differences are at a maximum.
Let us examine Fig. 1.
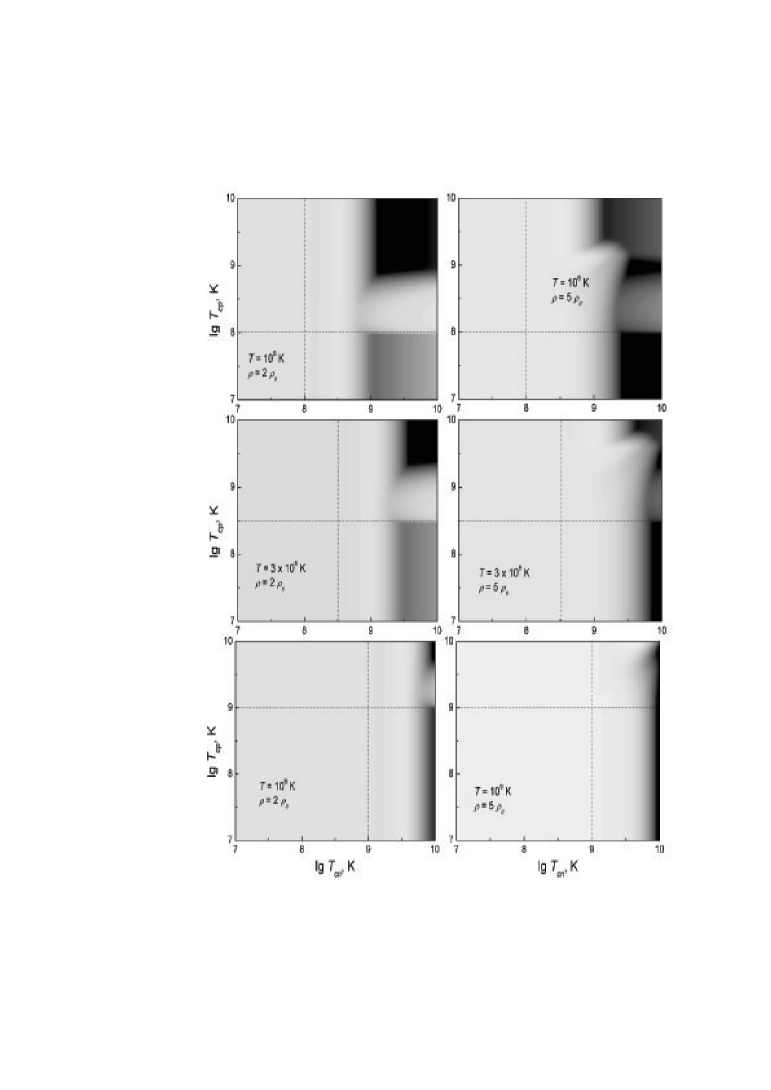
It consists of six pictures, each corresponding to a certain temperature (, , or K) and density (, or ). The direct Urca process is forbidden at and permitted at . Our calculations show that when the temperatures and densities are varied, the pictures do not change fundamentally until the threshold density at which the direct Urca process switches on (or off) is crossed. The logarithms of the critical proton and neutron temperatures at a fixed density are plotted along the vertical and horizontal axes of each picture, respectively. The critical nucleon temperatures lower than K (weak superfluidity) have virtually no effect on the NS cooling and, hence, are not considered. In the figure, the function is indicated by different shades of gray. The shade of gray for the region of critical temperatures to the left from the vertical dashed line (nonsuperfluid neutrons) corresponds to zero of this function. The darker is the shade of gray, the larger is . For example, for K, the maximum of this function reaches (6 – 7) for critical proton and neutron temperatures K at and (8 – 9) for K, K at . Conversely, the lighter is the shade of gray relative to the ’zero’ shade, the smaller is the function. The region with the shade of gray lighter than the ’zero’ shade is narrow and lies near . In this region, the minimum value of the function is of the order of –1 for both densities. A further increase in the internal NS temperature causes the differences between the - and -type neutron superfluidities to be smoothed out; the smoothing occurs faster for the densities at which the direct Urca process is open. Thus, for K, the maximum of is (3 – 3.5) for and (1 – 1.2) for , while its minimum is nearly zero for both densities. Summing up our results, we may say that the inequality holds for any , , , and . Therefore, one can hardly expect the NS cooling curve for case to pass well above the cooling curve for case (at fixed and ). Clearly, the reverse can be easily realized by an appropriate (see above) choice of critical temperatures.
Let us now turn directly to an examination of the NS cooling curves. For simplicity, the neutrons in the stellar crust are assumed to be nonsuperfluid. This assumption has no effect on the difference between the cooling curves for the - and -type neutron superfluidities in the NS core. Although the critical nucleon temperatures and are actually functions of the density and vary along the stellar radius, it was noticed that following certain semiempirical recipes, constant (over the core) critical temperatures can be matched to them. In this case, the cooling curves remain the same as if we took into account the exact dependence and (e.g., for protons, a constant effective temperature close to , where is the central density of the star, always corresponds to the temperature profile ). Therefore, for simplicity, we assume the critical nucleon temperatures to be density-independent.


Figures 2 – 5 show the cooling curves constructed for two NS masses: (Figs. 2 and 3) and (Figs. 4 and 5). The direct Urca process is forbidden for and permitted for . In Table 1 we give the various critical nucleon temperatures and for which the cooling curves were constructed.
| Number | 1 | 2 | 3 | 4 | 5 | 6 | 7 | 8 | 9 | 10 | 11 | 12 |
|---|---|---|---|---|---|---|---|---|---|---|---|---|
| , K | 2.5 | 5.0 | 10.0 | 3.2 | 0.2 | 0.5 | 7.0 | 0.85 | 9.5 | 0.2 | 0.1 | 5.0 |
| , K | 2.5 | 0.25 | 10.0 | 0.6 | 5.0 | 1.0 | 0.01 | 3.0 | 0.85 | 0.7 | 5.0 | 0.01 |
Each pair of critical temperatures in the table has its own number. In Figs. 2 – 6, the cooling curves are marked by these numbers. The letter or near the number specifies the type of neutron superfluidity. For example, means that the cooling curve was constructed for the -type neutron superfluidity for the critical temperatures and under number 3. We see from analysis of Figs. 2 – 5 that all our main conclusions drawn from an examination of Fig. 1 are confirmed. For , the largest differences are observed for the and curves in Fig. 2 (high critical temperatures). At critical proton temperatures K, the neutrino emission during Cooper proton pairing is the most powerful process in the NS core. Accordingly, the differences between the cooling curves for cases and decrease. This can be verified by comparing the and curves in Fig. 3. As the critical proton temperatures decrease to K and for K (but K), the differences again increase (the and curves in Fig. 2). When K and increases, the differences gradually decrease and the cooling curves for the - and -type neutron paring coincide for K. At moderately high critical temperatures K, the curves for case almost coincide with those for case (see, e.g., Fig. 3: and or and ). The kink in the and curves occurs at and stems from the fact that the neutrino emission due to Cooper neutron pairing switches on. Note that the critical temperatures of the and curves exactly fall within the region where the temperature for the -type neutron superfluidity decreases faster than that for case (). This actually leads to the fact that the curve initially passes slightly below the curve. Subsequently, as the internal temperature decreases, the situation is reversed, because we reach the regions with faster cooling for the -type superfluidity (see Fig. 1).
For , the differences are largest for the and curves in Fig. 4, i.e., at high critical neutron temperatures and at low critical proton temperatures. As decreases, the differences between the cooling curves for the - and -type superfluidities gradually disappear (see Fig. 4: and ; Fig. 5: and ). The remaining remarks almost completely repeat those for .
Our results can be of use in explaining observational data. The NS cooling with weak -type neutron superfluidity was considered by Kaminker et al. (2002). The authors showed that the available observational data on the thermal radiation from eight isolated NSs could be explained by assuming strong proton ( K) and weak neutron ( K) superfluidities. In this case, the critical temperatures and must depend on density [have a maximum at , as predicted by microscopic theories of superfluidity; see, e.g., Lombardo and Schulze (2001)]. The mechanisms of strong proton and weak neutron superfluidities are primarily needed to interpret the observations of two sources, RX J0822–43 (Zavlin et al. 1999) and PSR 1055–52 (gelman 1995), the hottest ones for their age. The observational data on these sources are shown in Fig. 6 [we took the same and as those used by Kaminker et al. (2002)]. Until recently, in addition to these two sources, yet another source, RX J185635–3754, must have been considered (Pons et al. 2002; Burwitz et al. 2001; Gnsicke et al. 2001; Kaplan et al. 2001). However, in the just published paper by Walter and Lattimer (2002), the age of RX J185635–3754 was revised (reduced by almost half) and is now estimated to be yr, which is attributable to a decrease in the distance to this source.
When comparing observations with cooling models, we should take into account the fact that the surface temperatures and ages of isolated cooling NSs are determined with a low accuracy [for the reasons discussed, e.g., by Pavlov and Zavlin (1998) and Yakovlev et al. (1999)]. The NS age is probably known to within a factor .
Since the determination of and is ambiguous, we can offer an interpretation of the observations alternative to that offered by Kaminker et al. (2002). More specifically, if we take the lowest possible values of and for PSR 1055–52, then the observations of the eight NSs considered by Kaminker et al. (2002) can be interpreted by assuming strong neutron superfluidity and weak proton superfluidity in the stellar cores. Although this interpretation is less plausible than that offered by Kaminker et al. (2002) (according to microscopic calculations of and , the triplet neutron pairing is generally weaker than the single proton pairing), it cannot be ruled out in advance and should be studied. It actually requires lower values of and of the fairly old and hot source PSR 1055–52, because strong neutron superfluidity significantly reduces the NS heat capacity and speeds up the NS cooling at the late photon cooling stage [implying that the models by Kaminker et al. (2002) can describe older and hotter sources].
A detailed discussion of the hypothesis of strong neutron superfluidity and weak proton superfluidity in NS cores is beyond the scope of this paper and will be given in our subsequent publication. Here, we only illustrate the possibility of this interpretation of observations for the two hottest sources (RX J0822–43 and PSR 1055-52) by using simplified models of cooling NSs with critical temperatures and constant over the stellar core. The dotted lines in Fig. 6 represent the cooling curves for K and K. For comparison, the dashed line was drawn for strong proton superfluidity and weak neutron superfluidity ( K, K). It virtually coincides with the cooling curve obtained by Kaminker et al. (2002) to interpret the above two sources. We see that the upper dotted line (-type neutron superfluidity) almost coincide with the dashed line for yr and passes slightly below the dashed line for yr (because of the above suppression of the neutron heat capacity by strong neutron superfluidity). Nevertheless, given the inaccurate determination of and , the upper dotted line could be assumed to satisfactorily explain these two sources. At the same time, the lower dotted line for strong -type neutron superfluidity passes well below (because of the weaker suppression of neutrino emission by the -type superfluidity) and cannot be considered to be acceptable. Therefore, the observations can (with the above reservations) be explained by strong -type neutron superfluidity but cannot be explained by the -type neutron superfluidity with the same K. With a further increase in , the upper dotted line would not change at all (strong -type neutron superfluidity with K almost completely switched off the neutrino reactions involving neutrons and made the neutron heat capacity equal to zero), while the lower dotted line would slowly approach the upper curve (the -type neutron superfluidity increasingly suppresses the neutrino luminosity and heat capacity), reaching it at K. Thus, the interpretation of the observations in the model of strong -type neutron superfluidity is possible in principle but is implausible, because it requires unrealistically high values of K.
3 Conclusions
The cooling of NSs with -type neutron superfluidity in their cores has been consistently studied for the first time. The critical nucleon temperatures were assumed to be constant over the stellar core. A comparison with -type neutron superfluidity was made. We found that the cooling curves for case can pass well below the cooling curves for case (faster cooling). Otherwise, the curves differ only slightly. The cooling with variable (over the core) critical temperatures and can generally be described by the cooling with some effective constant temperatures and .
The model with -type neutron superfluidity can account for the observational data on the thermal radiation from isolated NSs by assuming strong proton superfluidity ( K) and weak neutron superfluidity ( K). The interpretation of the observations in terms of the model with strong neutron superfluidity and with weak proton superfluidity ( K) is unlikely (in contrast to the same model for case ), because it requires too high critical neutron temperatures, K. Our results can be useful in understanding which type of superfluidity ( or ) occurs in nature.
4 Acknowledgments
One of the authors (MEG) is grateful to D.G. Yakovlev and A.D. Kaminker for helpful discussions and attention to the work. This study was supported in part by the Russian Foundation for Basic Research (project nos. 02-02-17668 and 00-07-90183).
References
- [1] Burwitz V., Zavlin V. E., Neuhuser R., Predehl P., Trmper J., and Brinkman A. C., Astron. Astrophys. Lett., 2001, v. 327, p. L35
- [2] Gnsicke B. T., Braje T. M., & Romani R. W., Astron. Astrophys., 2001, in press (astro-ph/0110130)
- [3] Gusakov M. E., Astron. Astrophys., 2002, v. 389, p. 702 (astro-ph/0204334)
- [4] Kaminker A. D., Yakovlev D. G., & Gnedin O. Y., Astron. Astrophys., 2002, v. 383, p. 1076
- [5] Kaplan D. L., van Kerkwijk M. H., & Anderson J., Astrophys. J., 2001, submitted (astro-ph/0111174)
- [6] Lattimer J. M. & Prakash M., Astrophys. J., 2001, v. 550, p. 426
- [7] Lombardo U. & Schulze H.-J., in Physics of Neutron Star Interiors, eds. D.Blaschke, N. Glendenning, A. Sedrakian (Springer, Berlin), 2001, p. 30
- [8] Negele J. W., & Vautherin D., Nucl. Phys. A, 1973, v. 207, p. 298
- [9] gelman H., in The Lives of Neutron Stars, 1995, eds. Alpar M. A., Kizilolu ., & van Paradijs J., NATO ASi Ser., (Kluwer, Dordrecht), p. 101
- [10] Pavlov G. G., & Zavlin V. E., in Neutron Stars and Pulsars, 1998, eds. Shibazaki N., Kawai N, Shibata S., & Kifune T., Universal Academy Press, Inc. (Tokyo), v. 24, p. 327
- [11] Pavlov G. G., Sanwal D., Garmire G. P., & Zavlin V. E., in Neutron Stars in Supernova Remnants, 2001, eds. Slane P. O., Gaensler B. M., ASP Conf. Ser., accepted (astro-ph/0112322)
- [12] Pons J., Walter F., Lattimer J., Neuhuser R., & An P., Astrophys. J., 2002, v. 564, p. 981
- [13] Potekhin A. Y., Chabrier G., & Yakovlev D. G., Astron. Astrophys, 1997, v. 323, p. 415
- [14] Prakash M., Ainsworth T. L., & Lattimer J. M., Phys. Rev. Lett. v. 61, p. 2518
- [15] Schaab Ch., Weber F., Weigel M. K., Astron. Astrophys., 1998, v. 335, p. 596
- [16] Walter F.M. & Lattimer J., Astrophys. Lett., submitted (astro-ph/0204199)
- [17] Yakovlev D. G., Kaminker A. D., Gnedin O. Y., & Haensel P., Phys. Rep., 2001, v. 354, p. 1
- [18] Yakovlev D. G., Levenfish K. P., and Shibanov Y. A., Physics - Uspekhi, 1999, v. 42, p. 737 (astro-ph/9906456)
- [19] Zavlin V. E., Trmper J., & Pavlov G. G., Astrophys. J., 1999, v. 525, p. 959