Abstract
We present results of an investigation of clustering evolution of field galaxies between a redshift of and the present epoch. The current analysis relies on a sample of galaxies in two fields of the COMBO 17 survey. The redshift distribution extends to . The amplitude of the three-dimensional correlation function can be estimated by means of the projected correlation function . The validity of the deprojection was tested on the Las Campanas Redshift Survey (LCRS). In a flat cosmology with non-zero cosmological constant for bright galaxies () the clustering growth is proportional to . However, the measured clustering evolution clearly depends on Hubble type. While locally the clustering strength of early type galaxies is equal to that of the bright galaxies, at high redshifts they are much stronger clustered, and thus the clustering has to evolve much more slowly.
keywords:
Cosmology: large scale structure – Galaxies: evolution[]Clustering evolution
between and today
1 COMBO 17
The COMBO 17 survey (Classifying Objects by Medium-Band Observations in 17 filters, see Wolf et al. 2002) has imaged of sky using the Wide Field Imager at the MPG/ESO 2.2-m telescope on La Silla. Each of the four fields has a size of . 17 optical filters filters have been observed, which facilitates a secure multicolor classification and redshift determination down to . Each galaxy is assigned a redshift and an (in terms of a number, E0, extreme starburst). The formal errors in this process depend on magnitude and type of the object and are of the order of , and , respectively. They are getting larger for galaxies which are undergoing strong starbursts. Therefore we restricted our analysis to galaxies with reliable redshifts and take only the more quiescent ones () into account.
2 The projected correlation function
The projected correlation function ( is the separation perpendicular to the line of sight) was first introduced by Davis and Peebles, 1983, to overcome the influence of non-negligible peculiar velocities on the three-dimensional correlation function . They show that computing provides a direct measurement of . Redshift inaccuracies, as are unavoidable when using multicolor redshift estimates, likewise increase the noise and supress the correlation signal. We calculated for the LCRS (Shectman et al. 1996), for increasing (see Figure 1). The amplitude of rises very steeply with increasing integration limits, and reaches its maximum at the point where the integration limits have about the same size as the typical velocity dispersion in clusters ( km s-1).
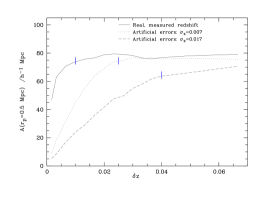
We added artificial errors, to simulate their influence on . As expected, redshift errors shift the point where the plateau is reached towards larger integration limits. One starts to sample the correlation signal when the integration limits are larger than the Full Width at Half Maximum of the redshift error distribution ( corresponds to a FWHM of , and corresponds to a FWHM of , respectively). Note that the maximum amplitude is also diminished. For errors of , the maximum amplitude is a factor 1.2 lower than in the case of the unchanged data. Thus we conclude that the appropriate choice of the integration limits is .
3 The evolution of galaxy clustering
In order to avoid a known galaxy cluster at we calculated the projected correlation function for the COMBO 17 data in three different redshift bins (, , ). Although the calculation was carried out for a closed high-density model (, ), a hyperbolic low-density model (, ), and a flat low-density model with non-zero comological constant (, ), we present here only the latter case (see Figure 2). To facilitate the direct comparison with the LCRS data, we used the modified sample (with artificial errors of size ) and the same integration limits.
Based on the photometry between and nm the absolute -band luminosities can be estimated without applying any -corrections. It is well known that in the local universe bright galaxies are much stronger clustered than faint ones (Norberg et al. 2002), as expected if bright (massive) galaxies form in the high density peaks of the underlying dark matter density field (Kaiser 1984). For a reliable determination of clustering evolution galaxies with similar absolute luminosities have to be compared. At redshifts up to CADIS is dominated by faint () galaxies, which supress the correlation signal and thus would distort the measurement of the clustering evolution. A consistent comparison of galaxy clustering at different redshifts can only be achieved, if the correlation function in the lowest two redshift bins is calculated only for galaxies brighter than .
The amplitudes were fitted at for the LCRS and for COMBO 17 at kpc (at the mean redshift of the survey () this corresponds to a comoving separation of kpc, so we compare the same comoving scales). From and its measured slope we can calculate the amplitude of at a comoving separation of Mpc. Figure 2 shows the logarithm of the amplitudes of the real space correlation function at Mpc, versus . We parametrise the evolution of the clustering strength with redshift by a parameter , which gives directly the deviation of the evolution from the global Hubble flow: , thus the parameter can be deduced from a straight line fit. With a , cosmology, we find for the bright sample .
We then repeated the analysis for a subsample of early type galaxies (E0 to Sb). The early type galaxies are at higher redshifts much higher clustered than the complete sample. At their clustering strengths are equal, the LCRS point can be used as local measurement for the early type galaxies as well, and
Field-to-field variations do not properly average out, as becomes especially clear in the early type sample. The full amount of four COMBO 17 is needed to draw final conclusions concerning the differential evolution of the galaxy clustering. Nevertheless, it is already obvious that the clustering of the older galaxies is significantly different. This is in good agreement with the concept that biasing should become less and less important when approaching the present epoch.
References
- [1] Davis, M. and Peebles, P., 1983, ApJ 267, 465
- [2] Kaiser, N. 1984, ApJ284, L9
- [3] Norberg, P., Baugh, C. M., Hawkins, E., Maddox, S. , Madgwick, D., Lahav, O., Cole, S., Frenk, C. S., Baldry, I., Bl,-Hawthorn, J., Bridges, T., Cannon, R., Colless, M., Collins, C., Couch, W., Dalton, G., De Propris, R., Driver, S. P., Efstathiou, G., Ellis, R. S., Glazebrook, K., Jackson, C., Lewis, I., Lumsden, S., Peacock, J. A., Peterson, B. A., Sutherland, W. and Taylor, K. 2002, MNRAS332, 827
- [4] Shectman, S. A., Landy, S. D., Oemler, A., Tucker, D. L., Lin, H., Kirshner, R. P. and Schechter, P. L. 1996, ApJ470, 172
- [5] Wolf, C., Dye, S., Kleinheinrich, M., Meisenheimer, K., Rix, H.-W. and Wisotzki, L. 2001, A&A377, 442