11email: soltan@camk.edu.pl (AMS)
2 MPI für extraterrestrische Physik, Giessenbachstraße, 85748 Garching, Germany
11email: mjf@mpe.mpg.de (MJF)
11email: ghasinger@mpe.mpg.de (GH)
Missing baryons and the soft X-ray background
The X-ray background intensity around Lick count galaxies and rich clusters of galaxies is investigated in three ROSAT energy bands. It is found that the X-ray enhancements surrounding concentrations of galaxies exhibit significantly softer spectrum than the standard cluster emission and the average extragalactic background. The diffuse soft emission accompanying the galaxies is consistent with the thermal emission of the hot gas postulated first by the Cen & Ostriker hydrodynamic simulations. Our estimates of the gas temperature - although subject to large uncertainties - averaged over several Mpc scales are below keV, which is substantially below the temperature of the intra-cluster gas, but consistent with temperatures predicted for the local intergalactic medium. It is pointed out that the planned ROSITA mission would be essential for our understanding of the diffuse thermal component of the background.
Key Words.:
X-rays: diffuse background – large-scale structure of Universe1 Introduction
The X-ray background (XRB) is mostly generated by discrete extragalactic sources (e.g. Lehmann et al. (2001), and references therein). Among those sources, various classes of AGNs constitute a dominating part. Probably 5 to 10 % of the soft XRB is produced by hot gas in clusters of galaxies. Around and below hot plasma in the Galaxy also contributes to the total background flux (Hasinger 1992). Apart from the source contribution, truly diffuse emission of extragalactic origin is also expected. Using hydrodynamic simulations Cen & Ostriker (1999) investigated evolution of the primordial gas density and temperature. Baryons not condensed in stars and interstellar medium within galaxies, occupy the intergalactic space and are spread over a wide range of temperatures and densities. This question is discussed in detail by Davé et al. (2000), Bryan & Voit (2001) and Croft et al. (2001). According to all the simulations, the hottest phase is located in the high mass concentrations of clusters of galaxies and it is responsible for the cluster X-ray emission. Relatively cold phase with temperature below K reveals its presence by the Lyman alpha forest. The fraction which still escapes detection, described as Warm-Hot Intergalactic Medium (WHIM), comprises of – % of all baryons in the present-day universe (Davé et al. 2000). Its temperatures are between and K and the hottest and high density fragments surround mass concentrations as groups and clusters of galaxies. Thus, the thermal emission by WHIM should be easiest to detect in the soft X-rays in the vicinity of rich clusters and high galaxy density areas. However, as pointed by Bryan & Voit (2001), compact sources produce most of the background and observations put tight constraints on the level of truly diffuse XRB component.
Detailed analysis of the diffuse emission produced by the intergalactic medium has been presented by Bryan & Voit (2001) and Croft et al. (2001). Using hydrodynamic simulations they generated maps of the X-ray sky which included contribution from the WHIM component. These maps have been used to calculate the model autocorrelation function of the XRB at small angular scales (below ) as well as the cross-correlation with the galaxy distribution.
In the present paper the distribution of the XRB in the vicinity of galaxy concentrations is carefully investigated from the observational point of view. Lick counts (Shane & Wirtanen 1967, hereafter SW111The Lick galaxy counts in pixels have been kindly provided to us in the electronic form by Dr. M. Kurtz.) and Abell clusters of galaxies (Abell 1958, Abell et al. 1989) have been used to select areas of the high mass concentrations. Since the predicted WHIM temperatures are substantially lower than those of the intra-cluster gas, and the WHIM emission is softer that the average extragalactic XRB, the objective of our analysis is to look for the systematic variations of the XRB spectral slope as a function of the distance from peaks of the galaxy distribution. The expected WHIM contribution to the XRB is small in comparison to the total background flux. To increase signal-to-noise ratio we have measured the excess XRB flux around galaxy concentration using the cross-correlation technique. The X-ray data contained in the ROSAT All-Sky Survey (RASS) have been used. For a comprehensive description of the RASS see Snowden & Schmitt (1990), Voges et al. (1999) and Snowden et al. (1995). Due to limited angular resolution of the RASS we have concentrated on the larger scales than those investigated by Croft et al. (2001). In the next section the basic concept of our investigation is presented and in Sect. 3 results of calculations are given. We end our investigation with the short conclusions in the Sect. 4.
2 The Method
It is well established that the XRB exhibits fluctuations over a wide range of angular scales (e.g. Śliwa et al. (2001) and references therein). It is expected that the XRB variations result from the nonuniform distribution of sources which generate the XRB (e.g. Sołtan et al. (1999)). One should note, however, that intrinsically large, extended sources also produce fluctuations at the corresponding angular scales. Such fluctuations associated with rich clusters of galaxies have been detected by Sołtan et al. (1996). They calculated the cross-correlation function (CCF) between the distribution of the Abell clusters and the RASS maps. The region apparently free from the strong galactic emission has been used. The positive amplitude of the CCF extended up to and for nearby and more distant clusters, respectively. The CCF signal indicated that clusters are surrounded by halos of the enhanced X-ray emission. They estimated the average size of the halo at approximately Mpc. The amplitude of the X-ray enhancements above the average XRB level is extremely low. It amounts to about % of the total XRB surface brightness. Such weak signal could not be detected using an individual cluster observation but it was identified in the statistical sense in the cluster population using the cross-correlation analysis.
Two explanations have been proposed in the original paper: discrete and diffuse. In the discrete model the excess emission is produced by a large number of sources. The X-ray enhancements result from the fact that the spatial density of galaxies around clusters is larger. This increased density extends up to at least Mpc from the clusters (Seldner & Peebles 1977). Such concentrations of galaxies naturally generate excess X-ray volume emissivity, associated with the X-ray emission of normal galaxies and weak AGN sources populating those galaxies. In the diffuse model it was ad hoc assumed that the X-ray emission was produced in the extended hot clouds of gas surrounding the clusters.
These two models demonstrate significantly different spectral properties. As shown by Cen & Ostriker (1999) and Davé et al. (2000) the WHIM which would be a source of the X-ray enhancements contributes mostly at and below , while the normal galaxy and AGN emission is substantially harder and is expected to have spectral shape not distinctly different from the integrated XRB flux. The hot intra-cluster gas with typically between and also produces a harder spectrum than the WHIM.
The CCF of the RASS and the SW counts has been determined in Sołtan et al. (1997). The clear correlation signal was interpreted as a result of the clustering of galaxies, but some indication of the extended emission associated with galaxies has been reported there.
The excess emission at angular distance from the randomly chosen galaxy or cluster is related to the amplitude of the corresponding CCF, , in the following way:
| (1) |
where is the average XRB signal. The details of the CCF calculations are given in Sołtan et al. (1996). Here we recall the main points. The final RASS data are binned into pixels. We have binned the galaxy/cluster samples in the same way and the CCF was estimated using the formula:
| (2) |
where and denote the X-ray count rate in the -th pixel and number of galaxies/clusters in the -th pixel, respectively; is the number of pixel pairs with the separation equal to and the sum extends over all such pairs; and are the mean values of the XRB and galaxy/cluster distributions.
The objective of the present calculations is to determine the X-ray excess flux, , as a function of the photon energy. Unfortunately, the energy range of the ROSAT PSPC useful in the present investigation covers a rather narrow energy range, roughly between and 222The soft band below is highly contaminated by local galactic emission (Snowden et al. 1995).. In the calculations we have used three standard ROSAT energy bands: R5, R6 and R7 with peak response at , and , respectively (see Snowden et al. 1994 for details). Since the PSPC energy resolution is relatively poor, those bands overlap what additionally reduces the sensitivity of our analysis.
3 Results
In the present calculations we have used the data at high galactic latitude in the northern hemisphere (), where the extragalactic signal seems to be least contaminated by the galactic emission: (Sołtan et al. 1996). Although in this region some local contribution is still present, the CCFs between the RASS maps and optical samples are determined with relatively high accuracy.
Since the present calculations are based on the angular cross-correlations, the effect depends on the galaxy distances. The redshift distribution of SW galaxies is relatively wide with a median value of and % of galaxies have redshifts between and . These estimates are based on extrapolations of the redshift distribution of the early SDSS data (Dodelson et al. 2001).
The Abell clusters (Abell 1958, Abell et al. 1989) have been divided into two distance groups. Sample I contains clusters with Distance Class through and all Richness Classes, and sample II contains DC = and RC . In the investigated area samples I and II consist of 57 and 210 clusters, respectively. In our analysis both samples give consistent results for all three energy bands (see below). However, due to the small number of clusters in the sample I, uncertainties of our measurements for that sample are too large to draw restrictive conclusions on the spectral properties of the X-ray halos. For this reason, the subsequent analysis is limited to the sample II. Using the Abell et al. (1989) data it is estimated that % of DC clusters have redshifts between and .
The SW counts and Abell clusters cover comparable redshift ranges and the distributions of objects in both data sets are strongly correlated. To make the cross-correlation analysis of the SW and RASS data independent of the Abell clusters, all the calculations involving the SW galaxies were performed using a mask which removed the galaxies and X-ray flux related to clusters 333Radius of the masked out area depends on the cluster distance. For the nearest clusters (DC ) pixels within from the cluster position are removed, while for DC only pixels centered on the cluster and 8 neighbouring pixels are not used..
The results of our calculations are shown in Figs. 1 through 4 in the form of X-ray ‘colour-colour’ diagrams using different combinations of bands R5, R6 and R7. To see effects of gas temperature variations with distance from galaxy concentrations, the excess fluxes have been calculated using the corresponding CCF amplitudes at different separations. Data representing clusters are shown with squares while the data referring to SW galaxies – with pentagons.
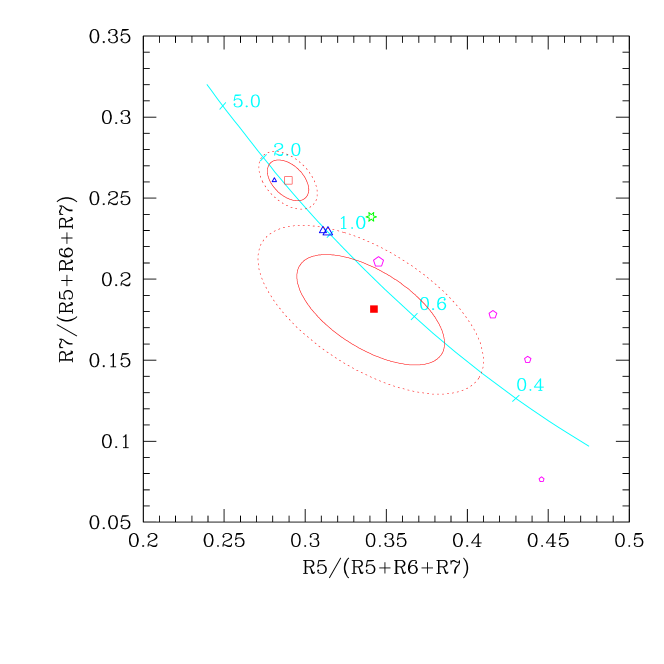
In Fig. 1 the distribution of excess count rates in the R5 and R7 bands normalized to the cumulative count rate excess in all three bands is shown. The empty square representing the central cluster regions shows the emission determined from pixels containing the cluster center; the full symbol – represents the ‘halo’ region which is defined as an annulus with the inner and outer radius of and . The solid and dotted ellipses denote % and % confidence areas. The SW data are shown for 4 separation bins: the largest symbol denotes signal for separations smaller than , and the next three pentagons of decreasing size represent three separation bins of , , and , respectively.
To assess effectiveness and to inquire into potential systematic effects of our method, we have calculated also excess emission associated with the population of AGNs listed in the Veron catalogue (Véron-Cetty & Véron 2000).
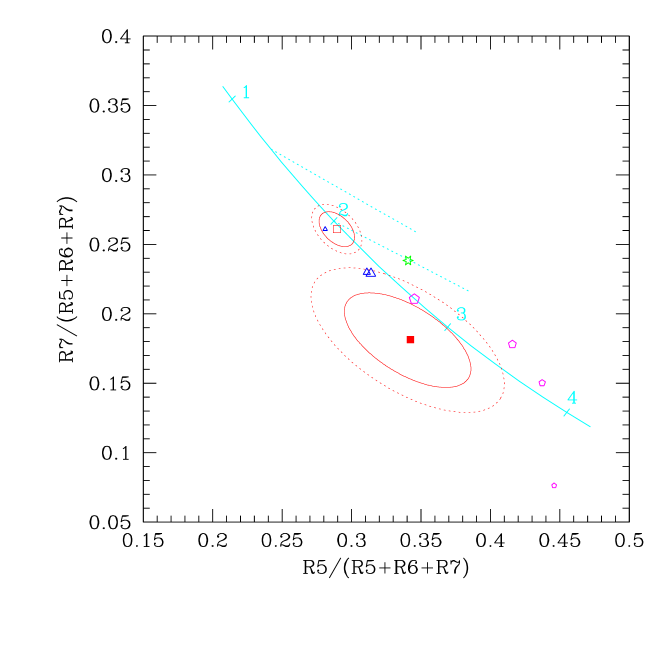
Thermal Bremsstrahlung spectra are given by the solid curve; labels denote temperatures in keV. In Fig. 2 the same data points are superimposed on the solid curve indicating the location of pure power law spectra; marks with labels give the photon indices. Potential effects of the Local Bubble and our own Galaxy halo emission on the integrated background flux are shown with two dashed lines. The lower line represents the sum of the power law spectrum with the photon index and the thermal Bremsstrahlung with . The contribution of the thermal component increases along the line from at the left-hand end of the line to of the counts in the R6 band at the right-hand end. The upper line represents spectra with and the thermal component varying in the same range.
Uncertainty ellipses for the cluster sample have been delineated using the distributions of 1000 simulations. In each simulation, the count rates in randomly chosen RASS pixels were used to perform analogous computations as for the real data. In each simulated run the number of drawn pixels was equal to the number of clusters in the sample. Because the halo signal is substantially weaker than the ‘core’ signal, our estimates of the halo temperatures are much less accurate.
The error ellipses for the core and halo emission containing more than % of the simulation runs begin to overlap. This puts the lower limit for the significance of the temperature difference for these two cluster-centered regions. The statement is strengthened by the fact that the effect is present for any combination of the X-ray colours (see the remaining figures below).
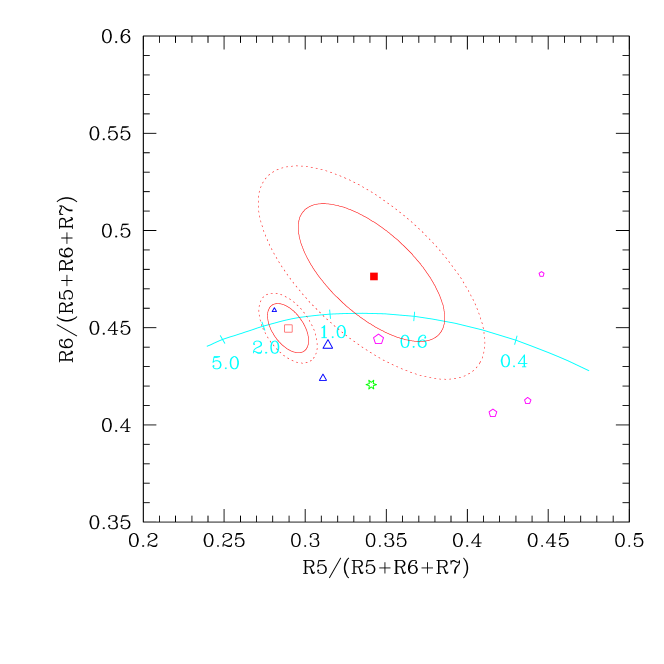
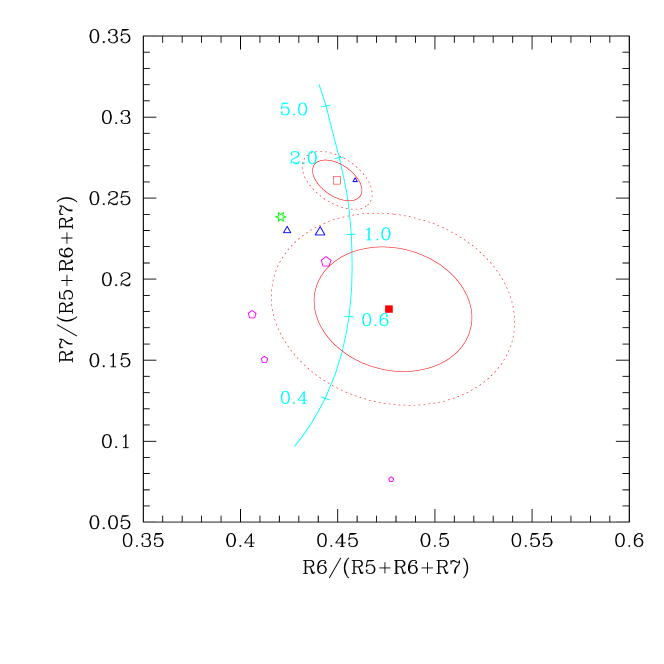
In the Figs. 3 and 4 the distribution of all the categories of objects is shown using different combinations of the ROSAT bands. Although both SW and cluster points exhibit large uncertainties and scatter, all the data display a common feature. Namely, the emission parametrized by the temperature (or the spectral slope) correlated with the cluster and SW galaxies distribution becomes systematically softer as the distance from the galaxy concentration increases.
The results for the cluster sample can be summarized as follows: the cluster flux is consistent with the thermal emission with (see below) and the halo flux - with keV. Although halo uncertainties are large and this temperature difference is barely significant, the general trend in all the ‘colour-colour’ diagrams is highly suggestive. Similar temperature differences between the core and halo excesses derived for all combinations of the energy bands demonstrate that the distribution of count rates in each band contributes to the resultant temperature effect around the cluster population. The excess associated with the cluster halos appears to be consistent with thermal emission generated by the WHIM.
The excess emission correlated with the SW galaxies is still softer than that around clusters indicating lower gas temperature in qualitative agreement with simulations. Quantitative assessments of this effect are hindered by systematic effects (see below) as well as large statistical errors. Although in the case of the SW points alone systematic colour variations with the increasing separation are of low statistical significance, combined analysis of the cluster and SW samples shows that the effect is real. The error bars (not shown in figures for clarity) for three colours of the ‘zero lag’ SW data representing separations below are in the range of . Thus, the SW signal is distinctly softer than the cluster ‘core’ emission. At larger separation the CCF amplitude suffers from substantially larger uncertainties and consequently colours of the ‘’ bin differ from the ‘’ bin by just over . One should note however, that the resultant CCF amplitude is a superposition of signals generated by the galaxy clustering and the extended emission surrounding galaxies. This conclusion is supported by our earlier analysis of the SW – RASS correlation (see Sołtan et al. 1997).
Our estimates of the CCF between the RASS maps and the SW galaxies cannot be directly compared with the CCFs generated by Croft et al. (2001) for two reasons. Galaxies simulated by Croft et al. are more distant than the SW galaxies and, what is more important, those simulations are not devised to reproduce the discrete emission by galaxies, while in our measurements the CCF amplitude represents the total correlation signal. In the present investigation the IGM emission is revealed because it is substantially softer than the galactic emission.
It is disturbing that our estimate of the average cluster temperature falls below . This value is significantly lower than the median temperature of observed in rich clusters (e.g. David et al. 1993, Horner et al. 1999). This discrepancy could be removed by a measured adjustment of the instrument calibration. However, modification of the effective area in bands R5, R6 and R7 which are required to remove the cluster temperature inconsistency are of the order of % what is larger than residual uncertainties of the X-ray telescope/PSPC parameters (see below). In the recent study of the cluster X-ray emission distribution Bonamente et al. (2002) report detection of soft excesses in a large fraction of sources. The authors claim that in the soft ROSAT band of keV detected fluxes are on the average % larger than it is expected from extrapolation based on measurements at higher energies (above keV).
To test if this phenomenon could explain our low temperature cluster measurement, we have calculated ‘colours’ of the X-ray emission (defined by the R5, R6 and R7 bands) for the two temperature thermal Bremsstrahlung. Small amount of the low temperature emission was added to the main ‘standard’ component of keV. It was found that keV emission normalized to % in the low energy band used by Bonamente et al. (2002) affects the R5, R6 and R7 colours in such a way that they mimic the thermal emission with the temperature of keV. Thus, this effect only partially explains our cluster temperatures, but the discrepancy is substantially reduced.
A question of the ‘soft excess’ is complicated further by systematic uncertainties of the instrument calibration below the carbon edge (i.e. keV). The comparison between PSPC, Chandra and XMM soft sources shows that the PSPC gives about % larger absolute fluxes at these energies. The agreement above keV is much better ( %). Thus, the present investigation is practically unaffected by uncertainties in the soft bands since the R5 – R7 bands have negligible responses below keV (Snowden et al. 1994), but the Bonamente et al. (2002) result could be subject to calibration errors.
Systematic errors of the X-ray ’colours’ in the RASS indicated by the cluster ’core’ temperature are of the order of . Although we are unable to point out rigorously a single cause of this error, no potentially responsible effect could alter the main conclusion of the present investigation, that the excess emission correlated with the galaxy distribution softens with the increasing size of the investigated area. Systematic errors in the ’colour - temperature’ relationship introduce uncertainty of the cluster ’halo’ temperature at the level of keV, and in the case of large separations in the SW galaxies - of about keV. Consequently, all our temperature determinations should be increased correspondingly. Thus, the cluster ‘core’ temperature disagreement and statistical noise precludes us from making a quantitative determination of the IGM temperature. But our investigation shows convincingly that concentrations of galaxies are surrounded by emission of significantly lower temperature than the average XRB and the cluster ’core’ emission.
One should note that the typical surface brightness of the IGM in the cluster halo is roughly two orders of magnitude lower than the signal measured in pixels centered on clusters. Thus, a halo contribution to the amplitude of the CCF at zero lag is negligible. It implies that our estimate of the core temperature remains practically unaffected by the halo component.
4 Summary and conclusions
A perceptible fraction of the XRB fluctuations is correlated with rich clusters of galaxies and with the overall galaxy distribution. The cross-correlations between the XRB and Abell clusters/SW galaxies extends up to several degrees. The large angular size enhancements of the XRB which surround regions of higher galaxy densities have distinctly softer spectrum than the genuine cluster emission. It is highly suggestive that these enhancements are generated by the WHIM. The halo emission is consistent with the thermal Bremsstrahlung with below keV. Taking into account large uncertainties of the present estimates and a wide range of plasma temperatures predicted by Cen & Ostriker (1999) and Croft et al. (2001), our results are in good agreement with theoretical models. Limited energy range used in this investigation combined with the moderate energy resolution of the PSPC data prevent us from more detailed conclusions.
This limitation applies also to our evaluations of the AGN spectral characteristics. Although the average X-ray colours of a population of AGNs are adequately mimicked by the thermal spectrum (Fig. 1), simple power law spectral models also provide good fits (Fig. 2). Uncertainties (not shown in figures) of the AGN colours are of the order of , , for redshift bins , , , respectively. Thus, all three samples do not exhibit significant colour differences. The majority of AGNs used in the present analysis are luminous X-ray sources and their average spectral properties are not identical with the average spectrum of weak sources which generate most of the XRB. Additionally, the integral soft XRB is contaminated by thermal emission of our Galaxy (Hasinger 1992). Importance of this effect in our calculations is illustrated in Fig. 2 with dashed lines.
Most if not all shortcomings of the present investigation would be eliminated with the ROSITA mission which is being proposed. The ROSITA telescope mounted on board of the International Space Station would perform an all-sky survey within the energy range of keV and a sensitivity about 100 times better than the RASS. These characteristics are particularly suitable for the analysis of the low surface brightness features generated by the WHIM. Such investigation requires large, unlimited field of view. Also wide energy range extending well above the WHIM domain would help to isolate the WHIM thermal emission from the non-thermal components of the X-ray emission correlated with the galaxy distribution. High sensitivity would substantially increase efficiency of the correlation method by reducing the photon noise statistics.
Finally, we would like to note that although the extended clouds of hot gas around clusters in principle are sources of the Sunyaev-Zel’dovich (S-Z) effect (Sunyaev & Zel’dovich (1980)), simple estimates by Sołtan et al. (1996) and Śliwa et al. (in preparation) indicate that for temperatures of the gas lower than , the amplitude of the S-Z effect generated by halos is below the detection threshold of the COBE DMR measurements.
ACKNOWLEDGEMENTS. The ROSAT project has been supported by the Bundesministerium für Bildung, Wissenschaft, Forschung und Technologie (BMBF/DARA) and by the Max-Planck-Gesellschaft (MPG). This work has been partially supported by the Polish KBN grant 5 P03D 022 20.
References
- Abell (1958) Abell, G. O., 1958, ApJ Suppl., 3, 211
- Abell et al. (1989) Abell, G. O., Corwin, H, G. Jr. & Olowin, R. P., 1989, ApJ Suppl., 70, 1
- Bonamente et al. (2002) Bonamente, M., Lieu, R., Joy, M. K. & Nevalainen, J. H., 2002, astro-ph/0205473
- Bryan & Voit (2001) Bryan, G. L. & Voit, G. M., 2001, ApJ, 556, 590
- Cen & Ostriker (1999) Cen, R. & Ostriker, J. P., 1999, ApJ 514, 1
- Croft et al. (2001) Croft, R. A. C., Di Matteo, T., Davé, R., et al., 2001, ApJ, 557,67
- Davé et al. (2000) Davé, R., Cen, R., Ostriker, J. P., et al., 2000, ApJ, 552, 473
- David et al. (1993) David, L. P., Slyz, A., Jones, C., et al., 1993, ApJ, 412,479
- Dodelson et al. (2001) Dodelson, S., Narayanan, V. K., Tegmark, M., et al., 2001, astro-ph/0107421
- Hasinger (1992) Hasinger, G., 1992, Highlights of Astronomy, 9, 199
- Horner et al. (1999) Horner, D. J., Mushotzky, R. F. & Scharf, C. A., 1999, ApJ, 520, 78
- Lehmann et al. (2001) Lehmann, I., Hasinger, G., Schmidt, M., et al., 2001, A&A, 371, 833
- Seldner & Peebles (1977) Seldner, M. & Peebles, P. J. E., 1977, ApJ, 215, 703
- Shane & Wirtanen (1967) Shane, C. D. & Wirtanen, C. A., 1967, Publ. Lick Obs., Vol. XXII - part I
- Śliwa et al. (2001) Śliwa, W., Sołtan, A. M. & Freyberg, M. J., 2001, A&A, 380, 397
- Snowden et al. (1995) Snowden S.L., Freyberg, M. J., Plucinsky, P. P., et al., 1995 ApJ 454, 643
- Snowden et al. (1994) Snowden S.L., McCammon D., Burrows D. & Mendenhall J.A., 1994, ApJ 424, 714
- Snowden & Schmitt (1990) Snowden S.L. & Schmitt, J. H. M. M., 1990, Ap&SS, 171, 207
- Sołtan et al. (1996) Sołtan A. M., Hasinger G., Egger R., et al., 1996, A&A, 305, 17
- Sołtan et al. (1997) Sołtan A. M., Hasinger G., Egger R., et al., 1996, A&A, 320, 705
- Sołtan et al. (1999) Sołtan A. M., Freyberg, M., Hasinger G., et al., 1999, A&A, 349, 354
- Sunyaev & Zel’dovich (1980) Sunyaev, R. A. & Zel’dovich, Ya, B., 1980, ARA&A 18, 537
- Véron-Cetty & Véron (2000) Véron-Cetty, M. P. & Véron, P., 2000, Eso Sci. Rep., 19,1
- Voges et al. (1999) Voges, W., Aschenbach, B., Boller, Th., et al., 1999, A&A, 349, 389