Department of Physics, University of Tokyo, 7-3-1 Hongo, Bunkyo, Tokyo 113-0033
11email: uchiyama@astro.isas.ac.jp; takahasi@astro.isas.ac.jp 22institutetext: Max-Planck-Institut für Kernphysik, Postfach 103980, D-69029 Heidelberg, Germany
22email: Felix.Aharonian@mpi-hd.mpg.de
Fine-structure in the nonthermal X-ray emission of
SNR RX J1713.73946 revealed by Chandra
We present morphological and spectroscopic studies of the northwest rim of the supernova remnant RX J1713.73946 based on observations by the Chandra X-ray observatory. We found a complex network of nonthermal (synchrotron) X-ray filaments, as well as a ’void’ type structure – a dim region of a circular shape – in the northwest rim. It is remarkable that despite distinct brightness variations, the X-ray spectra everywhere in this region can be well fitted with a power-law model with photon index ranging 2.1–2.5. We briefly discuss some implications of these results and argue that the resolved X-ray features in the northwest rim may challenge the perceptions of the standard diffusive shock-acceleration models concerning the production, propagation and radiation of relativistic particles in supernova remnants.
Key Words.:
radiation mechanisms: non-thermal – ISM: supernova remnants – ISM: cosmic rays – stars: supernovae: individual: RX J1713.739461 Introduction
The supernova remnant (SNR) RX J1713.73946 has proven to be a prominent source of nonthermal X-rays and presumably also -rays, thus providing strong evidence that shell-type SNRs are sites of acceleration of galactic cosmic rays. This source was discovered during the ROSAT All-Sky Survey (Pfeffermann & Aschenbach pfeffermann (1996)). Observations with ASCA have revealed intense synchrotron X-ray emission from the entire remnant (Koyama et al. koyama97 (1997); Slane et al. slane (1999)). Unlike SN 1006, no evidence for thermal X-ray components has yet been found.
At the north perimeter of RX J1713.73946, a molecular cloud (cloud A) has been found with a high CO (=2–1)/CO (=1–0) ratio that suggests possible interaction between the cloud and the SNR shell (Butt et al. butt01 (2001)). The cloud has positional association with the unidentified -ray source 3EG J17143857 (Butt et al. butt01 (2001)). Most recently, Uchiyama et al. (uchiyama02 (2002)) reported an unusually flat-spectrum X-ray source (AX J1714.13912) coincident with this cloud, and argued that the flat spectrum can be best interpreted by bremsstrahlung from either sub-relativistic protons or mildly relativistic electrons. The high-energy particles responsible for the X-ray and -ray emission from this cloud are likely associated (in one way or another) with the SNR-cloud interaction. For the preferred distance to SNR RX J1713.73946 of kpc (Slane et al. slane (1999)), based on the kinematic distance to cloud A, the age of the remnant is estimated to be yr. A younger age of yr cannot be, however, excluded if kpc.
The CANGAROO collaboration (Muraishi et al. 2000) reported the detection of TeV -ray emission from the direction of the northwest (NW) rim, the brightest region of synchrotron X-rays in RX J1713.73946. If confirmed, the TeV -radiation would provide direct and unambiguous evidence for the presence of particles (electrons and/or protons) accelerated to very high energies. Recently Enomoto et al. (enomoto (2002)) published the spectrum of TeV emission based on the new CANGAROO observations. The spectrum is claimed to be quite steep with a power-law photon index between 400 GeV and 8 TeV. They argued that the steep spectrum is inconsistent with the inverse Compton (IC) model, but could be explained by -decay gamma-rays. If true, for the canonical shock-acceleration spectrum of protons with power-law index , this would imply a cutoff energy in the proton spectrum around 100 TeV. Subsequently, Reimer & Pohl (reimer (2002)) and Butt et al. (butt02 (2002)) argued that this interpretation would violate the -ray flux upper limits set by the EGRET instrument. However, this is not a sufficiently robust argument to be used to dismiss the hadronic origin of the reported TeV emission. Adopting a slightly harder proton spectrum, e.g. with spectral index , it is possible to avoid the conflict with the EGRET data. Even for proton spectra steeper than , it is still possible to suppress the GeV -ray flux, if one invokes the effects of energy-dependent propagation of protons while traveling from the accelerator (SNR shocks) to the nearby clouds (see e.g. Aharonian aharonian01 (2001)). Moreover, the lack of GeV -rays can be naturally explained by confinement of low-energy (GeV) protons in the supernova shell, in contrast to the effective escape of high-energy (TeV) protons.
On the other hand, the arguments against the IC model of TeV emission should be backed by thorough theoretical studies based on higher quality data from the radio, X-ray and -ray domains. X-ray observations are of particular interest because the synchrotron X-ray spectra reliably “control” the predictions of IC emission at TeV energies. In this paper, we report on the X-ray study of the NW rim of SNR RX J1713.73946 using archival data obtained with the Chandra X-ray Observatory (Weisskopf et al. weisskopf96 (1996)). We demonstrate that the X-ray emission has remarkable substructure with bright filaments accompanied by curious dark voids. The observed features set new standards in X-ray studies of SNRs which should help to understand deeper the nonthermal processes of particle acceleration, propagation and radiation in supernova shocks.
2 X-ray data
The observation of the northwest (NW) rim of the SNR RX J1713.73946 was carried out on 2000 July 25 (ObsId 736) with the Advanced CCD Imaging Spectrometer (ACIS) on board Chandra. The data were obtained with the ACIS-I array consisting of four front-side-illuminated CCD chips. As shown in Fig. 1, the array was placed to cover the brightest portion of the remnant. We analyzed the processed level 2 event data (processing version R4CU5UPD14.1), retrieved from the Chandra public archive, with a new gain map applied. The overall light-curve was examined for possible background flares or fluctuations; no significant time-variation was found. During such a quiescent period, the instrumental background is relatively constant () with time 111For details, see http://cxc.harvard.edu/contrib/maxim/bg/ . Indeed, the count rate in the 8.5–10 keV energy interval is typically only several percent lower than the (standard) blank-sky data sets. Since this difference is within the statistical uncertainties of our results presented in this paper, the instrumental background component is taken from the blank sky data. After data processing, we obtained an effective exposure time of 29.6 ks.

2.1 Image analysis
Figure 2 shows the Chandra image of the NW rim of SNR RX J1713.73946 in the energy range of 1–5 keV with the photon counts summed in pixels of . Point sources are removed, based on a wavelet decomposition using the CIAO software wavdetect (Freeman et al. freeman02 (2002)). We extracted the profile of photon counts from the rectangular region depicted in Fig. 2, summed over the vertical narrow dimension of the rectangle (Fig. 3). Figure 4 shows the smoothed X-ray images in the soft 1–3 keV and hard 3–5 keV bands. The images have been adaptively smoothed with the CIAO software csmooth, where the local photon counts are utilized to determine the width of the Gaussian smoothing kernel at each position. The map of kernel widths was calculated based on the broad 1–5 keV image. In Fig. 5, we show the spatial distribution of the hardness ratio, (3–5 keV)/(1–3 keV), of the smoothed images, after corrections for the mirror vignetting and exposure time.


Dozens of compact and extended emission features have been detected throughout this region. The ASCA image of the NW rim now is resolved to distinctive components. Chains of bright filaments are evident within a more diffuse and fainter plateau. The surface brightness of the filaments is on average about two times higher than that of the surrounding plateau, although the latter constitutes the bulk ( %) of the X-ray flux detected from the rim region comprised of the filaments and plateau. The most prominent and largest filament located near the center of the image and running from north to south, has an apparent width of , which corresponds to linear scale of pc, where is the distance in units of 6 kpc. Adjacent to the west side of the prominent filament, there can be seen an interesting morphology – a “void”, i.e. a dim circular region with a radius of 3′. South of this circular void, we can see another void structure which seems to be extending beyond the observed field.
The features mentioned above are observed both in the soft and hard images. The two images are strikingly similar, thus implying small spectral variations across the NW rim including the filament, plateau, and dark void regions. This is quantitatively shown in the hardness-ratio map (Fig. 5). The northwest corner of the observed field, outside the boundary of this SNR, shows relatively hard emission, which would originate in hot optically-thin thermal plasmas pervading the Galactic plane.
2.2 Spectral analysis
We have examined the X-ray spectra extracted from various regions in the NW rim, including the filaments, plateau, and void regions (Fig. 6). The instrumental background components are subtracted by using blank-sky observations. Since the contribution of diffuse Galactic X-ray emission to the spectra is estimated to be about 5 % and 10 % for the filament and plateau regions, respectively, it has negligible effects on the spectral properties derived from these regions. Note, however, that for the void regions, the contamination could go up to 20 %.

Like the spatially integrated spectrum that has been discovered by ASCA, the spectra from individual regions can be represented as featureless continuum. This can be best interpreted by synchrotron emission produced by relativistic electrons with multi-TeV energies. We fit the spectrum in the 0.8–7 keV interval individually with a power-law model taking account of photoelectric absorption along the line-of-sight, and obtain statistically acceptable fits in all cases. In Fig. 7, we present the energy spectrum extracted from region 2 as a characteristic example, together with the best-fit model. We show the spectral parameters for these regions in Fig. 8. It is demonstrated that the best-fit values of photon index [ (photons cm-2 s-1 keV-1)] and absorbing column density are remarkably similar to each other, despite substantial brightness variations, with average values of and . These parameters agree fairly well with the reported ASCA spectrum integrated over the NW rim: and (Koyama et al. koyama97 (1997)).


Generally, a simple power-law function provides very convenient and meaningful parametrizations, especially for nonthermal X-ray in limited energy intervals. However, the synchrotron origin of X-ray emission a priori implies the presence of spectral cutoffs associated with the unavoidable (see below) cutoff in the acceleration spectrum of parent electrons. More specifically, in the case of SNRs the spectrum of synchrotron X-rays is formed by the highest-energy electrons distributed in the cutoff region. Although, the current models of diffusive shock acceleration do not provide definite predictions about the spectral form of electron distribution in the cutoff region, an exponential cutoff is commonly believed to be a natural assumption. Below we will adopt a more relaxed (generalized) form for the electron distribution, namely
| (1) |
with 1/2, 1, and 2, where is the maximum energy of accelerated electrons.
For this energy distribution of electrons, the -functional approximation gives a simple analytical presentation for the differential spectrum of synchrotron radiation:
| (2) |
where , is the photon index and is the cutoff energy. Generally, , where
| (3) |
is the characteristic energy of synchrotron photons emitted by an electron of energy , and is a parameter introduced to adapt this presentation to the results of the accurate numerical calculations. These calculations show that for (but not for as often used in literature), Eq. (2) gives an adequate description of the synchrotron spectrum with accuracy in a rather broad energy band, including the cutoff region (e.g. Aharonian aharonian00 (2000)).
Therefore below we invoke the spectral presentation given by Eq. (2) in order to estimate the allowed range for the cutoff-energy position in the Chandra data. We treated the cutoff energy as a free parameter, and derived the best-fit values for different combinations of fixed parameters and , namely and . We note that for the standard shock-acceleration spectrum with , one should expect , provided that the spectrum of electrons is not suffered deformation due to radiative and non-radiative (e.g. escape) losses. However, typically the cooling time of highest energy electrons responsible for synchrotron X-ray emission is shorter than the source age, even for young, 1000 yr old SNRs. This leads to the spectral steepening, thus, (corresponding to ) would be a more realistic choice.
We have performed spectral fits for one of the filamentary regions, region 2, by the model defined by Eq. (2) together with interstellar absorption. We have obtained good fits (, ) for each set of parameters, the absorbing column densities being found in the range . The best-fit cutoff energies are presented in Table 1. Except for (which actually implies very slow steepening of the electron spectrum rather than a cutoff), the synchrotron cutoff energies are high. In particular for the most realistic case with , the synchrotron cutoff energy exceeds 10 keV.
3 Discussion
A striking result of this study is the discovery of the inhomogeneous, filamentary structure in the synchrotron X-ray emission of the NW rim. The bright filaments and hot spots embedded in the diffuse plateau emission, cannot be easily explained by the standard diffusive shock acceleration theory. More surprisingly, the X-ray spectrum does not show noticeable variations over the entire rim, in spite of the strong gradient of the surface brightness distribution.
The derived hard power-law spectra of synchrotron X-rays imply that the electron acceleration continues effectively to TeV, unless we assume very strong magnetic field exceeding 100 . Even so, independent of the strength of magnetic field, the standard shock acceleration theory predicts a cutoff in the spectrum of synchrotron radiation around or below, and correspondingly – steep X-ray spectra.
In the framework of diffusive shock acceleration model, the synchrotron cutoff energy is set by the condition acceleration rate = synchrotron loss rate. The synchrotron cooling time of an electron of energy in the ambient magnetic field of strength is
| (4) |
The diffusive shock acceleration time (see e.g. Malkov and Drury malkdrury01 (2001)) can be written, with accuracy of about , in a simple form , where is the diffusion coefficient in the upstream region, and is the upstream velocity into the shock. The diffusion coefficient is generally highly unknown parameter, however, if one requires acceleration of particles to highest energies allowing synchrotron radiation up to X-ray energies, we must assume that the diffusion proceeds in the so-called Bohm diffusion regime, therefore it is convenient to parametrize the diffusion coefficient in terms of the Bohm diffusion coefficient , where and are the so-called gyroradius and gyrofactor, respectively. The value implies the smallest possible value of the diffusion coefficient, and correspondingly the shortest possible acceleration time,
| (5) |
From Eqs. (4) and (5) we find the maximum energy of accelerated electrons,
| (6) |
Now, substituting from Eq. (6) into Eq. (3), we find that the synchrotron cutoff energy depends only on the shock speed and the gyrofactor,
| (7) |
This simple treatment does not tell us much how far the electron spectrum can be extended beyond , and correspondingly how looks like the synchrotron spectrum in the cutoff region around . The assumption that the electron acceleration spectrum is described by the “canonical” Eq. (1) is indeed a rough approximation. In fact, the highest energy electrons from the cutoff region may have more complicated distributions, which, for example, may contain a pronounced pile-up just proceeding the cutoff (e.g. Melrose & Crouch melrose97 (1997)). However, this may only shift the position of the synchrotron cutoff to lower energies (Aharonian aharonian00 (2000)). Finally, we should note that the position of the synchrotron cutoff given by Eq. (7) should be considered as an absolute upper limit because it does not take into account other possible losses.
The results in the previous section indicate that the synchrotron cutoff in the radiation components observed from the NW rim, most likely are located above 10 keV. This requires which for any reasonable shock speed in RX J1713.73946 is quite a tough condition and hardly could be fulfilled even when the acceleration proceeds in the extreme Bohm diffusion regime (). A possible solution to this difficulty could be found if one assumes that the electron acceleration and radiation regions are effectively separated. Indeed, assuming that the acceleration takes place in sites of low-magnetic field, then the electrons quickly escape the acceleration region, enter into regions with significantly enhanced magnetic field, and there produce the bulk of the observed X-ray flux with a synchrotron cutoff well above 1 keV. Otherwise, one should invoke faster (yet unknown) electron acceleration than the standard shock-acceleration model provides, in order to account for the observed hard synchrotron X-ray spectra. Another possibility would be if the electrons are of secondary (-decay) origin produced at interactions of accelerated protons and ions with the ambient gas. This hypothesis requires very strong magnetic field and acceleration of protons to energies . Such a model recently was suggested by Bell & Lucek (bell (2001)). This hypothesis implies very hard spectrum of -decay TeV -rays with energy flux comparable to the energy flux of synchrotron X-ray emission. Therefore, the “hadronic” origin of electrons would be turned down, if the TeV -ray spectrum indeed breaks at sub-TeV energies as has been claimed by Enomoto et al. (enomoto (2002)).
Formally, the X-ray brightness distribution seen in Fig. 4 could be result of different depths of the line of sight, i.e. assuming that the bright filaments are sheets seen at “edge on”, and the plateau emissions are those seen at “face on”. Below we adopt a more likely, in our view, interpretation that the observed brightness distribution is a result of highly inhomogeneous production and distribution of relativistic electrons and magnetic fields in the NW rim. At first glance, homogeneous production of multi-TeV electrons over the NW rim cannot be ruled out, because in this case the filamentary structure might be referred to a local enhancement of the magnetic field. However, in the (most likely) regime when the synchrotron cooling time is less than the source age, the synchrotron X-ray luminosity does not depend on the strength of magnetic field. In this regime an equilibrium is quickly established between the electron injection and synchrotron losses. This implies that the synchrotron radiation saturates to the maximum possible rate determined by the electron injection rate, . Therefore, below we assume that the filamentary structure is associated, first of all, with inhomogeneous spatial injection of electrons. In general, since the propagation speed in different parts of the rim could be very different depending on the magnetic field and the developed turbulence, we should expect significant spatial variation of the density of particles even in those cases when they are injected into the rim almost homogeneously. The acceleration of electrons in selective regions of the rim would make the X-ray synchrotron image of the rim even more irregular and clumpy.
In this context, it is challenging to identify the X-ray filaments as sites of effective electron acceleration to TeV energies. It is likely that the filaments are bright not only due to enhanced magnetic fields, but also due to local concentrations of the multi-TeV electrons being directly accelerated there. To our knowledge, the filamentary structure is a feature which has not been discussed (dismissed ?) in the relatively well developed concept of diffusive shock acceleration in SNRs, although perhaps this could be attributed to the inhomogeneity of the ambient medium. Also, it is interesting to note in this regard, that an appearance of “hot spots” or “discharge zones” has been qualitatively predicted by Malkov (malkov97 (1997)) who related such features to the drop of the critical injection caused by changes in the flow structure. Thus the very fact of existence of nonthermal filamentary structures of the shell of this SNR should not be interpreted as contradiction to the diffusive shock acceleration model. The unusually small spatial scales of these structures perhaps also could be accommodated by this theory assuming very large ambient magnetic field significantly exceeding . However, as discussed above, any assumption of the magnetic field cannot explain the position of the synchrotron cutoffs beyond 10 keV, unless we assume more effective acceleration mode (e.g. Jokipii jokipii87 (1987)). The question of the nature of the mechanism of particle acceleration is beyond the framework of this paper, therefore below we will adopt a priory an acceleration spectrum extending well beyond 100 TeV at the presence of relatively large field – a condition dictated directly by the X-ray observations – and explore the spectral and spatial features of synchrotron radiation associated with the propagation effects of electrons in the rim.
The small lateral dimensions of the compact structures in the filaments allow effective escape of accelerated electrons, thus the main part of electrons would eventually reside outside their production sites. Therefore, it is not a surprise that the total X-ray flux from the NW rim is contributed mainly by the plateau region, although the filaments look much brighter.
Given the fast synchrotron cooling of X-radiating electrons compared to the source age and the compactness of the accelerators, any appropriate treatment of the problem should be time-dependent and should include propagation effects. More specifically, for the synchrotron cooling time yr, the spectral steepening of X-ray emitting electrons becomes unavoidable even for the minimum possible age of the source, yr. The energy-dependent escape on timescales , is another important factor for modification of the electron spectrum in thin filaments. Here pc is the typical thickness of filaments, and is the Bohm diffusion coefficient with the gyrofactor as a free parameter. In addition to the diffusive escape, we should take into account also the convective escape that occurs on timescales where is the shock-compression ratio. The convection is an important effect for delivery of low-energy particles from filaments to the surrounding plateau region.
To simplify the problem, and to clarify the basic relations, here we adopt a “two-zone” model applied earlier to SN 1006 (Aharonian & Atoyan aharonian99 (1999)). This model takes into account the effects related to the diffusive and convective escape of electrons from one homogeneous region (zone 1: acceleration site, i.e. filaments) to another (zone 2: the rest of the rim, i.e. plateau, where electrons coming from zone 1 are accumulated without escape) with essentially different physical parameters such as magnetic field, diffusion coefficient, etc., and gives time-dependent solutions for energy distributions of electrons in both zones. In the Chandra image of the NW rim, the classification of the filament/hot-spot (zone 1) and plateau (zone 2) regions is based on the surface brightness. The overall (i.e. integrated over the volumes) fluxes in the 2–10 keV band are estimated to be and for zone 1 and 2, respectively. Figure 9 shows the X-ray spectra from zone 1 and 2 characterized by a power-law function with a photon index . Below, we try to reproduce the observed fluxes and spectra of synchrotron X-rays from the filament and plateau, simultaneously, in the framework of the “two-zone” model, in order to testify the “filament/hot-spot = accelerator” scenario.
For the case of an old ( yr) and distant ( kpc) SNR, we found that a satisfactory fit is possible assuming strong and similar magnetic fields in the filaments and plateau, . Since the strong magnetic field implies fast synchrotron cooling, in order to get large X-ray fluxes from the plateau we should require an adequately fast escape of electrons from the filaments, namely , or . In Fig. 9a we assume and yr. The X-ray slope of the filament is explained by synchrotron radiation from the diffusive-escape-steepened distribution of high-energy electrons, while that of the diffuse plateau – from the synchrotron-loss-steepened distribution. The derived parameters lead to quite similar X-ray spectra for two zones. The total energy of electrons accumulated in the plateau, , appears one order of magnitude larger than that in the filaments. On the other hand, if the SNR is much younger ( yr) and closer ( kpc), a good fit is possible assuming that the magnetic field is stronger in the filaments, namely , but weaker in the plateau, . Since in this case the diffusive escape is very fast (), we must assume Bohm diffusion regime, , in order to keep electrons within the filaments. We also assume yr. Due to the smaller magnetic field in the plateau region and the small ratio, the radio emissivity of the plateau is considerably suppressed. The radio flux coming from the NW rim region plotted in Fig. 9 should not exclude this model because the population of radio-emitting electrons and that of X-ray-emitting electrons could be very different; the high quality data of the radio fluxes would be needed prior to definitive conclusions.
Modeling of the observed synchrotron X-ray emission is crucial for predictions of the spatial and spectral distributions of the associated IC -rays produced by the same electrons upscattering 2.7 K CMBR. In Fig. 9 we present the IC spectra from the filaments and the plateau. In both cases, we found that it is quite difficult to reproduce the flux and spectral shape of TeV -rays reported by the CANGAROO collaboration, in the synchrotron-IC model.
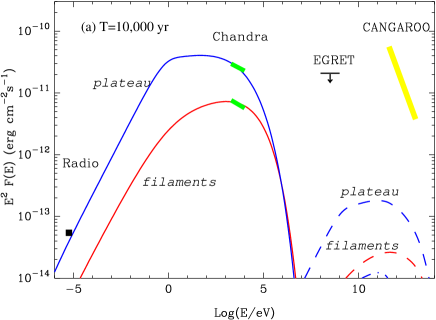
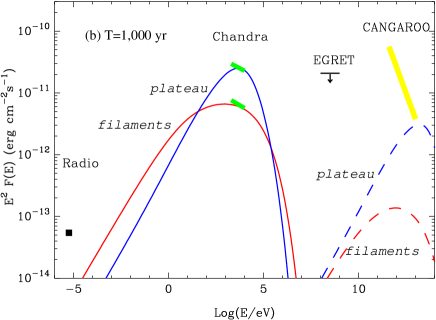
It should be noticed that the time-dependent treatment of the problem requires very effective acceleration of electrons. The exponential cutoffs in the acceleration spectrum are assumed at 125 TeV (case a) and 200 TeV (case b) in order to fit the X-ray data. As it follows from Eq. (6) these assumptions hardly could be accommodated by the standard diffusive shock acceleration model.
Finally, we would like to make a short comment concerning the possible association of the X-ray void with one of the three molecular clouds (cloud C, see Fig. 1) reported by Slane et al. (slane (1999)) in the proximity of RX J1713.73946. The density of this cloud is estimated from CO observations (Bronfman et al. bronfman (1989)), . If cloud C has physical association with RX J1713.73946, it could be an interesting site for the production of very high energy -rays through interactions of electrons and protons with the ambient dense gas. In order to explain the bulk of the reported TeV luminosity (Enomoto et al. 2002), , by -decay -rays, the total energy of protons in this cloud should be close to . This exceeds, by 2 or 3 orders of magnitude, the total energy released in relativistic electrons, assuming that the particle accelerator has been operating during the age of the source: and erg for and 2 kpc, respectively (see Fig. 9). Thus, the hypothesis of the -decay origin of the reported TeV flux would require a very large proton-to-electron acceleration ratio, significantly exceeding the canonical “100:1” value, given that only a fraction of the protons accelerated by the supernova shock could be captured by cloud C.
4 Conclusions
The Chandra image has revealed that the synchrotron X-ray emission from the northwestern rim of SNR RX J1713.73946 has remarkable fine-structure: the complex network of synchrotron X-ray filaments surrounded by fainter diffuse plateau, and a dark region with a circular shape. By examining individual spectra, we found that despite significant brightness variations, the spectral shapes of the X-ray spectra everywhere in this region are more or less similar, being well fitted with a power-law model of photon index 2.3.
The observed hard power law requires rather high synchrotron cutoff frequency (energy), set by the condition “acceleration rate = synchrotron loss rate”, which is most likely to be keV taking account of the effects of spectral steepening due to synchrotron losses. We need unreasonably high shock speed exceeding 5000 km s-1 to explain such a high cutoff energy within the standard formalism of the diffusive shock acceleration model. A possible solution to this difficulty could be obtained if one assumes low magnetic field in the acceleration sites, and high magnetic field in the emission regions. Otherwise we should invoke faster, as yet unknown, electron acceleration mechanism.
We testify the scenario that the filaments/hot-spots are the acceleration sites of bulk of multi-TeV electrons without specifying acceleration mechanism, by adopting a “two-zone” model. Then we found that our time-dependent treatment including the effects of fast energy losses and diffusive escape of electrons is capable of accounting for the fluxes and spectral shapes of X-ray emissions from both the filament and plateau regions. We note that the TeV spectrum reported by the CANGAROO collaboration cannot be readily explained by the IC scattering of the CMBR photons off X-ray-emitting multi-TeV electrons. Higher quality data from the radio, X-ray and -ray bands should help us to draw more definitive conclusions concerning the nature of acceleration mechanisms and the origin of the observed TeV -rays.
Acknowledgements.
We thank the referee, B. Aschenbach for very useful comments which helped to improve the paper, as well as G. Rowell and Y. Butt for helpful comments. Y.U. is supported by the Research Fellowships of the Japan Society for the Promotion of Science for Young Scientists.References
- (1) Aharonian, F. A., & Atoyan, A. M. 1999, A&A, 351, 330
- (2) Aharonian, F. A. 2000, New Astronomy, 5, 377
- (3) Aharonian, F. A. 2001, Space Sci. Rev., 99, 187
- (4) Bell, A. R., & Lucek, S. G. 2001, MNRAS, 321, 433
- (5) Bronfman, L., Alvarez, H., Cohen, R. S., & Thaddeus, P. 1989, ApJS, 71, 481
- (6) Butt, Y. M., Torres, D. F., Combi, J. A., Dame, T., & Romero, G. E. 2001, ApJ, 562, L167
- (7) Butt, Y. M., Torres, D. F., Romero, G. E., Dame, T., & Combi, J. A. 2002, Nature, 418, 499
- (8) Ellison, D. C., Slane, P., & Gaensler, B. M. 2001, ApJ, 563, 191
- (9) Enomoto, R., Tanimori, T., Naito, T., et al. 2002, Nature, 416, 823
- (10) Freeman, P. E., Kashyap, V., Ronsner, R., & Lamb, D. Q. 2002, ApJS, 138, 185
- (11) Jokipii, J. R. 1987, ApJ, 313, 842
- (12) Koyama, K., Kinugasa, K., Matsuzaki, K., et al. 1997, PASJ, 49, L7
- (13) Malkov, M. A. 1997, ApJ, 491, 584
- (14) Malkov, M. A., & Drury, L. O’C. 2001, Rep. Prog. Phys., 64, 429
- (15) Melrose, D., & Crouch, A. 1997, Proc. Astron. Soc. Aust., 14, 251
- (16) Pfeffermann, E., & Aschenbach, B. 1996, in Röntgenstrahlung from the Universe, ed H. U. Zimmermann, J. Trümper, & H. Yorke (MPE Rep. 263) 267
- (17) Reimer, O., & Pohl, M. 2002, A&A, 390, L43
- (18) Slane, P., Gaensler, B. M., Dame, T. M., et al. 1999, ApJ, 525, 357
- (19) Uchiyama, Y., Takahashi, T., & Aharonian, F. A. 2002, PASJ, 54, L73
- (20) Weisskopf, M. C., O’Dell, S. L., & van Speybroek, L. P. 1996, Proc. SPIE, 2805, 2