Weak lensing study of Abell 2029
Abstract
Abell 2029 is one of the most studied clusters due to its proximity
(z=0.07), its strong X-ray brightness and its giant cD galaxy which is
one of the biggest stellar aggregates we know. We present here the
first weak lensing mass reconstruction of this cluster made from a
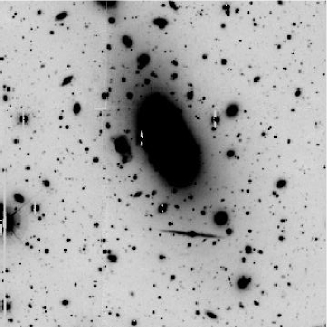
deep I-band image of centered on the cluster cD
galaxy. This preliminary result allows us already to show the shape
similarities between the cD galaxy and the cluster itself, suggesting
that they form actually a single structure.
We find a lower estimate
of the total mass of within a
radius of Mpc. We finally compute the mass-to-cD-light
ratio and its evolution as a function of scale.
Max-Planck-Institut für Astrophysik, P.O. Box 1317, D–85741 Garching, Germany
Institut für Astrophysik und Extraterrestrische Forschung, Auf dem Hügel 71, D–53121 Bonn, Germany
Institut d’Astrophysique de Paris, 98 bis Bld Arago, F–75014 Paris, France
Introduction
Abell 2029 is a well-known cluster, intensively studied in optical, X-ray, infrared and radio. Its particularity is to host the biggest cD galaxy ever observed. These cD galaxies seem to be often found in rich and relaxed clusters. Investigating the relationship between the diffuse light of these bright objects and the total mass of their cluster might be a useful probe of the properties of galaxy clusters. We present here the first weak lensing analysis of Abell 2029 which is a preliminary result of a future detailed study.
1. Weak lensing analysis
The low redshift of this cluster is welcome for X-ray and optical analyses; however the geometry of a very close lens and very distant sources is in general a disadvantage for the lensing efficiency. Therefore, a noisy mass reconstruction has to be expected in our study compared to more distant clusters. Furthermore, the cluster galaxies in low redshift clusters have a large angular extend so that the number density of background galaxies close to the cluster center is small. On the other hand, the mass computed for low redshift lenses is not very sensitive to the exact source redshifts of the background galaxies used for the reconstruction.
Our data were obtained in the I-band under subarcsec seeing conditions with the UH8K mosaic camera at the Canada-France-Hawaii telescope. The UH8K consists of eight 2k4k chips arranged in a mosaic of two rows each containing 4 CCDs. The total field-of-view is 2828′ with a pixel scale of 0.206′′. For our analysis we did not use the upper right chip of the mosaic suffering from charge transfer efficiency problems. The total integration time for A2029 was 9600 sec. consisting of 8 individual exposures taken with a dither pattern spanning about 15 arcsec to allow us to fill the gaps between individual CCDs. The exact details of the data processing will be published elsewhere.
From the final coadded image we extract an object catalogue with positions, sizes, ellipticities and magnitude. Since we do not have any color information we select the background galaxies by comparing the magnitude and size distributions of the galaxies in the center of the image (at the cluster-center location) and at the borders. The overdensity in the former distribution indicates in a statistical sense the magnitude and size of the cluster members. We then define our background galaxy catalogue by considering the corresponding smaller and fainter galaxies. As a result of this procedure, a number of background galaxies will not be included in our sample and a number of foreground galaxies might be included as background ones. This will not affect the shape of the mass contours but will lower the amplitude of the measured gravitational shear and allow us to estimate only a lower bound of the cluster mass.
The final catalogue contains background galaxies (15/arcmin2). To obtain final estimates of the galaxy shapes, the raw galaxy shapes were corrected for PSF effects with the method described by Kaiser, et al. (1995) and moficiations described in Hoekstra et al. (1998) and Erben et al (2001). This correction was applied separately on each CCD and the density of approximately one hundred stars per chip allowed an accurate PSF-correction mapping.
1.1. Mass distribution
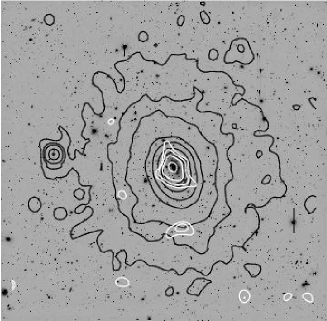
The catalogue allows us to estimate a smoothed shear map from that we can perform a weak lensing mass reconstruction. The left panel of Fig. 1 shows the resulting -map, i.e. the projected mass map, from the shear smoothed with a Gaussian filter with . The map clearly shows the presence of the cluster as well as several additional peaks of lower amplitude. In order to quantify the significance of each peak in our field we used the statistics introduced by Schneider (1996). With a filter scale of 4.12 arcmin, the cluster shows up as a 6.5- detection. Besides the main cluster, we find the secondary peaks to be likely noise features given their detection levels (Van Waerbeke 1999). The mass reconstruction clearly shows that the center of the mass coincides with the center of the cD galaxy and that the mass is elongated in the same direction as the light. We clearly see the strong correlation between the cD light and the mass distribution at the cluster center.
Next, we have computed the mean tangential shear around the cluster center in independent circular bins (see Fig. 2). Hereby we chose as center the position of the peak in the statistics with the smoothing scale of 4.12 arcmin where the cluster is detected at the highest significance. The massive cluster clearly causes a significant shear signal up to the borders of our data field. The error bars are estimated from the dispersion of the cross shear component that is not influenced by gravitational lensing. The profile is well fitted by an isothermal sphere model giving a best fit velocity dispersion of 842 km s-1. As we have seen before, this value has to be interpreted as a lower limit of the real one.
The X-ray contours that are also shown in Fig. 1 are centered on the cD galaxy and show the same orientation as the mass and the light distribution. The significant X-ray emission of the cluster goes even beyond the field of our optical image. The similar distributions of the cD light, the X-ray gas and the total mass strongly suggest that the cD is not an isolated object, but an aggregate of stars orbiting in the cluster potential.


The quantitative estimation of the mass requires breaking the so-called mass-sheet degeneracy by knowing or assuming the value of the mass at a given angular position. In order to do so, we assume no mass at the borders of the field, i.e. far from the cluster center and force the average -value at these locations to be zero. However, since the X-ray map and the shear profile still indicate the presence of some mass at a distance of from the cluster center, this further constrains our mass estimate to be a lower limit only.
Using an elliptical bin with the same orientation and shape as the cD light, we find a mass of within a semi-minor axis of Mpc.
2. Light distribution and M/L ratio
Uson et al. (1991) studied in detail the diffuse light of A2029 in R-band. They found that in order to trace this light component out to large radii, correcting the data for the contamination of extended halos of bright stars is necessary. They applied these corrections by accurately measuring their Point Spread Function (PSF) around very bright stars in other fields and then substracting this PSF around the bright stars present in the cluster field. This allowed the detection of the extended halo of the cD galaxy out to a distance of 425 kpc, measured as . The cD envelope appears with a constant eccentricity and follows a de Vaucouleurs profile over the whole range of detection (see Fig. 3). The integrated luminosity of the cD galaxy with this halo is 5 (R-band).
In order to study the relationship between the cD light and the cluster mass, we have computed the ratio in R-band as a function of scale (see Fig. 3). This lower limit evolves from 100 to 300 ML⊙ in the innermost 4 arcminutes.


3. Conclusion and Outlook
We have presented the first weak lensing analysis of Abell 2029. The very low redshift of the cluster imposes a low lensing efficiency and therefore a noisy mass reconstruction compared to more distant clusters. The available data allowed only lower mass estimates of the cluster since we can not properly select the background galaxies. However we can compute the shape of the mass contours of the cluster. They indicate that the cD galaxy lies in the center of the gravitational potential of the cluster and we find similar shape and orientation for the distribution of the mass and cD light. We have seen that despite the large size of our field () the mass can be traced up out to the border of the CCD which prevents us to break the mass-sheet degeneracy.
Using the light distribution of the cD galaxy studied in detail by Uson et al. (1991), we have computed the profile of the mass-to-cD-light ratio, which reaches a value of 300 ML⊙ in R-band at 4 arcminutes.
These preliminary results of a more detailed future study can already be used for comparing estimates made with other techniques. Next we plan to study this interesting cluster by using deeper images in two colours with Megacam@CFHT. Color information will allow us to obtain a fair separation of the cluster galaxies and therefore a non biased estimate of the cluster mass. It will then be possible to compare the light and mass distributions in great detail. With a deep, 6 hour I-band observation and the expected high number of background galaxies we will be able to investigate the cluster mass out to larger scales and thus allow a detailed comparison with existing X-ray maps and a properly break the mass sheet degeneracy.
This work was supported by the TMR Network “Gravitational Lensing: New Constraints on Cosmology and the Distribution of Dark Matter” of the EC under contract No. ERBFMRX-CT97-0172, and by the Deutsche Forschungsgemeinschaft under the project SCHN 342/3–1.
References
Erben, T., Van Waerbeke, L., Bertin, E., Mellier, Y., & Schneider, P. 2001, A&A, 366, 717
Hoekstra, H., Franx, M., Kuijken, K., & Squires, G. 1998, ApJ, 504, 636
Kaiser, N., Squires, G., & Broadhurst, T. 1995, ApJ, 449, 460
Schneider, P. 1996, MNRAS, 283, 837
Uson, J. M., Boughn, S. T., & Kuhn, J. R. 1991, ApJ, 369, 46
Van Waerbeke, L. 2000, MNRAS, 313, 524