The 2MASS Tully-Fisher relation for flat edge-on galaxies
The spiral edge-on galaxies from the ‘Revised Flat Galaxy Catalog’ (RFGC) are identified with the Extended Source Catalog of the Two Micron All Sky Survey (2MASS). A relative number of the 2MASS detected galaxies is 2996/4236 = 0.71. We consider the statistical properties of the Tully-Fisher relations for the edge-on galaxies in the and bands. The slope of derived TF relations increases steadily from 4.9 in the band to 9.3 in the one. The effect is mainly due to the internal extinction which is different in dwarf and giant spiral galaxies seen edge-on that leads to the tight correlation between galaxy color and luminosity. The moderate scatter of the RFGC galaxies in the “color-luminosity” diagram, 086, provides us with a “cheap” method of mass measurements of distances to galaxies on the basis of modern photometric sky surveys.
Key Words.:
galaxies: spiral — galaxies: fundamental parameters — galaxies1 Introduction
The Tully-Fisher (TF) relation (Tully & Fisher,1977) between luminosity and rotation velocity of spiral galaxies is a basic tool for studying large-scale motions of galaxies because it provides us with distances independent of galaxy redshifts. Using this relation, Tully & Fisher and their numerous followers excluded usually very tilted spiral galaxies burdened with strong internal extinction. However, as it was shown by Karachentsev (1989), internal extinction is not a dominant reason for scatter of spiral galaxies on the TF diagram, and edge-on galaxies may be successfully used to map cosmic streamings. For such a purpose the ‘Flat Galaxy Catalog’, FGC, (Karachentsev et al, 1993) and its renewed version, RFGC (Karachentsev et al, 1999) were prepeared. Selection of galaxies into the RFGC was carried out based on two simple geometric criteria, when the major angular diameter of galaxies is greater than 0.6 arcmin and the apparent axial ratio, , is greater than 7. Here the major and minor diameters correspond to the standard isophote of in the band. The RFGC catalog covers the entire northern and southern sky, and contains 4236 galaxies mostly of Sc–Sd morphological types. The all-sky distribution of RFGC galaxies looks quite smooth because late-type spiral galaxies are mostly found in the general field, avoiding rich cluster cores with their large virial motions. Only a small number of the RFGC galaxies have apparent integral magnitudes, , from RC3 (de Vaucouleurs et al. 1991). But for all its galaxies the RFGC presents marginal B- magnitudes derived from angular diameters of the galaxies as well as from their surface brightness and other parameters (Kudrya et al. 1997). Being reduced to the RC3 photometric system, these magnitudes are characterized with an error of . The TF relation ‘absolute magnitude vs. HI line width’, plotted for 800 RFGC galaxies, has a slope of 5.3 and a scatter of .
2 2MASS photometry of the RFGC galaxies
The Two Micron All-Sky Survey (2MASS) was carried out in three near- infrared bands: (1.11 - 1.36 ), (1.50 - 1.80 ), and (2.00 - 2.32 ) using two 1.3-m telescopes in Arizona and Chile, each designed with three 256256 pixel NICMOS arrays giving a resolution of 2/pixel. Over the whole sky the 2MASS led to detection of 3 000 000 galaxies brighter than (Jarrett, 2000). About 1.65 million galaxies with and an angular diameters greater than 10 are included in the 2MASS Extended Sources Catalog (XSC). Selection of extended sources and their photometry was made with the standard set of algorithms (Jarrett et al. 2000). Photometric calibration of the data was described by Nikolaev et al. (2000). As a result, the 2MASS XSC contains a lot of geometric and photometric characteristics of galaxies. Among them we use the following key parameters in the present paper:
— major isophotal radius in arcsec, measured at the level in the band via photometry in elliptical isophotes;
— minor-to-major axial ratio fit to 3 isophote co-added in three bands;
— isophotal fiducial elliptical-aperture magnitudes in corresponding bands, measured at the level;
— integral ”total” magnitudes as derived from the isophotal magnitudes () and the extrapolation of the fit to the radial surface brightness distribution. The extrapolation () is carried out to roughly four times the disk scale length. Details are given in Jarrett et al. 2000;
We carried out mutual identification of objects from RFGC and 2MASS XSC, taking into account coordinates, as well as dimensions and orientation of the galaxies. As it has been noted by Jarrett (2000), 2MASS is not sensitive to late-type blue galaxies, especially of low surface brightness due to the high background of the NIR sky and the relatively short exposure times (sec/object). When questionable cases were omitted, we identified in 2MASS XSC 2996 RFGC galaxies from their total number of 4236. Therefore, a relative number of the 2MASS detected galaxies is 71%.
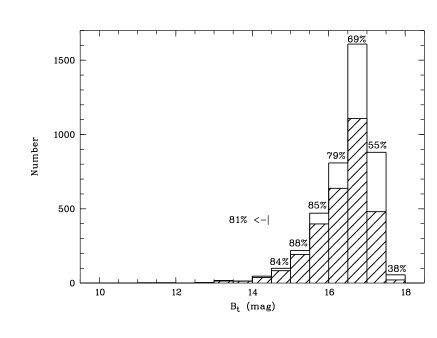
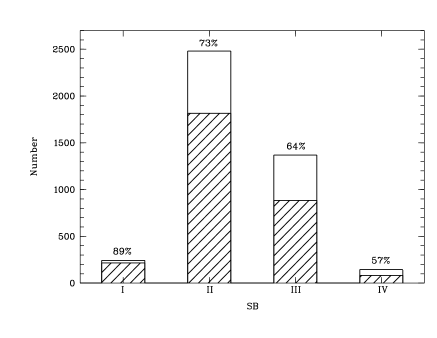
In Fig.1 we show the histogram of the distribution of RFGC galaxies according to their integral blue apparent magnitudes. The galaxies detected in 2MASS are shaded. As it was to be expected, the 2MASS detection rate decreases towards faint objects. In RFGC the galaxies were divided into four classes of their blue surface brightness: I — high, II — normal, III — low, and IV — very low. Fig.2 displays the distribution by these classes. The relative number of galaxies detected in 2MASS (shaded) decreases steadily with decreasing average optical surface brightness, which obviously comes up to expectations. A morphological classification of spiral galaxies seen edge-on can be done reliably based on their bulge-to-disk dimension ratio. The distribution of RFGC galaxies by morphological types in the de Vaucouleurs scheme ( 2=Sab, 3=Sb,…, 9=Sm) is presented in Fig.3,
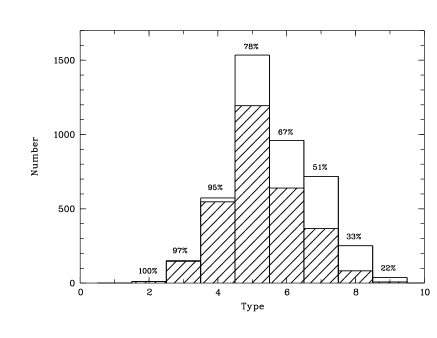
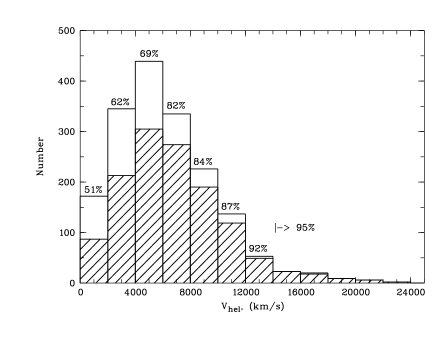
where the 2MASS detected galaxies are shaded. As clearly shown, the fraction of 2MASS detected galaxies decreases along the Hubble sequence from 100% for Sab type till 22% for the latest types. The presence of such morphological selectivity leads to a paradoxical effect displayed in Fig.4, where the distribution of 1772 RFGC galaxies by their radial velocities is shown. Unexpectedly, the relative number of 2MASS detected sources (shaded) increases steadily from nearby objects towards distant ones, reaching 95%, when 14000 km/s. These data give us a hint, that the color of edge-on galaxies, say B–K, may be a sensitive indicator of their luminosity (see below).
Due to the high brightness of the NIR sky and short 2MASS exposures, a bluish periphery of the disks of spiral galaxies is usually unseen above the isophote. On the average, the infra-red diameters turn out to be twice as small as the optical ones Jarrett et al. (2002). Because of bulges of spiral galaxies are redder than disks, their infra-red axial ratios, , are systematically lower in 2MASS with respect to the band. The blue axial ratios for RFGC galaxies occupy a range of [7 – 21] with a median of 8.6, while the infra-red ones cover an interval of [1 – 10] with a median of 4.1.
3 Comparison of 2MASS photometry with the deep I photometry
.
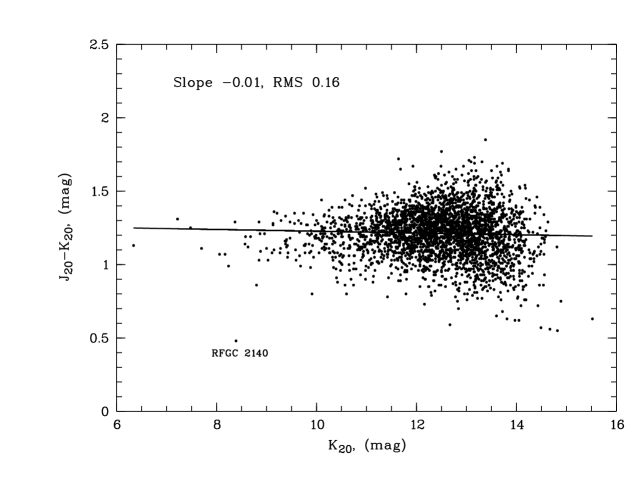
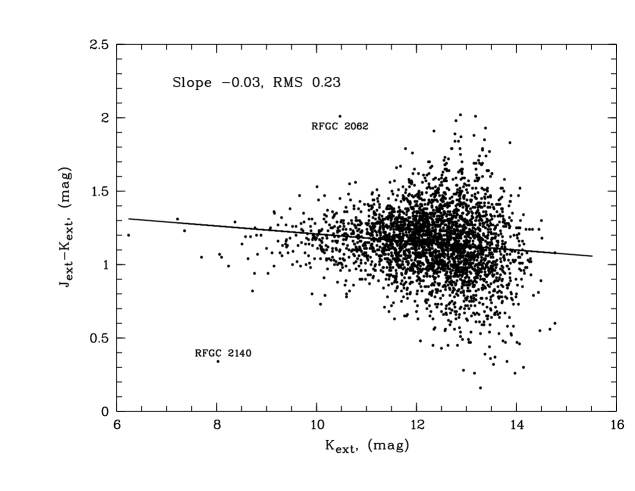
Plotting the TF diagram, one usually uses the total, but not isophotal magnitude of galaxies. In the 2MASS XSC the total magnitudes were computed from the isophotal magnitudes and the radial fit to the surface brightness profile. The aperture correction, , tends to increase from bright galaxies towards faint ones. The mean aperture correction is , i.e. on the average the isophote magnitude underestimates % of the total flux. About the same correction is the case for and magnitudes in XSC. But the mean value and the dispersion of the aperture correction depend both on the morphological type and surface brightness of galaxies. Although the employment of extrapolated apparent magnitudes seems to be more motivated for plotting the TF relation, we prefer to deal with the isophotal magnitudes. The reason for the preference is the uncertainty in the aperture correction for galaxies whose brightness profile is determined unreliably. In the upper panel of Fig.5 we show the distribution of RFGC galaxies according to their color and apparent magnitude . The mean color, , is almost the same for both bright and faint galaxies. The lower panel presents a similar diagram for the extrapolated (total) magnitudes. The mean corrected color of galaxies becomes a little bluer, = 1.16, the RMS scatter increases from 016 to 023, and in the diagram there appear galaxies with colors less than 0.5 and more than 1.8, not typical of spiral galaxies (Jarrett, 2000).
Unfortunately, we did not find in literature a representative enough sample of data on deep photometry for RFGC galaxies in the bands. Such a kind of data are available in the band only; that is why our comparison of ‘fast’ 2MASS photometry with the photometry based on ‘deep’ exposures will be indirect. Mathewson & Ford (1996) published an enormous list of 2447 southern spiral galaxies observed by them in the band with the 1-m and 2.3-m telescopes of Siding Spring Observatory. Later Haynes et al. (1999) presented their results of CCD photometry of 1727 spiral galaxies of Sbc and Sc types in the band. The observations were carried out on three different telescopes with typical exposures 600 sec, which enabled photometrying down to isophote . A comparison of these two extended photometric sets shows that the integrated I magnitudes of galaxies have been determined with an error of . In the lists (Mathewson & Ford 1996, and Haynes et al. 1999) we found 479 RFGC galaxies detected in 2MASS.
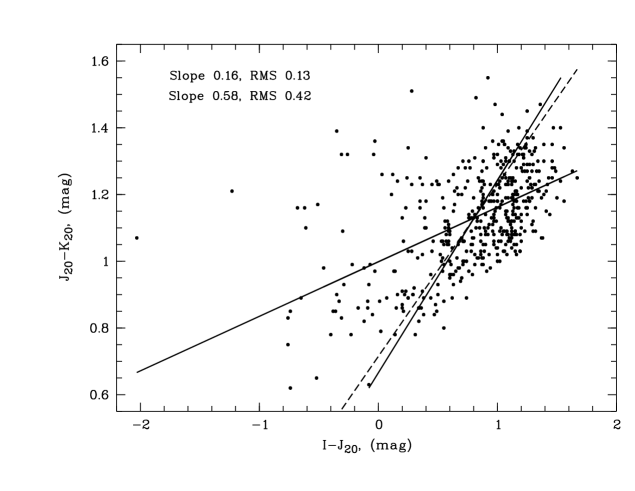
The distribution of these galaxies on the ‘color-color’ diagrams is given in Figures 6 and 7. The first one corresponds to a ‘short’ color scale, vs. . The galaxy distribution is characterized by direct and inverse regressions having slopes of 0.16 and 0.58, respectively, and the standard deviations and . The color difference between spiral galaxies is mostly due to their difference in stellar population. However, in the case of edge-on galaxies the different internal extinction comes to be the main cause of the color difference. According to Giovanelli et al. (1994) and Tully et al. (1998), the larger the linear dimension of a spiral galaxy, the stronger the internal extinction is. Blue dwarf galaxies of Sm type are almost transparent systems, while in giant edge-on Sb,Sc galaxies their total optical luminosity dims several times. Adopting the selective extinction in other galaxies to be the same as in the Milky Way (Cardelli et al. 1989), we get the selectivity line with a slope of 0.52, drawn in Fig.6 with a dashed stright line. As it is seen, the selective extinction line fits well the observed behaviour of edge-on galaxies in the { vs. } diagram. The largest deviations from the regression lines are characteristic of blue 0) galaxies of low surface brightness, whose isophotal magnitudes are apparently underestimated with respect to their total magnitudes. In spite of the presence of the ‘blue wing’, the { vs. } diagram shows that the mean external error of the magnitudes does not exceed 040, being suitable for mass measurements of distances of galaxies via the infra-red TF relation.
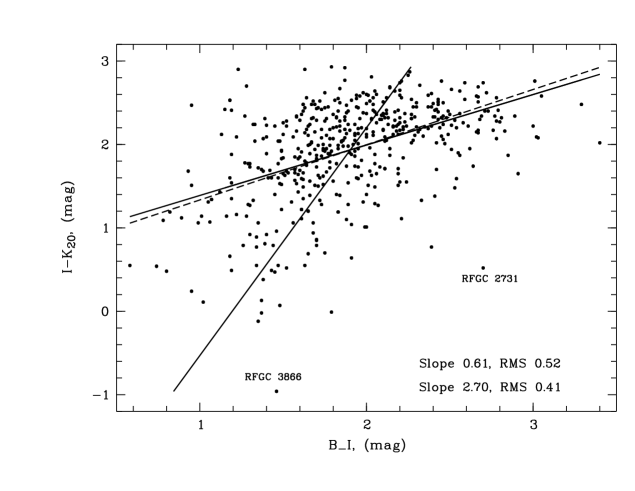
Using the magnitudes from RFGC for these 479 galaxies, we plotted in Fig. 7 the ‘color-color’ diagram with a maximum difference in wavelengths. The distribution of edge-on galaxies in the { vs. } diagram is described by the direct and inverse regression lines having slopes of 0.61 and 2.70, and a RMS scatters of 052 and 0.41 mag, respectively. The dashed line of ‘natural’ extinction with a slope of 0.66 fits well the observed distribution of RFGC galaxies, if one takes into account that the typical error of B magnitudes is , and also the fact that magnitudes for blue galaxies of low surface brightness are systematically underestimated.
4 Tully-Fisher relation in different bands
As it has been noted by many authors, the slope of the TF relation increases, but the scatter of galaxies decreases from blue to infra-red wavelengths. This can be understood as an input of the young blue stellar population, which only slightly affects the total luminosity of spiral galaxies in NIR bands. For edge-on galaxies their internal selective extinction is an additional source of differences of the TF diagrams plotted in different bands.
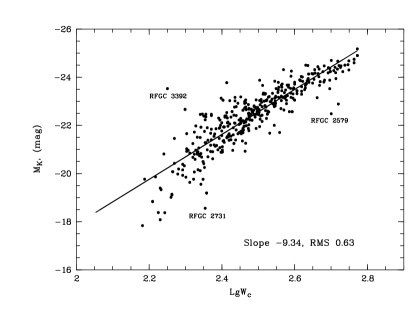
Among of 479 RFGC galaxies with know , and magnitudes there are 450 galaxies with the HI line width, , measured at a 50% level of the maximum (Karachentsev et al. 2000). The absolute magnitude in different bands for them was calculated as
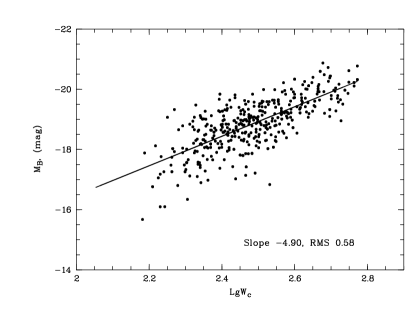
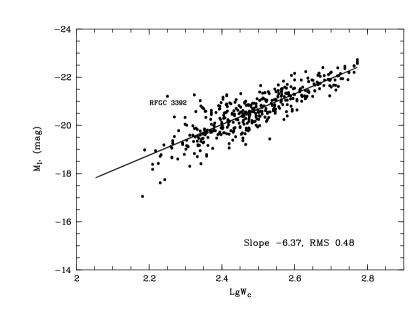
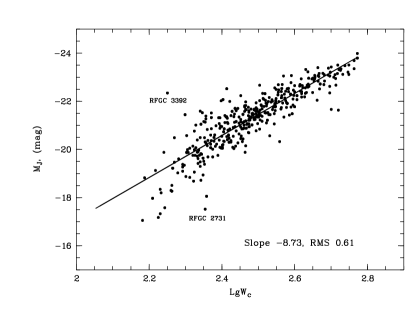
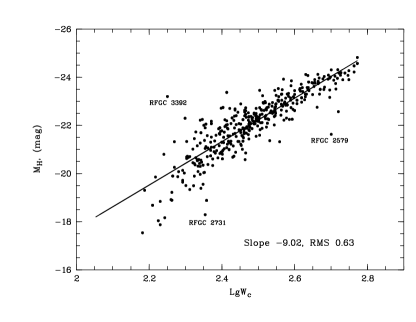
where the distance of a galaxy was determined from its radial velocity with respect to the Local group centroid (Karachentsev & Makarov, 1996), adopting the Hubble constant . The correction for the Galactic extinction, , was taken from Schlegel et al.(1998). Plotting relations vs. , we omitted 14 dwarf galaxies with 150 km s-1 because of uncertainty of their narrow HI line widths. The distribution of the remaining 436 RFGC galaxies in the TF diagrams from the to bands is shown in 5 panels of Fig. 8. In Table 1 we present the slope of the direct TF regression in each band, as well as the RMS scatter of galaxies with respect to it. For a reference, Table 1 gives also the TF parameters when the total magnitudes () or the Kron magnitudes () are used instead of the isophotal ones. (Kron aperture photometry (Kron 1980) employs a method in which the aperture is adapted to the first image moment radius). Examination of these data allows us to note some properties of the TF diagrams for RFGC galaxies.
| Photometric | direct regression | RMS scatter |
|---|---|---|
| band | slope | (mag) |
| B | 4.900.21 | 0.58 |
| I | 6.370.18 | 0.48 |
| J20 | 8.730.24 | 0.61 |
| Jext | 8.200.24 | 0.68 |
| Jfe | 7.740.23 | 0.66 |
| H20 | 9.020.25 | 0.63 |
| Hext | 8.710.25 | 0.73 |
| Hfe | 7.950.23 | 0.66 |
| K20 | 9.340.25 | 0.63 |
| Kext | 9.020.25 | 0.71 |
| Kfe | 8.380.24 | 0.69 |
The absolute value of the slope of the linear regression increases steadily with increasing a wavelength of the photometric band. The slope difference from 4.9 in the band to 9.3 in the band turns out to be much higher than for spiral galaxies of arbitrary orientation. For example, for spiral galaxies in the Ursa Majoris cluster the slope increases only from 6.8 in the band to 8.0 in the one (Verheijen, 2001). This difference can be readily explained if dwarf galaxies are almost transparent systems, but giant spirals have the mean internal extinction . About the same value, , has been derived by Tully et al. (1998) for the most luminous edge-on galaxies in Ursa Majoris.
Fig. 8 and Table 1 do not display any significant decrease in the scatter of galaxies in TF diagram from optical bands to NIR. The tendency of to decrease with is seen for the most luminous galaxies only. This circumstance is not a trivial one because it is the brightest spiral galaxies that are subjected to strong internal extinction, dimming, on the average, their blue luminosity by a factor of 5. Another explanation of the vs. dependence may be related with uncertainties in HI line widths. For instance, a scatter of = 0.05 generates a magnitude error of 0.25 mag in the band and 0.47 mag in the band.
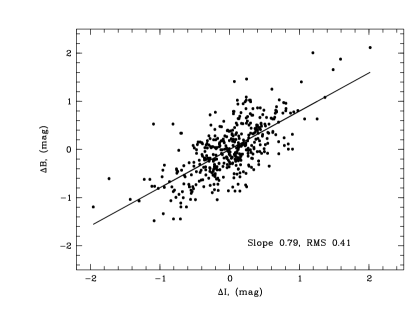
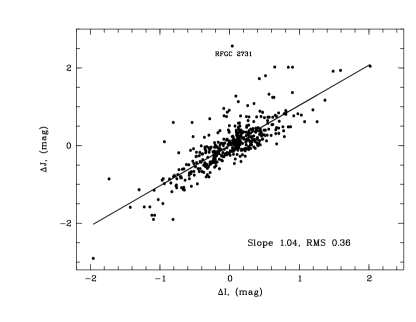
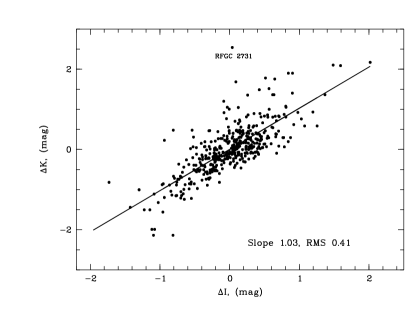
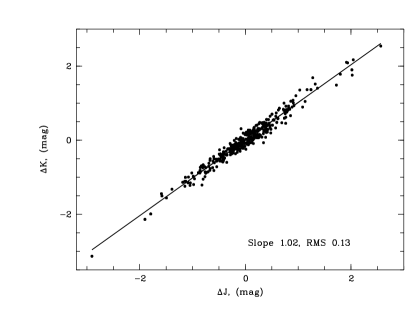
As it is obvious, the errors of photometry done in the bands are independent of the photometry errors in the and bands. Nevertheless, the residuals of galaxies in the TF diagrams exibit tight mutual correlations. Fig. 9 shows the distributions of 436 RFGC galaxies according to their residuals with respect to the regression lines in the , and bands. The greatest scatter (RMS = 0) is seen on the { vs. } diagram, which is due to errors of determination of magnitudes () via the angular diameter and surface brightness of the galaxies. In the diagrams { vs. } and { vs. } the galaxy distributions look rather asymmetric because the
and magnitudes underestimate the total luminosity of galaxies having low surface brightness. In the diagram { vs. } aperture corrections are mutually dependent, yielding a scatter of 013 only.
The observed correlation of residuals of the galaxies relative to the TF regressions shows that the galaxy scatter is mainly caused by some physical/statistical reasons, but not by photometric errors. Such reasons may be: a) large non-Hubble motions of galaxies, b) differences in structure of galaxies, particularly, in their visible mass-to-dark mass ratio, c) errors in measurements of HI line widths.
5 Color-luminosity relation for edge-on galaxies
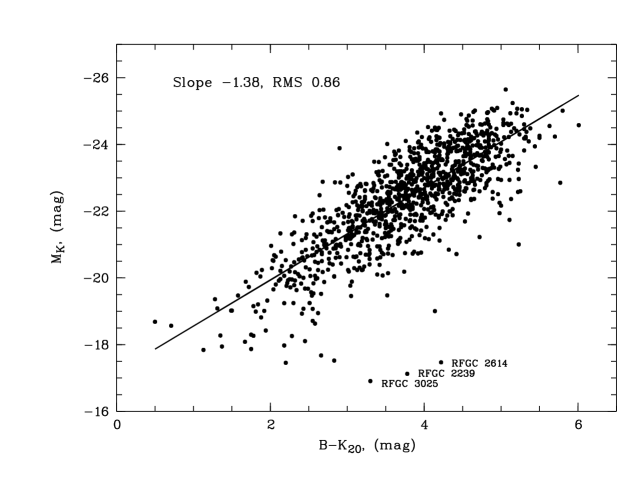
As it follows from the above- presented data, the spiral galaxies seen edge-on have a vast diversity of colors. For instance, their and colors span a range of 5 magnitudes! The bluest edge-on galaxies belong to almost transparent dwarf systems, where the young blue stellar population predominates. The reddest edge-on galaxies have giant disks whose dusty component dims their blue flux 5 times. Because the galaxy color (after the K-correction) does not depend on its distance, the ‘absolute magnitude - color’ relation may be used to determine distances of edge-on galaxies in the same manner as the classical TF relation is used. Such a possibility has already been discussed by Visvanathan (1981), Tully et al. (1982), and Kraan-Korteweg et al. (1988). In Fig. 10 we present the distribution of 1100 RFGC galaxies by their absolute magnitude and color, { vs. }. The diagram shows a close correlation between observables with a scatter of 0, which is a little worse than for the usual TF relation. Usage of the color — luminosity relation offers a possibility of mass measurements of distances to edge-on galaxies, based exclusively on photometric surveys of the sky, like 2MASS, SDSS, etc. We believe that the accuracy of the ‘color’ distances can be improved by taking account of surface brightness and other global parameters of the galaxies.
6 Conclusions
We considered the 2MASS photometric data on galaxies from the RFGC catalog with blue angular diameters and apparent axial ratios . About 71% of the RFGC objects are seen in the , and bands of 2MASS. Due to the short exposures, 2MASS does not detect the faint periphery of the disks. As a result, in the infra-red bands the edge-on galaxies seem to be about twice as short and also about two times as round as in the optical band. The measured isophotal and magnitudes need an average correction of 0 to get the total magnitudes. The mean internal error of the 2MASS photometry is , allowing the , and magnitudes to be used for plotting the Tully-Fisher relation. The TF diagram in the , and bands has a typical scatter of 0, which can be appreciably improved, by making allowance for surface brightness and other parameters of edge-on galaxies. The slope of derived TF relations increases steadily from 4.9 in the band till 9.3 in the one. The effect is mainly due to the internal extinction in the galaxies seen edge-on. The observed slope difference can be easily understood if blue dwarf galaxies are practically transparent and giant galaxies with typical rotation velocities of km/s have internal extinction of in blue light. Being averaged over giant and dwarf galaxies, the mean internal extinction, , well agrees with other estimates made by Haynes & Giovanelli (1984), Karachentsev (1991), and Verheijen & Sancisi (2001). On the color-color diagrams, vs. and vs. , the RFGC galaxies follow approximately the line of selective extinction typical of the Milky Way. The difference in stellar populations and, especially, in internal extinction between dwarf and giant galaxies gives rise to initiate correlation between color and luminosity for edge-on galaxies. The moderate scatter of the RFGC galaxies in the ‘color-luminosity’ diagram, 086, provides us with a new approach to mass measurements of distances to galaxies on the basis of modern photometric sky surveys like 2MASS and SDSS.
Acknowledgements.
We thank the referee, G. Paturel, for his very useful comments. This paper makes use of data of the the 2MASS, which is a joint project of the University of Massachusetts and the Infrared Processing and Analysis Center, funded by the NASA and NSF. This research was partially supported by DFG-RFBR grant 436 RUS 113/701/0-1.References
- (1) Cardelli J.A., Clayton G.C., Mathis J.S., 1989, ApJ, 345, 245
- (2) de Vaucouleurs G., de Vaucouleurs A., Corwin H.G. et al., 1991, Third Reference Catalogue of Bright Galaxies, Berlin, Springer (RC3)
- (3) Giovanelli R., Haynes M.P., Salzer J., et al., 1994, AJ, 107, 2036
- (4) Giovanelli R., Avera E., Karachentsev I.D., 1997, AJ, 114, 122
- (5) Haynes M.P., Giovanelli R., 1984, AJ, 89, 758
- (6) Haynes M.P., Giovanelli R., Chamaraux P., et al.,1999, AJ, 117, 2039
- (7) Jarrett T.H., 2000, PASP, 112, 1008
- (8) Jarrett T.H., Chester T., Cutri R., et al., 2002, AJ, submitted
- (9) Jarrett T.H., Chester T., Cutri R., et al., 2000, AJ, 119, 2498
- (10) Karachentsev I., 1989, AJ, 97, 1566
- (11) Karachentsev I., 1991, Letters to Astron. Zh., 17, 671
- (12) Karachentsev I.D., Makarov D.I., 1996, AJ 111, 535
- (13) Karachentsev I.D., Karachentseva V.E., Parnovsky S.L., 1993, AN, 314, 97 (FGC)
- (14) Karachentsev I.D., Karachentseva V.E., Kudrya Yu.N., Makarov D.I., 2000, Bull. SAO, 50, 5
- (15) Karachentsev I.D., Karachentseva V.E., Kudrya Yu.N., et al., 1999, Bull. SAO, 47, 5 (RFGC)
- (16) Kraan-Korteweg R.C., Cameron L.M., Tammann G.A., 1988, ApJ 331, 620
- (17) Kron R.G., 1980, ApJS 43, 305
- (18) Kudrya Yu.N., Karachentseva V.E., Karachentsev I.D., et al., 1997, Letters to Astron. Zh., 23, 728
- (19) Mathewson D.S., Ford V.L., 1996, AJ, 107, 97
- (20) Nikolaev S., Weinberg M.D., Skrutskie M.F. et al., 2000, AJ, 120, 3340
- (21) Schlegel D.J., Finkbeiner D.P., Davis M., 1998, ApJ, 500, 525
- (22) Tully R.B., Fisher J.R., 1977, A&A, 54, 661
- (23) Tully R.B., Mould J.R., Aaronson M., 1982, ApJ, 257, 527
- (24) Tully R.B., Pierce J., Huang J.S., et al., 1998, AJ, 115, 2264
- (25) Verheijen M.A., 2001, ApJ, 563, 694
- (26) Verheijen M.A., Sancizi R. 2001, A&A, 370, 765
- (27) Visvanathan N., 1981, A&A 100, L20