Observations of quasar hosts with adaptive optics at Lick Observatory
Abstract
We present near-infrared -band observations of the hosts of three quasars from the Sloan Digital Sky Survey made with the adaptive optics system at Lick Observatory. We derive a PSF for each quasar and model the host plus quasar nucleus to obtain magnitudes and approximate scale sizes for the host galaxies. We find our recovered host galaxies are similar to those found for quasars observed with the Hubble Space Telescope. They also have, with one interesting exception, black hole mass estimates from their bulge luminosities which are consistent with those from emission-line widths. We thus demonstrate that adaptive optics can be successfully used for the quantitative study of quasar host galaxies, with the caveat that better PSF calibration will be needed for studies of the hosts of significantly brighter or higher redshift quasars with the Lick system.
1 Introduction
All massive elliptical galaxies, and all the bulge components of spiral galaxies, seem to contain black holes whose masses correlate well with the depth of the potential wells of the stellar systems containing them (Ferrarese & Merritt 2000; Gebhardt et al. 2000). This implies that all such systems were probably quasars at some stage in their lifetimes, and indeed the luminosity density produced by quasars is probably consistent with this (Yu & Tremaine 2002). The importance of the evolution of quasars as diagnostics of galaxy formation models was recognized by Kauffmann & Haehnelt (2000), who produced predictions for the nature of quasar host galaxies as a function of quasar luminosity and redshift, based around semi-analytic models of galaxy formation.
Two main problems exist with current studies of quasar hosts. First, the samples are small. The hosts of only quasars with have been observed with NICMOS on the Hubble Space Telescope (HST) (Ridgway et al. 2001; Kukula et al. 2001; Rix et al. 2001). Comparison with, e.g., the Kauffmann & Haehnelt models using samples of this size is difficult, as the models predict a wide range in host galaxy magnitudes for a given quasar luminosity and significant redshift evolution in the host magnitudes. Second, quasar samples are selected using very different techniques, with different selection biases. For example, UV excess selection may select against spiral hosts, which are dustier than ellipticals, and radio selection probably selects the biggest black holes, in giant elliptical hosts (e.g. Lacy et al. 2001). Studying large samples of high redshift quasar hosts with HST is impractical due to the large amount of time required. Therefore our best hope of improving our knowledge of the nature of quasar hosts at is to use adaptive optics (AO) from the ground. So far, only small samples (such as the one in this paper) have been studied with AO. The quasar survey component of the Sloan Digital Sky Survey (SDSS), however, contains a large enough number of quasars that a significant number of quasars have good AO guide stars nearby. Furthermore, because this survey selects quasars on the basis of their being unresolved optically and and having colors lying off the stellar locus (Fan 1999; Richards et al. 2001), it is much more sensitive than most previous optical surveys to quasars with a modest amount of dust reddening. We thus expect that host galaxies of quasars from this survey should give a more complete picture of the quasar host galaxy population.
AO is, however, is a new technique with problems of its own. Previous attempts at studying host galaxies with AO, although largely successful in detecting both close companions and diffuse emission around the quasars, have encountered problems with PSF characterization and stability, which has limited the amount of quantitative information obtainable from the images (Stockton, Canalizo & Close 1998; Hutchings et al. 1999; Márquez et al. 2001). In this paper we present a pilot study of a small sample of quasars from the SDSS Early Data Release (Stoughton et al. 2002; hereafter EDR) observed with the Lick Adaptive Optics system in Natural Guide Star mode. We discuss issues related to PSF stability and subtraction, and present the results and a brief discussion of our observations and prospects for future quantitative studies of larger samples of quasar hosts with AO. We assume a cosmology with , and
2 Sample selection
The targets were selected from quasars in EDR list by matching them to the HST Guide Star Catalog, then selecting objects with guide stars bright enough to act as natural guide stars for the Lick Adaptive Optics System () within 45-arcsec. The three quasars in this paper were then selected on the basis of RA and guide star suitability. They were SDSS J005008.48+011330.4 (; hereafter SDSS 0050+0113), SDSS J172732.39+584634.4 (; hereafter SDSS 1727+5846) and SDSS J232351.60+004034.4 (; hereafter SDSS 2323+0040). Only SDSS 1727+5846 is radio-loud. Table 1 gives details of the quasars, and Table 2 the details of the quasar guide star (hereafter QGS) chosen for each of them.
3 Observations
3.1 The Lick AO system
Data were acquired using the Natural Guide Star AO system on the 3-m Shane Telescope at Lick Observatory. The AO system has 40 subapertures and uses a Shack-Hartmann wavefront sensor and a 61-actuator deformable mirror. The Lick AO system is further described in Bauman et al. (1999) and Gavel et al. (2000). The IRCAL near-infrared camera was used for the observations. This camera contains a PICNIC HgCdTe 256x256 array (Lloyd et al. 2000), which sits behind the AO system reimaging optics. The f/28 output of the AO system gives a plate scale of 0.076″/pixel and a field of view of 19.4″ 19.4 ″.
3.2 Observational strategy
In addition to a small PSF, surface brightness sensitivity is essential for successful observations of quasar hosts. The best AO performance of the Lick system is obtained in -band. However, the thermal background in is high due to the warm optical elements in the AO system. We therefore chose to make our observations in -band.
We tried to pick an observational strategy that was a good compromise between low overheads and reliable PSF monitoring. Observations of the quasars were therefore interleaved with on-axis observations of their guide stars at intervals of min. We also made a single observation of a PSF star - PSF guide star pair for each quasar, selected such that the PSF star was at the same distance and position angle from its guide star as the quasar was from its guide star. We used the PSF star observation to calibrate the effect of going off-axis (i.e. the anisoplanatism). The PSF star – PSF guide star (hereafter PGS) pairs are listed in Table 3.
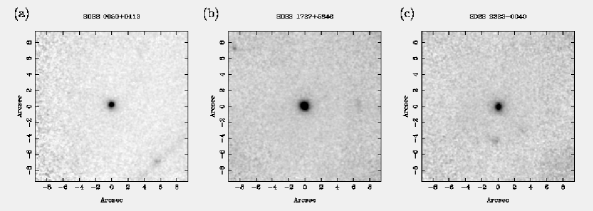
The quasar observations were made on the night of 2001 August 14th (UT). The data were taken as several five-point mosaics, with each pointing lasting 3-5 min, depending on sky stability. Small offsets of 1-2 arcsec were made between each mosaic. Total integration times were 75min for SDSS 0050+0113, 135 min for SDSS 1727+5846 and 120 min for SDSS 2323+0040. The interleaved observations of the QGS were made on the same five-point grid with exposure times of 10s per frame. The PSF stars were also observed on a five-point grid, with exposure times of 20-60 s per point. Flux calibration was achieved using the standard star HD162208 (Elias et al. 1982). The natural seeing was arcsec in -band. AO corrections were made at 100 Hz for all the targets. This maintained a level of counts on each subaperture of the wavefront sensor for our guide stars. Images of the fields are shown in Figure 1. Typically we were able to achieve FWHM of about 0.2 arcsec on axis (compared to the diffraction limit of 0.14 arcsec), however this degraded to about 0.4 arcsec off axis.
4 Analysis
Following flat-fielding, the quasar data were analysed with the dimsum package within iraf. Just before the final combination step, a second order polynomial was subtracted from each column to improve the the images, removing a “step” between two halves of the array. The most likely cause of this seems to be different, time-variable bias offsets which were not well-removed by the dark subtraction.
5 PSF synthesis
The AO PSF is both variable in time and dependent on many of the observing parameters. The brightness and color of the guide star (which determines the accuracy of the AO correction), the anisoplanatism (which may vary both with guide-star – object distance and position angle between the objects and the guide star), and the color of the object compared to that of the PSF star all need to be considered. Ideally, one would interleave quasar observations with frequent sampling of the off-axis PSF, using observations of a nearby PSF star – PGS pair well matched in guide star brightness, color, separation and position angle to the quasar – QGS pair. To produce a more efficient procedure, however, we observed as described in section 3.2, and subsequently attempted to reconstruct the PSF from frequent observations of the on-axis guide star, and a single observation of a PSF star – PGS pair chosen for proximity to the quasar rather than for exact matches in color and brightness to the quasar – QGS pair. (We have not attempted to correct for color differences between the PSF and quasar.) Our procedure, as described below, enables us to synthesize a PSF with a FWHM close to that of the quasar observations, even if the QGS and PGS have different brightnesses and therefore AO corrections which differ in quality. It also allows us to remove any component of the aberration due to anisoplanatism effects which is constant in time. Steinbring et al. (2002) show that a similar strategy of determining a kernel map for the off-axis variation of the PSF by observing a crowded stellar field can be effective, and remove the bulk of the anisoplanatism effects on the PSF.
The first step involves deconvolving the PSF star observation by the PGS. The Lucy deconvolution algorithm was used. Sufficient iterations were made to reduce the FWHM of the PSF star to significantly less than that of its guide star, with care being taken to stop the deconvolution process before obvious artifacts (e.g. ringing) appeared in the deconvolved image. This produces an “off-axis kernel” (Figure 2). In the second step, the off-axis kernel is then convolved with the average of the on-axis guide star observations to produce a synthesized PSF. This technique minimizes the problems of a mis-match in brightness and color of the PGS and QGS.
| Quasar | RA | Dec | |||
|---|---|---|---|---|---|
| (J2000) | (J2000) | (mJy) | |||
| SDSS 0050+0113 | 00 50 08.48 | +01 13 30.40 | 1.14 | 18.8 | |
| SDSS 1727+5864 | 17 27 32.41 | +58 46 34.44 | 0.84 | 18.4 | 216 |
| SDSS 2323+0040 | 23 23 51.60 | +00 40 34.36 | 0.76 | 20.0 |
| Quasar | QGS RA | QGS Dec | QGS -mag | PA | QGS Distance |
|---|---|---|---|---|---|
| (J2000) | (J2000) | (arcsec) | |||
| SDSS 0050+0113 | 00 50 05.75 | +01 13 27.4 | 10.5 | 266 | 41 |
| SDSS 1727+5864 | 17 27 34.45 | +58 47 14.7 | 9.6 | 22 | 43 |
| SDSS 2323+0040 | 23 23 54.12 | +00 40 14.6 | 10.3 | 118 | 42 |
| Quasar | PSF Star | PSF Star Guide Star | PA | Separation | ||
|---|---|---|---|---|---|---|
| RA(2000) Dec(2000) | -mag | RA(2000) Dec(2000) | -mag | (arcsec) | ||
| SDSS 0050+0113 | 00 56 54.74 +00 44 2.3 | 15.7 | 00 56 52.19 +00 43 58.5 | 11.3 | 264 | 42 |
| SDSS 1727+5864 | 17 18 33.16 +59 30 12.3 | 14.0 | 17 18 35.01 +59 30 55.3 | 9.9 | 18 | 45 |
| SDSS 2323+0040 | 23 24 17.60 +01 41 40.2 | 12.1 | 23 24 20.21 +01 41 29.5 | 10.6 | 105 | 41 |
| Quasar | Raw QSO FWHM | Synthesized PSF FWHM | QGS FWHM | PSF Star FWHM | PGS FWHM |
|---|---|---|---|---|---|
| (arcsec) | (arcsec) | (arcsec) | (arcsec) | (arcsec) | |
| SDSS 0050+0113 | 0.36 | 0.38 | 0.20 | 0.39 | 0.23 |
| SDSS 1727+5846 | 0.44 | 0.44 | 0.18 | 0.49 | 0.18 |
| SDSS 2323+0040 | 0.45 | 0.41∗ | 0.20 | 0.29 | 0.14 |
∗ convolved to account for registration errors, 0.37 prior to convolution. All FWHM are from Gaussian fits.
| Quasar | Axial ratio | Host | |||||||||||
|---|---|---|---|---|---|---|---|---|---|---|---|---|---|
| PA | |||||||||||||
| SDSS0050+0113 | 18.8 | 0.38 | 18.2 | 18.5 | 0.3 | 0.75 | 0.7 | 0.4 | 0.3 | 1.13 | 1.12 | 1.5 | 57 |
| SDSS1727+5846 | 19.0 | 0.38 | 18.6 | 18.8 | 0.25 | 1.2 | 1.2 | 1.1 | 0.3 | 0.89 | 0.89 | 1.0 | … |
| SDSS2323+0040 | 18.6 | 0.15 | 18.6 | 18.9 | 0.15 | 0.6 | 0.4 | 0.5 | 0.1 | 0.93 | 0.94 | 1.3 | 0 |
Notes: is the magnitude measured by subtracting the inner aperture to flatness, and the radius of the inner aperture in arcseconds. is the magnitude of the best-fitting elliptical galaxy model and that of the best-fitting disk galaxy model. All magnitudes are -band, Vega magnitudes, and are measured in square apertures 7.5-arcsec on a side centered on the quasar. is the estimated error in the magnitudes (both systematic and random). , and are the angular half-light radii for the subtracted-to-flatness, elliptical model and disk model hosts respectively, all in arcseconds. is the estimated error in the angular half-light radius in arcseconds. and are the reduced values for the elliptical and disk model fits, respectively. The axial ratio and host PA are measured from the outer isophotes of the subtracted-to-flatness hosts.
| Quasar | (Host) | (BLR) | |||
|---|---|---|---|---|---|
| (kpc) | () | () | |||
| SDSS0050+0113 | -23.4 | 6 | 0.3-0.4 | ||
| SDSS1727+5846 | -22.2 | 10 | 0.5-1.0 | ||
| SDSS2323+0040 | -21.8 | 3.1 | 0.14-1.0 |
Notes: is the half-light radius, (Host) is the black hole mass estimated from the host galaxy luminosity, (BLR) is the same quantity estimated using the width of the Mgii emission line. is the luminosity of the quasar in Eddington units, calculated assuming a bolometric correction of 12 to rest-frame -band (Elvis et al. 1994).
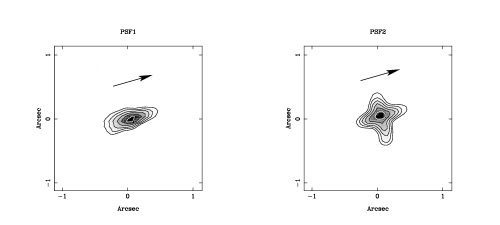
To investigate the variation of the off-axis kernel with time and the particular choice of PSF star/PGS pair, we performed a test using data obtained during non-photometric conditions on 2002 May 26 (UT). We used the same observational setup and observed in similar seeing conditions as our 2001 August observations. This test involved observing two different PSF stars close to 1709+6225 (J2000). The two PSF star/PGS pairs had similar separations (about 40″) and position angles, and the observations were separated in time by 3 hrs. The results of this test showed that the off-axis kernel was significantly different, although there was a common axis of symmetry aligned with the vector joining the PSF to its guide star (Figure 3). The guide star for the second PSF was about two magnitudes brighter than that for the first PSF, so the AO corrections may have differed in quality. More tests need to be made to establish which of time variability of the off-axis kernel or AO correction quality are more important, but this test at least allowed us to obtain some estimate of the uncertainty in the reconstructed PSFs.
In one case (SDSS 2323+0040) the quasar was sufficiently faint that inaccuracies in individual image registrations when constructing the final mosaic add significantly to the width of the effective PSF. Fortunately, the quasar is relatively faint compared to the host galaxy in this case, so the uncertainty in the exact amount by which the PSF was broadened translates to only a small error in the host galaxy magnitude. We estimated the uncertainty in the centroiding by comparing the centroid estimates used to combine the data with independent estimates using the iraf task radprof and estimates based on the peak pixel position. Both techniques suggested that the rms error in the centroiding was 0.05-arcsec in and , so we convolved synthesized PSF by a Gaussian with arcsec. Table 4 summarizes the QGS, PGS and PSF star FWHM.
6 Determination of host galaxy properties
6.1 Model-independent host properties
Before making a full model of the host plus quasar system, we obtained approximate constraints on the host magnitudes and scale-sizes by subtracting the PSF, scaled such that the residual was approximately flat in the center of the quasar host within a radius , and declined monotonically outside . The radius was chosen such that outside this radius the PSF residuals were small compared to the noise in the images. This technique, although somewhat subjective and resulting in a small oversubtraction of the nuclei, has the advantage that galaxy parameters are model independent. It also provides a good starting point for the full modeling, described below.
6.2 Modeling the host galaxies
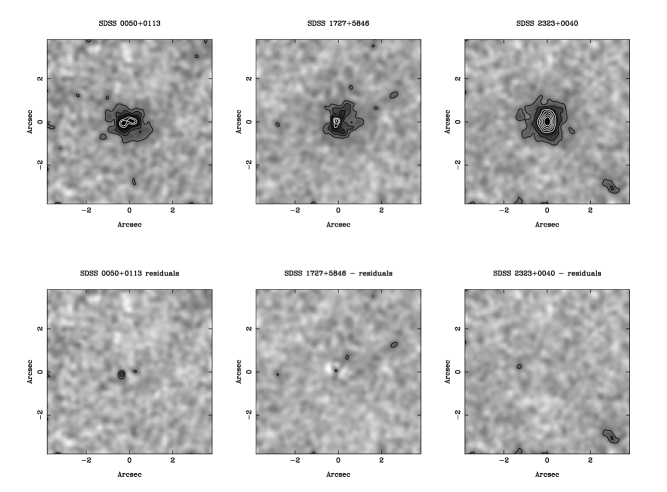
The host galaxies were modelled following the procedure in McLure, Dunlop & Kukula (2000) by fitting PSF plus galaxy model profiles (convolved by the PSF) by minimizing . Systematic errors from the PSF subtraction dominate the error budget close to the center; to prevent these regions dominating the fit, the inner 0.1-0.4 arcsec region was downweighted by factors of 0.5-0.7 to ensure that the surface was fairly uniform across the fitting aperture. We fitted the scale size and flux of the host galaxy model, and the flux and position of the nucleus. To obtain stable convergence, we fixed the host galaxy position angle and axial ratio using measurements of the outer isophotes of the “subtracted to flatness” hosts discussed above. Small adjustments in the background level were also found to be necessary at this stage to set the residual to zero at large radius. The host galaxies, after subtraction of the best-fitting PSF corresponding to the quasar nucleus, are shown in the top row of Figure 4, with the residuals after subtraction of the galaxy models shown below. Both elliptical and disk models were tried, but neither was a significantly better fit to the data. The results of the modeling are summarized in Table 5.
Errors in the magnitudes of the hosts were estimated by combining estimated errors from noise, systematics from PSF mismatch, and photometric errors. Errors in the magnitudes and scale sizes due to noise in the fitting were estimated by a bootstrap technique which involved randomly shuffling the pixel values in the residual image, adding back the model and refitting with a starting vector randomly changed by % in each fitted parameter (PSF scale, galaxy flux and half-light radius) from the best-fitting parameter set. This exercise was repeated 30 times for each quasar to estimate the error in the host galaxy magnitudes and scale sizes.
To estimate the size of the likely systematic error due to PSF mismatch, we tested the modeling code with a PSF rather than quasar data. We took the PSF for SDSS 2323+0040 and convolved it to the width of the PSF for SDSS 1727+5847. We then used the same modeling code as for the real quasars to fit to the PSF for SDSS 1727+5847 as if it were a quasar plus host galaxy system, using the convolved PSF of SDSS 2323+0040 as the PSF in the model. Constraining the half-light radius of the residual “host galaxy” to be between 0.1 and 1.2 arcsec, we estimated that errors due to PSF mis-match in this case were %. We also performed a similar test using our two PSFs from 2002 May 26 (UT). Again we scaled the results to SDSS 1727+5847, finding a residual with , i.e. a 17% flux error. The errors for the monotonic subtraction technique were smaller (%), as expected, as this estimate is less dependent on the nature of the PSF residuals close to the center of the host.
The error estimates for the quasar magnitudes were then constructed by adding in quadrature the estimated photometric error of 0.1 mag., the errors from the bootstrap modeling and an estimated error from PSF mis-match (0.2 mag. for SDSS 0050+0113 and SDSS 1727+5846, where the quasar flux dominates, and 0.1 mag. for SDSS 2323+0040 where the PSF and host fluxes are comparable). The errors for the scale sizes are those from the bootstrap procedure; as these scale sizes are most sensitive to regions of the fit away from the center, they are probably fair estimates.
6.3 Galaxy magnitudes and black hole masses
To calculate the absolute magnitudes of the host galaxies, and thereby obtain an estimate of their black hole masses by using the black hole mass – bulge luminosity relation, we first needed to estimate the -corrections from observed-frame -band to rest-frame -band. In order to do this, we assumed the host galaxies were ellipticals which formed at high redshift, . This is consistent with most known quasar hosts at low redshifts, and in any case the difference in -correction between a spiral and an elliptical host is only magnitudes. We will also assume the host galaxy parameters from the elliptical galaxy models (though again these are little different from those of the other models). The assumption that our hosts are ellipticals was more important when we tried to estimate the black hole masses from the galaxy luminosities; naturally we will have overestimated the black hole masses for disk-dominated systems if we assume our hosts are ellipticals. The example of low redshift AGN hosts suggests, however, that even those in spiral galaxies are mostly in early-type spirals, with high bulge fractions (Dunlop et al. 2001).
We used the elliptical galaxy model of Fioc & Rocca-Volmerange (1997) to make the -corrections. To calculate the black hole masses, we also needed to estimate the passive evolution of the stellar luminosity of the host galaxy in order to relate the host galaxies at to those in the local Universe, on which the black hole mass – bulge luminosity correlation is calibrated. Observations suggest elliptical galaxies fade by about one magnitude between and the present (e.g. Lubin & Sandage 2001). We again used the Fioc & Rocca-Volmerange predictions for their elliptical galaxy model, which results in a 0.9 mag. correction in -band at .
Black hole masses were estimated from the galaxy luminosities using the empirical relationship of van der Marel (1999), adapted to . Masses were also estimated using the FWHM of the Mgii emission line as described by McLure & Jarvis (2002). Absolute magnitudes and black hole mass estimates are given in Table 6.
7 Comments on individual objects
7.1 SDSS 0050+0113
This host is the most luminous galaxy in the sample, so was fairly easily detected despite its high redshift and the relatively short total integration time we obtained. Some PSF residual is visible in Figure 4, but extended host emission is clearly detected.
7.2 SDSS 1727+5846
This quasar is the only radio-loud quasar in our sample. It is also the least well-detected host, with clear PSF residual being visible in Figure 4, due to a combination of a relatively faint host and a bright quasar nucleus. The radio structure is slightly resolved in the Faint Images of the Radio Sky at Twenty-cm (FIRST) survey, with a size of 3″, a PA of 55 deg and a total flux density of 180 mJy; 30″ away at PA 43 deg there is an unresolved 22mJy source, which may be associated. The NRAO VLA Sky Survey (NVSS) flux density is 216 mJy, greater than the sum of the two candidate components in FIRST, suggesting that the quasar has additional diffuse emission which is resolved out in FIRST. The radio spectral index is from 151 MHz to 1.4 GHz, steepening to between 1.4 GHz and 5 GHz (where is defined in the sense that flux density, ). The radio morphology and low-frequency spectral index both suggest that the radio flux density is enhanced by Doppler boosting, though probably not by a factor of more than a few. Nevertheless, this may help to explain why this quasar has a relatively low-luminosity host and small black hole mass for a radio-loud quasar. The black hole mass from the emission line width may also be underestimated somewhat due to orientation effects if the broad-line region (BLR) is in the form of a disk perpendicular to the radio axis (Brotherton 1996).
7.3 SDSS 2323+0040
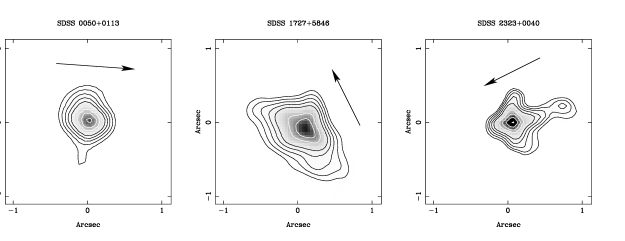
The host galaxy of this quasar was comfortably detected, largely due to the weakness of the quasar nucleus, and consequently has the best-determined magnitude and scale size. It is the only one of our quasar hosts to show evidence of interaction. There is a faint companion galaxy 1.4″ east of the quasar with faint emission between it and the quasar (Figure 4). In addition, there are other galaxies nearby, one 4.3″ to the southwest, and one 4.5″ to the south, though there is no clear evidence of interaction of either of these galaxies with the host.

8 Discussion
Our AO observations have proved successful at detecting hosts around three quasars. The accuracy of our host galaxy flux density measurements are, as expected, limited most by the accuracy of our PSFs. For our quasars, errors in the PSF have not been large enough to prevent us obtaining scientifically-useful results. It will, however, be necessary to make a better PSF calibration if we wish to study systems with significantly brighter quasars relative to their hosts, or higher redshift quasars where surface brightness dimming makes extended emission from the host harder to detect. This may simply involve taking more frequent PSF observations, or better matching the PSF star/PGS pair to the quasar/QGS pair, but it may turn out that better PSF calibration will require a different approach than the one described here.
Although a substantial improvement over the natural seeing at Lick was obtained through the use of adaptive optics, our resultant image quality is only comparable to the natural seeing at a first-class astronomy site such as Mauna Kea. Similar techniques could, however, be used at such sites to deliver even better quality images. One complication not addressed in this paper is that of altitude-azimuth mounted telescopes. In these, the component of the PSF due to the telescope optics rotates with the field, and thus will vary rapidly with time, though the off-axis component, determined by the atmosphere, should not be affected. How useful our technique would be for such telescopes will depend on the details of the optical system, although given that a large contribution to the PSF width comes from the off-axis component our technique may still be useful.
The magnitudes and scale sizes of the quasar hosts are comparable to the nine quasar hosts from the HST/NICMOS study of Kukula et al. (2001) (Figure 5), although our hosts are on average a little fainter. They are therefore closer to the predictions of Kauffmann & Haehnelt (2000). Though our sample is too small to make a definitive statement, if this trend continues to be seen in a larger sample, it may be a result of the SDSS quasar survey having fewer selection biases than conventional optical surveys. Previous optical surveys tended to select very blue quasars and are thus sensitive to small amounts of reddening in the host. One might therefore expect them to favour quasars in less dusty hosts, such as giant ellipticals.
A comparison between the black hole mass estimates from the galaxy luminosities and the Mgii linewidths shows that for SDSS 1727+5946 and SDSS 0050+0113, the agreement is very good, within a factor of two, but for SDSS 2323+0040 the black hole mass estimated from the linewidth is an order of magnitude less than that derived from the host. Dunlop et al. (2002) also find that their black hole mass estimates for quasars imaged with HST usually agree well, but a few objects also have order-of-magnitude discrepancies between black hole mass estimates, in the same sense, that the emission line estimates are too low. They ascribe these to disk-like broad-line regions being seen face-on. However, it is also true that the three most discrepant black hole mass estimates in the Dunlop et al. sample all show evidence for interactions, and include the two most spectacular mergers in their sample. SDSS 2323+0040 is also the only one of our hosts to show signs of interactions. Perhaps the bulge mass luminosity estimates in merger systems are too high. Possible reasons for this include a starburst in the merger system lowering the mass-to-light ratio of the stellar population, or a delay between the galaxy merger and the merger of the black holes of the two galaxies and the subsequent accretion of significant amounts of matter onto the merged black hole. Large differences between black hole mass estimates derived from emission-line widths and host bulge luminosities may thus be indicators of a quasar formed from a recent merger event. All our quasars are accreting at or below the Eddington rate using either black hole mass estimate.
The advent of large samples of quasars from the SDSS and the Anglo-Australian 2dF surveys means that significant numbers of quasars near bright AO guide stars have already become available. Even larger samples will be possible using laser guide stars. The image quality with laser guide stars will also be better as the AO corrections will be made on-axis. Thus we expect to be able to form statistically-useful samples of high quality quasar host images in the near future.
References
- (1) Bauman, B.J., Gavel, D.T., Waltjen, K.E., Freeze, G.J., Keahi, K.A., Kuklo, T.C., Lopes, S.K., Newman, M.J. & Olivier, S.S. 1999, Proc. SPIE Vol. 3762, 194
- (2) Brotherton, M.S., 1996 ApJS, 102, 1
- (3) Dunlop, J.S., McLure, R.J., Kukula, M.J., Baum, S.A., O’Dea C.P. & Hughes, D.H. 2001, MNRAS, submitted (astro-ph/0108397)
- (4) Elias, J.H., Frogel, J.A., Matthews, K. & Neugebauer G. 1982, AJ, 87, 1029
- (5) Elvis, M., et al. 1994, ApJS, 95, 1
- (6) Fan, X. 1999, AJ, 117, 2528
- (7) Ferrarese, L. & Merritt, D. 2000, ApJ, 539, L9
- (8) Fioc, M. & Rocca-Volmerange, B. 1997, A&A, 326, 950
- (9) Gebhardt, K., et al. 2000, ApJ, 543, L5
- (10) Gavel, D.T., Olivier, S.S., Baumann, B.J., Max, C.E. & Macintosh, B.A. 2000, Proc. SPIE Vol. 4007, 63
- (11) Hutchings, J.B., Crampton, D., Morris, S.L., Durand, D. & Steinbring E. 1999, AJ, 117, 1109
- (12) Kauffmann, G. & Haehnelt, M. 2000, MNRAS, 311, 576
- (13) Kukula, M.J., Dunlop, J.S., McLure, R.J., Miller, L., Percival, W.J., Baum, S.A. & O’Dea, C.P. 2001, MNRAS, 326, 1533
- (14) Lacy, M., Laurent-Muehleisen, S.A., Ridgway, S.E., Becker, R.H. & White, R.L. 2001, ApJ, 551, L17
- (15) Lloyd, J.P., Liu, M.C., Macintosh, B.A., Severson, S.A., Deich, W.T. & Graham, J.R. 2000, Proc. SPIE Vol 4008, 814
- (16) Lubin, L. & Sandage, A. 2001, AJ, 122, 1084
- (17) Márquez, I., Petitjean, P., Théodore, B., Bremer, M., Monnet, G. & Beuzit J.-L. 2001, A&A, 371, 97
- (18) McClure, R.D., Arnaud, J., Fletcher, J.M., Nieto, J.-L. & Racine, R. 1991, PASP, 103, 570
- (19) McLure, R.J., Dunlop, J.S. & Kukula, M.J. 2000, MNRAS, 318, 693
- (20) McLure, R.J. & Jarvis, M.J., 2002, MNRAS, submitted (astro-ph/0204473)
- (21) Richards G.T., et al. 2001, AJ, 121, 2380
- (22) Ridgway, S.E., Heckman, T.M., Calzetti, D. & Lehnert, M. 2001, ApJ, 550, 122
- (23) Rix, H.-W., Falco, E.E., Impey, C., Kochanek, C., Lehàr, J., McLeod, B., Muñoz & J., Peng, C. 2001, in ASP Conf. Ser. 237, Gravitational Lensing: Recent Progress and Future Goals, Brainerd, T.G. & Kochanek C.S. (San Francisco:ASP),
- (24) Steinbring, E., et al., 2002, PASP, in press (astro-ph/0207261)
- (25) Stockton, A., Canalizo, G. & Close, L.M. 1998, ApJ, 500, L121
- (26) Stoughton, C., et al. 2002, AJ, 123, 485
- (27) van der Marel, R.P. 1999, AJ, 117, 744
- (28) Yu, Q. & Tremaine, S. 2002, MNRAS, submitted (astro-ph/0203082)