X-ray spectroscopy of Carinae (catalog ) with XMM-Newton
Abstract
We present XMM-Newton observations of the luminous star Carinae (catalog ), including a high resolution soft X-ray spectrum of the surrounding nebula obtained with the Reflection Grating Spectrometer. The EPIC image of the field around Car (catalog ) shows many early-type stars and diffuse emission from hot, shocked gas. The EPIC spectrum of the star is similar to that observed in previous X-ray observations, and requires two temperature components. The RGS spectrum of the surrounding nebula shows K-shell emission lines from hydrogen- and helium-like nitrogen and neon and L-shell lines from iron, but little or no emission from oxygen. The observed emission lines are not consistent with a single temperature, but the range of temperatures observed is not large, spanning keV. We obtain upper limits for oxygen line emission and derive a lower limit of . This is consistent with previous abundance determinations for the ejecta of Car (catalog ), and with theoretical models for the evolution of massive, rotating stars.
1 Introduction
The massive, luminous star Carinae (catalog ) is famous for an extended outburst beginning in 1843, during which it temporarily became the second brightest star in the sky. This outburst gave rise to a bipolar optical nebula, obscuring the star from direct observation. Car (catalog ) is thought to be very massive (), and to lose mass at a rate of . For a general review of its history and properties, see Davidson & Humphreys (1997).
Einstein observations of Car (catalog ) showed it to be a complex X-ray source (Seward et al., 1979; Seward & Chlebowski, ; Chlebowski et al., 1984). Car (catalog ) has two X-ray emission components: hard, absorbed (), spatially unresolved emission coming from the star, and soft, extended emission coming from the nebula around the star. The Einstein observations also showed that there are many other X-ray sources in the field around Car (catalog ), and that there is diffuse X-ray emission with an extent of about a degree.
Ginga observations found evidence for iron K-shell emission from Car (catalog ) consistent with Fe XXV, indicating a thermal origin for the hard X-ray emission (Koyama et al., 1990). Corcoran et al. (1995) used ROSAT PSPC observations to show that the hard X-ray emission is variable.
ASCA observations obtained much higher quality spectra, and found evidence for a very strong N VII Ly feature, which was thought to result from the supersolar abundance of nitrogen in the ejecta (Tsuboi et al., 1997; Corcoran et al., 1998). This also was consistent with previous optical and UV spectroscopic observations of the ejecta around Car (catalog ) (Davidson et al., 1982, 1986).
Recent Chandra ACIS-I imaging observations have resolved Car (catalog ) spatially at the subarcsecond scale (Seward et al., 2001). The soft X-ray nebula shows complex structure with several knots of X-ray emission. Chandra HETGS observations have given us the first high resolution X-ray spectrum of the star, showing that the hard emission is non-isothermal, with emission lines from H- and He-like iron, calcium, argon, sulfur, and silicon (Corcoran et al., 2001).
In this paper, we report the results of XMM-Newton observations of Car (catalog ), including the high resolution soft X-ray spectrum obtained with the Reflection Grating Spectrometer (RGS) (den Herder et al., 2001). Until now, no X-ray observatory has been able to obtain high resolution soft X-ray spectra of extended sources. RGS has a spectral resolution of about 0.1 Å for the 1’ nebula of Car (catalog ), or at 20 Å. This is important in the case of Car (catalog ), because we can study the physical state of the X-ray nebula in detail, and obtain much more accurate elemental abundance measurements than with a CCD spectrometer. We also present the EPIC image of the field and the CCD spectrum of Car (catalog ).
2 Observation and Data Analysis
Car (catalog ) was observed with XMM on 2000 July 27-28 for a total of 50 ks, split into two nearly consecutive observations. The EPIC-MOS1 (Turner et al., 2001) and EPIC-pn (Strüder et al., 2001) cameras were operated in full-frame mode, and MOS2 was operated in small window mode. All of the EPIC cameras used the thick filter. Due to the optical brightness of Car (catalog ), the Optical Monitor was blocked.
The EPIC data were processed with SAS version 5.3.0, and the RGS data were processed with a development version of the SAS (xmmsas_20011104_0842-no-aka). Standard event filtering procedures were followed for RGS and EPIC. Times with high particle background levels were filtered out, leaving 45.9 ks of usable RGS exposure and 39.5 ks of EPIC exposure.
Car (catalog ) is somewhat piled up in MOS1, but not in MOS2 or pn. The count rate of Car (catalog ) in MOS2 was . Because it has moderately higher spectral resolution than pn, we use only MOS2 for spectroscopy. The canned MOS2 response matrix appropriate for standard MOS event grade selection was used (e.g. ). A background region as free as possible of sources and diffuse X-ray emission was chosen for the MOS2 spectral analysis.
2.1 EPIC spectral and imaging analysis
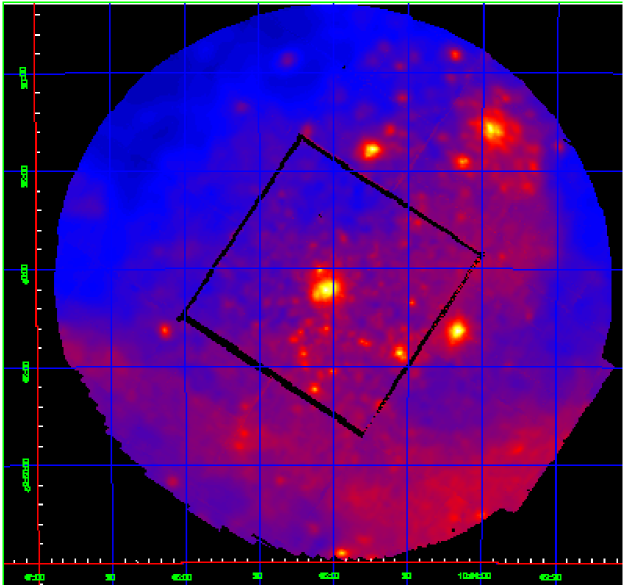
The smoothed, exposure corrected EPIC-MOS image in the 0.3-2.5 keV band is shown in Figure 1. It includes data from both MOS cameras. Car (catalog ) is clearly visible in the center, and several bright stars are also present, including WR 25 and several O-type stars. There is also substantial emission from either unresolved point sources or diffuse gas. This emission is a substantial X-ray (non-particle) background contaminant to the RGS spectrum, as discussed below.
The EPIC-MOS2 spectrum of Car (catalog ) is shown in Figure 2. It is similar to the Chandra HETGS spectrum (Corcoran et al., 2001). There are a number of strong emission lines, including K-shell lines of hydrogenic and helium-like Si, S, Ar, Ca and Fe. There is also an iron K fluorescence line from neutral iron in the optical nebula. As found using the Chandra HETGS spectrum, a two temperature model gives a significantly better fit to the EPIC MOS spectrum than a one temperature model. We only fit the data from in order to include only emission from the star and to exclude emission from the nebula. The results of the fit are shown in Table LABEL:tabepic; abundances are quoted relative to solar (Anders & Grevesse, 1989). We assume a distance of 2.3 kpc in determining the luminosity (Davidson & Humphreys, 1997).
Table LABEL:tabepic also shows that Si, S, Ar and Fe are marginally underabundant, although the relative ratios are close to solar. Corcoran et al. (2001) found that S is marginally overabundant, while Si and Fe were solar within the errors. However, the inferred abundances may have systematic errors as a result of fitting a two temperature model to what is likely a continuous distribution of temperatures (for the both the Chandra and the EPIC data).
The unabsorbed luminosity is about the same compared to the epoch of the Chandra observation. The equivalent width of the neutral iron K fluorescence feature is 64 eV, compared to 39 eV at the time of the Chandra observation, but still lower than the lowest EW observed with ASCA (Corcoran et al., 2000).

| () | |
|---|---|
| Temperature 1 (keV) | |
| (unabsorbed) | |
| () | |
| Temperature 2 (keV) | |
| (unabsorbed) | |
| Si | |
| S | |
| Ar | |
| Ca | |
| Fe | |
| EW Fe (6.4 keV) | eV |
| 1.11 (351 dof) |
2.2 RGS spectral analysis
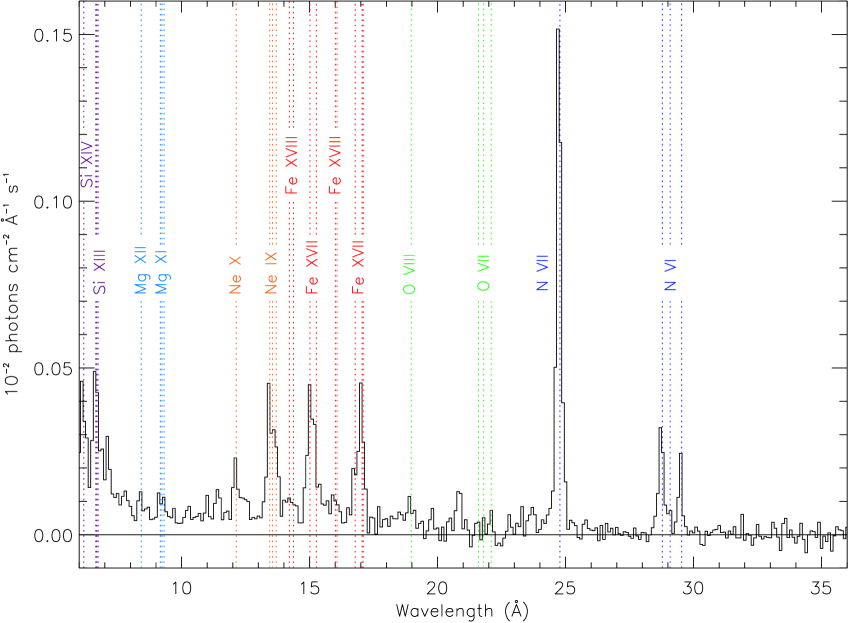
The RGS spectrum is shown in Figure 3. It is background subtracted and corrected for effective area, as described below. It shows emission lines from helium-like and hydrogen-like neon and nitrogen, and also Fe XVII and XVIII. These lines all originate from the nebula, in contrast with the higher energy emission from the star. There is no obvious emission from oxygen, from which one would expect prominent emission lines, given the range of temperatures implied by the presence of the other emission lines. There is also no obvious emission from charge states of iron higher than Fe XVIII. Fe XIX would be harder to see, as the brightest emission line would lie at Å, which would be indistinguishable from Ne IX at this resolution; however, if a substantial amount of Fe XX emission was present, a strong emission line would be present at Å. There is also no evidence for detectable continuum emission. Thermal bremsstrahlung is less prominent relative to line emission at temperatures around 0.5 keV than at higher temperatures. Thus, from inspection it is clear that although the plasma is not isothermal, the range of temperatures present is limited, and also that the abundance of nitrogen is supersolar while that of oxygen is subsolar.
There are also emission lines from helium-like and hydrogen-like magnesium and silicon, but these originate from the point source, with the possible exception of Mg XI. This is known from the Chandra HETGS spectrum (Corcoran et al., 2001), which does not include emission from the nebula and shows emission from all of these lines. The RGS cross-dispersion profiles of these emission lines are consistent with point-like emission. The cross-dispersion profile of Mg XI is also consistent with extended emission, so its origin is unclear. Those emission lines are physically associated with emission extending to much higher energies than are accessible with RGS, so we do no attempt to model them in the analysis presented below.
Two main complications are encountered in the analysis of these RGS data. First, the X-rays come from an extended source, and second, there is a substantial background flux of soft X-rays which are diffuse or unresolved, and which originates over essentially the entire spatial field of view of RGS. These diffuse/unresolved X-rays presumably come from the many OB stars in the field of view, and from truly diffuse, hot, shocked gas. The diffuse emission affects all wavelengths, but the most severe confusion occurs in the wavelength range Å. This is because the diffuse gas and unresolved point sources have substantial iron L-shell and O VIII emission, and also because the column density is high enough to absorb most of the diffuse emission at long wavelengths.
Because the soft X-ray emission is extended, the spectral and spatial information are inherently coupled. A Monte Carlo simulation can be a useful data analysis technique in this case (Peterson et al., 2002). This is not a feasible approach for this observation because there is no way to reproduce the diffuse/unresolved background component with a simple model. Background subtraction is also an issue, because the background point sources and diffuse emission could have different spectra, and are not uniformly distributed on the sky. In practice, the background spectrum produced by a segment of the data offset from Car (catalog ) in cross-dispersion coordinates is fairly constant. The RGS 1 count rate spectra from the source and background cross-dispersion regions are shown in figure 4 to demonstrate this, although there are differences in the crucial region around O VIII Ly . The adopted procedure is to produce a background subtracted spectrum which includes an assessment of the systematic error caused by the background subtraction. We estimate the potential systematic error to be 25% of the background strength in a given wavelength bin. This systematic error is most important in low flux lines with high background, e.g. O VII and VIII.
Using this method, we then measure emission line strengths by taking the total flux in the neighborhood of the line, taken to be within 0.3 Å of the rest wavelength. Because the bremsstrahlung continuum emission is weak compared to line emission in the inferred temperature range, this does not produce a substantial overestimate of the line fluxes. For a few important emission lines, one expects strong emission from other ions at about the same wavelength, which would lead to an overestimate of the line strength. The most important correction is to Ne X Lyman , which is at roughly the same wavelength as the strongest 4d-2p transitions in Fe XVII. A correction is made based on the observed 3-2 transitions in Fe XVII.
A Monte Carlo simulation of the RGS effective area is used together with the measured source counts to obtain the emission line fluxes. Archival Chandra ACIS-I imaging observations of Car (catalog ) are used to provide a spatial distribution for soft photons. The sky coordinates of photons with energy below 1.2 keV are used as a spatial event list for the Monte Carlo simulation. We assume that the spatial distribution does not vary as a function of energy, and that the exposure map is approximately constant over the 1 arcmin size of the nebula. Actual exposure variations are at or below the 1% level.
Figure 5 shows the RGS 2 cross-dispersion image of the N VII Lyman line, including all photons within 0.3 Å of the rest wavelength, plotted together with the Monte Carlo cross-dispersion image using the Chandra data. The profiles are slightly different, which indicates that there is some variation in the image of the nebula at different temperatures. For comparison, Figures 6 and 7 show the cross-dispersion images of O VIII Ly and O VII He respectively. A more detailed discussion of the significance of these features follows below.
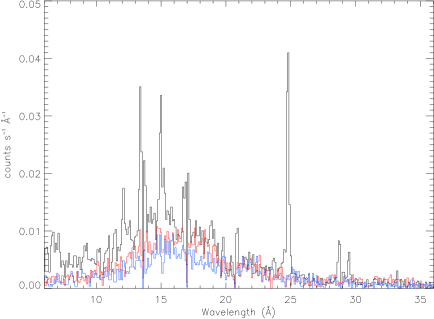
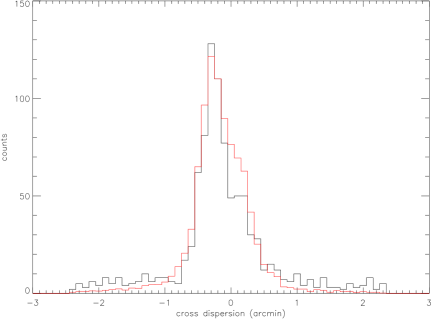


Table LABEL:TabFlux gives the measured line fluxes for the major emission line complexes in the RGS spectrum of Car (catalog ). It also gives the intrinsic line fluxes, which correct for interstellar absorption, and in the case of Ne X Lyman for the Fe XVII 4d-2p lines.
Because the continuum flux in the soft X-ray spectrum is negligible, it is not possible to measure neutral edge strengths or the equivalent neutral hydrogen column density with RGS. The column density used in the X-ray literature for Car (catalog ) is (Seward et al., 1979). This value comes from three sources. The first is a fit to the low resolution IPC spectrum, giving a value of . The second is the Savage et al. (1977) measurement of UV H I and absorption to a somewhat nearby star, HD 92740 (= WR 22), for which N(H I + ). The last is the conversion of the optical extinction to neutral hydrogen column density using the relations of Gorenstein (1975) and Ryter, Cesarsky & Audouze (1975). Stars near to Car (catalog ) have (Feinstein, Marraco & Muzzio, 1973), so the column density obtained is . Other measurements of to nearby stars yield similar results to Feinstein, Marraco & Muzzio (1973) (Herbst, 1976; Forte, J. C., 1978).
Of these methods, we cannot rely on the first, as the fitting procedure is degenerate even for the high resolution RGS spectrum, and the second is also unsatisfactory, as HD 92740 is too far away from Car (catalog ) to expect the column density to be the same. The third method is also problematic, as the extinction to Tr 16 is anomalous and variable. The extent to which it is anomalous is controversial, with different works obtaining values of ranging from 3.2 to 5.0 for different stars in Tr 16 and in the vicinity of Car (catalog ) (Feinstein, Marraco & Muzzio, 1973; Herbst, 1976; Forte, J. C., 1978; Turner & Moffat, 1980; Thé & Groot, 1983; Tapia et al., 1988; Thé & Graafland, 1995). This implies that the relations of Gorenstein (1975) and Ryter, Cesarsky & Audouze (1975) underestimate the total column density, since they take . However, these relations should at least provide a lower limit to . In their review, Davidson & Humphreys (1997) adopt a value of for the interstellar (non-circumstellar) extinction to Car (catalog ). Using the Gorenstein (1975) relation, we obtain . Also, as an alternative to the Savage et al. (1977) measurement, we can use the Diplas & Savage (1994) measurement of the H I column towards HD 303308, which is much nearer to Car (catalog ) than HD 92740. They find . This can also be considered a lower limit, as a substantial fraction of the hydrogen may be ionized. For simplicity we will take the equivalent hydrogen column density to be , and assess the systematic effects of a higher column on the temperature distribution and abundance measurements.
There is no evidence for emission from O VII He . Although there is no strong emission line corresponding to O VIII Lyman , there is a marginal detection of flux at this wavelength, and a small line-like feature. Because O VIII Ly is so weak in this spectrum, and because it is one of the stronger features in spectra of typical O-type stars and collisionally ionized plasmas in general, the question of contamination by nearby sources is important to address. It is possible that some or all of the observed O VIII Ly flux is attributable to a nearby star. HD 303308 is the brightest object close enough to cause confusion. If this star was the source of the apparent O VIII feature, it would have an apparent wavelength of 18.9 Å (slightly blueshifted), and it would be about 1 arcmin east of the bright knot seen in the southwest of the Chandra image. The observed RGS feature is inconsistent with this requirement. In addition, the O VIII flux obtained from a two temperature thermal plasma model fit to the EPIC-MOS spectrum is , compared with for Car (catalog ). Thus, it seems unlikely that any point source can account for the O VIII feature in Car (catalog ). However, O VIII Ly is only detected at the 2 level, so the detection is not very secure.
We do not use the data to obtain an upper limit to the C VI emission. The high column density would make any upper limit a weak one, and the fact that we expect a very low carbon abundance means that the more easily measurable oxygen abundance provides a stronger physical constraint on the nucleosynthetic signatures of the CNO cycle.
In Figure 8 we plot the emission measure inferred for individual emission line complexes assuming a single temperature. For each ion, the error bar is marked at the temperature of maximum line strength. The abundances are taken to be solar (Anders & Grevesse, 1989), except nitrogen and oxygen. The abundance of nitrogen is assumed to be 11 times solar, which is approximately the sum of the solar abundances of carbon, nitrogen, and oxygen. The abundance of oxygen is chosen to have a value such that O VII and N VII are consistent, as discussed below. It is clear that a single temperature cannot account for the different species observed. Furthermore, the lack of emission from Fe XX shows that there cannot be a substantial amount of plasma at temperatures above 0.6 keV (7 MK). The presence of N VI emission shows that there must be emission from temperatures down to at least about 0.15 keV (1.7 MK), but emission at lower temperatures is unconstrained; there are no spectral features we would expect to see if lower temperatures were present, given the probable low carbon abundance and high column density.
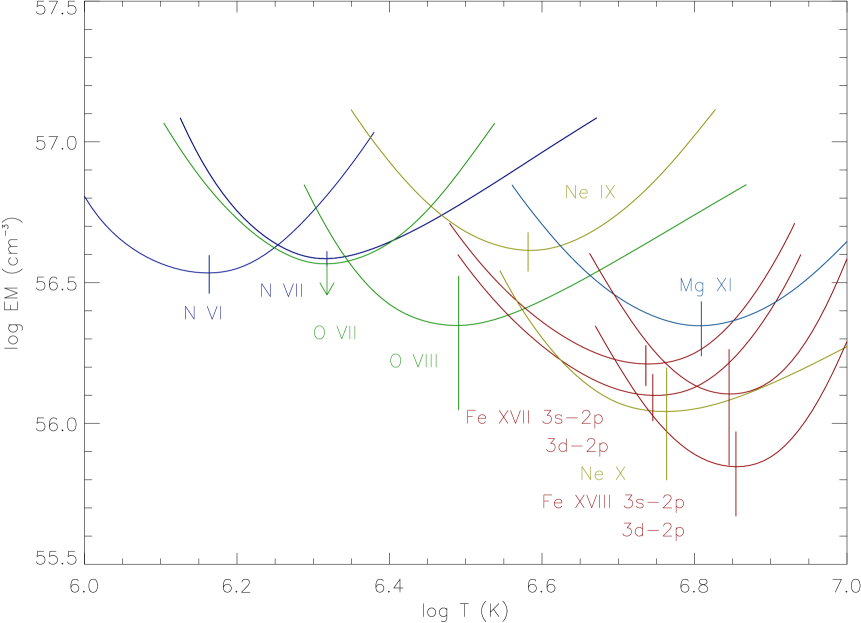
Because the strength of the N VII and O VII lines have very similar temperature dependence, especially near the temperature of maximum line strength (), one may derive an upper limit to the abundance ratio by setting the oxygen abundance such that the curves in the plot are consistent near . This is possible because we know that there is no emission from high temperatures, where the relative flux of N VII and O VII has a substantial temperature dependence. The same is true for Fe XVII and Ne X. We measure a lower limit , while Fe/Ne is consistent with the solar ratio (Anders & Grevesse, 1989) to 0.1 dex. The error introduced by directly comparing ion emission measures assuming a single temperature is less than 0.1 dex. If we allow that the column density assumed could be , the lower limit to N/O becomes . Although it is possible that the column density is higher than that, this uncertainty clearly cannot affect the N/O lower limit very strongly.
Alternatively, if we take the O VIII detection at face value and fix the oxygen abundance by requiring that the differential emission measure should not have a dip at , the N/O ratio is increased by about 0.2 dex from our lower limit, to .
The appearance of the ion emission measure plot is moderately affected by the set of reference abundances chosen. The most recent work on solar abundances (Grevesse & Sauval, 1998; Holweger, 2001; Allende Prieto, Lambert & Asplund, 2001, 2002) have substantial variations relative to each other and Anders & Grevesse (1989) in the abundances of CNO and Fe. These variations are of order 0.1 dex. Given the levels of uncertainty in the measurements themselves and in the abundances, the plot is consistent with a differential emission measure which is flat from , declining substantially to . In any case, the measurement of the ratio N/O is unaffected by the choice of reference abundances.
The shape of the emission measure distribution would be affected if the column density were substantially higher than . Rather than looking flat, with a dropoff at high temperatures, it would be decreasing with increasing temperature.
Mg XI has also been included in the plot. For this point to be consistent with the rest of the plot, we would have to take the abundance of magnesium to be at least 0.3 dex higher than iron and neon. While this is not out of the question, there is no good reason to have an overabundance of only magnesium (which would have no relation to CNO cycle abundance changes if it were real). The most likely explanation is that Mg XI emission comes from the star rather from the nebula. There is also evidence for a feature at about 7.85 Å, the wavelength of Mg XI He . This feature is strong compared to Mg XI He , as would be expected for the high column density observed in the spectrum of the star. This is also similar to the Mg XII Ly to ratio observed with Chandra (Corcoran et al., 2001).
| Line | Flux | Intrinsic Flux |
|---|---|---|
| () | () | |
| Mg XI He | ||
| Ne X Ly | ||
| Ne IX He | ||
| Fe XVIII 3d-2p | ||
| Fe XVIII 3s-2p | ||
| Fe XVII 3d-2p | ||
| Fe XVII 3s-2p | ||
| O VIII Ly | ||
| O VII He | ||
| N VII Ly | ||
| N VI He |
3 Discussion
There are two main results from the analysis of the RGS spectrum of Car (catalog ). The first is a constraint on the range of temperatures in the nebula (), which allows us to infer shock velocities for the expansion of the ejecta into the surrounding medium. The second is a lower limit on the nitrogen to oxygen abundance ratio (). This allows us to constrain the evolution of Car (catalog ).
3.1 Temperature distribution
The upper end of the temperature distribution is strongly constrained by the Fe L-shell spectrum. The lack of measureable emission from charge states higher than Fe XVIII rules out the presence of appreciable quantities of gas above . The lower end of the distribution appears to be flat, based on the emission from Ne IX, N VII and N VI. However, there are no other potentially observable spectral lines originating from ions that exist at lower temperatures than N VI, so the emission measure distribution cannot be constrained below about 0.2 keV. Davidson et al. (1982, 1986) find UV emission lines from N I through N V in the spectra of the ejecta, so there is certainly a range of temperatures present. As noted in the previous section, a substantial difference between the assumed absorption and the real absorption could change the overall shape of the emission measure distribution, especially at low temperatures.
Weis et al. (2001a) attempt to correlate the observed projected velocity of optical blobs which are spatially coincident with X-ray emission using Hubble Space Telescope and ROSAT HRI images. The velocities they find in the brightest X-ray regions would produce plasma at temperatures an order of magnitude higher than observed, assuming that the ejecta was colliding with a stationary ISM. Of course, Car (catalog ) should be surrounded by a wind blown bubble out to much larger radii than 0.3 pc (the radius of the X-ray nebula), and the material inside the bubble should be streaming outward. It seems likely that the observed shock temperature reflects the velocity at which the X-ray emitting ejecta are overtaking the previously emitted stellar wind. The temperature range implies a shock velocity range of . If the X-ray emitting ejecta date from the great eruption of 1843, then the rough expansion velocity for a free expansion is , so the velocity of the stellar wind before the great eruption was .
3.2 Abundance measurements
The N/O ratio observed in the ejecta has implications for the evolution of Car (catalog ). It is clearly a signature of CNO processing, and the degree of conversion of oxygen to nitrogen observed in the ejecta is high.
All massive main-sequence stars burn hydrogen on the CNO cycle. Its nucleosynthetic signatures are the conversion of most of the catalytic carbon and oxygen to nitrogen, and the burning of H into He. For CNO processed material to be observed on the surface of these stars, or in their ejecta, it must be transported there from the core.
Previous measurements of N/O in Car (catalog ) give similar but generally less constraining results than our RGS measurements. Optical and UV spectroscopy of the S condensation (corresponding spatially roughly to the brightest X-ray knot (Seward et al., 2001)) shows that most CNO is nitrogen and that the helium mass fraction is (Davidson et al., 1982, 1986). A quantitative measurement of the CNO abundance ratios is not made because of their dependence on ionization and thermal structure, and also because some oxygen and carbon may be in solid grains. It should be noted that the measured value of the helium mass fraction may be systematically too low if the ionization balance of helium was not properly modelled.
More recent measurements of the abundances in the S condensation have been made by Dufour et al. (1997) with HST-FOS. They report CNO and He abundances for the S2 and S3 “sub-condensations”, respectively, of , , and . They did detect weak oxygen and carbon lines, but treated them as upper limits due to potential contamination from the foreground H II region. However, they also find that preliminary analysis of the S1 and S4 sub-condensation spectra show much lower N and He enrichment, with correspondingly lower N/O and N/C ratios.
Previous X-ray observations (Tsuboi et al., 1997; Corcoran et al., 1998; Seward et al., 2001; Weis et al., 2001b) have shown the presence of a strong N VII Ly feature in the spectrum, but the CCD spectra lacked the resolution to strongly constrain the O VII and O VIII features. Our measurement of N/O is not limited by the spectral resolution of RGS, but rather by source/background contamination, and the observed line strength is not influenced by the formation of dust grains or large uncertainties in the temperature distribution of the plasma.
Recent HST-STIS long-slit spectroscopy of the central star have obtained a lower limit of (Hillier et al., 2001). This is a conservative interpretation of the data; the lower limit could easily be taken to be an order of magnitude higher. On the other hand, UV spectra taken with HST-GHRS show evidence for moderate carbon depletion which may be inconsistent with the level of depletion found in the ejecta (Lamers et al., 1998). In light of recent work indicating that Car (catalog ) may be a binary system (Damineli, 1996; Damineli et al., 2000), the apparent contradiction in the stellar and nebular abundances is taken to be an indication that the star producing the carbon features is actually the secondary (assuming the star that produced the nebula is the primary). Walborn (1999) points out that there are several difficulties with this conclusion, the most obvious being the concealment of the luminous blue variable (LBV) primary.
Spectroscopic measurements of the abundances of the central star cannot invalidate the RGS abundance measurements, but the binary scenario requires us to treat the nebular abundances with some care. It is unlikely that both members of a binary system could contribute substantially to the ejecta around Car (catalog ), but it is possible, in principle, that the ejecta from the primary could mix with the wind of the secondary. If both stars had a high N/O ratio, but substantially different helium abundances, then it would be possible to misinterpret the significance of the nebular abundances. However, this is not a likely scenario, so we make the simplest assumption, which is that the observed nebular abundances reflect the current surface abundances of the primary.
The signatures of CNO processing have been observed in various types of hot stars, including OBN stars, blue supergiants, and LBVs (Maeder, 1995). However, CNO processed material is not observed on the surface of all hot stars, and the amount of processed material observed spans a wide range. The fact that N/O is so high in the ejecta of Car (catalog ) is strongly constraining, regardless of the mechanism responsible for mixing.
The two most plausible mechanisms which could have resulted in the measured abundances in the ejecta of Car (catalog ) are : 1.) Car (catalog ) is on the main sequence and is rotating. This rotation has caused very thorough mixing. 2.) Car (catalog ) is in a post-red-supergiant blue supergiant phase, and the CNO abundance ratios are a result of the onset of convection in the envelope during the red supergiant phase. We refer in particular to the discussion in Lamers et al. (2001), which deals with the same question in the case of other LBV nebulae. We can use the measured N/O ratio in conjunction with the He abundance of Davidson et al. (1986) to assess the plausibility of these two mechanisms.
Using Figure 3 of Lamers et al. (2001) for the case of an star with , we find that for , , or . This simply reflects the fact that although a high surface ratio of N/O can be obtained in the red supergiant phase, this can only happen if the star lost enough of its envelope on the main sequence to allow core processed material to dominate the resulting composition. This value of Y is not consistent with the Davidson et al. (1986) measurement of , although a conservative assessment of the possible errors, particularly in measuring the helium mass fraction, does not allow us to rule out that Car (catalog ) could be a post-red-supergiant object.
Meynet & Maeder (2000) make predictions for the abundances of rotating massive stars. Their model with an initial rotation velocity of and a mass of predicts and at the end of H-burning. While this value of Y is also not consistent with the observed value, in this case Y will clearly be lower earlier in the life of the star, whereas if the mixing is efficient enough, N/O will already be high enough to be consistent with the measured lower limit. This is an important point; the conversion of oxygen to nitrogen in CNO burning is considerably slower than the conversion of carbon to nitrogen. If rotational mixing is responsible for the observed abundances, the mixing timescale must be short compared to the evolutionary timescale. As pointed out in Maeder (1987), the ratio of the mixing timescale to the main sequence lifetime in rapidly rotating stars is indeed expected to decrease with increasing mass.
3.3 Summary
We have analyzed XMM-Newton X-ray spectra of Car (catalog ). The EPIC spectral data from the star are consistent with past observations by ASCA and Chandra. The data are not consistent with an isothermal plasma, but require at least two temperatures.
The RGS spectra show that the nebula is nonisothermal and has strongly non-solar CNO abundances. The temperature range in the nebula is . If this is interpreted as a shock velocity, it corresponds to . We find a lower limit of , which is indicative of very thorough mixing in the envelope of Car (catalog ). Taken with previous measurements of the surface helium abundance , this implies that Car (catalog ) is a main-sequence object with some strong mixing mechanism at work, although it does not decisively rule out the possibility that it is a post-red-supergiant object.
References
- Allende Prieto, Lambert & Asplund (2001) Allende Prieto, C., Lambert, D. L., & Asplund, M. 2001, ApJ 556, L63
- Allende Prieto, Lambert & Asplund (2002) Allende Prieto, C., Lambert, D. L., & Asplund, M. 2002, astro-ph/0206089
- Anders & Grevesse (1989) Anders, E., & Grevesse, N. 1989 Geochim. Cosmochim. Acta 53, 197
- Chlebowski et al. (1984) Chlebowski, T., Seward, F. D., Swank, J., & Szymkowiak, A. 1984, ApJ 281, 665
- Corcoran et al. (1995) Corcoran, M. F., Rawley, G. L., Swank, J. H., & Petre R. 1995, ApJ 445, L121
- Corcoran et al. (1998) Corcoran, M. F., Petre, R., Swank, J. H., et al. 1998, ApJ 494, 381
- Corcoran et al. (2000) Corcoran, M. F., Fredericks, A. C., Petre, R., Swank, J. H., & Drake, S. A. 2000, ApJ 545, 420
- Corcoran et al. (2001) Corcoran, M. F., Swank, J. H., Petre, R., et al. 2001, ApJ 562, 1031
- Damineli (1996) Damineli, A. 1996, ApJ 460, L49
- Damineli et al. (2000) Damineli, A., Kaufer, A., Wolf, B., Stahl, O., Lopes, D. F., & de Araujo, F. X. 2000, ApJ 528, L101
- Davidson et al. (1982) Davidson, K., Walborn, N. R., & Gull, T. R. 1982, ApJ 254, L47
- Davidson et al. (1986) Davidson, K., Dufour, R. J., Walborn, N. R., & Gull, T. R. 1986, ApJ 305, 867
- Davidson & Humphreys (1997) Davidson, K., & Humphreys, R. M. 1997, ARA&A 35, 1
- Diplas & Savage (1994) Diplas, A., & Savage, B. D. 1994, ApJS 93, 211
- Dufour et al. (1997) Dufour, R. J., Glover, T. W., Hester, J. J., Currie, D. G., van Orsow, D., & Walter, D. K. 1997, ASP Conf. Ser. 120, Luminous Blue Variables: Massive Stars in Transition, ed. A. Nota & H. J. G. L. M. Lamers, p. 255
- Feinstein, Marraco & Muzzio (1973) Feinstein, A., Marraco, H. G., Muzzio, J. C. 1973, A&AS 12, 331
- Forte, J. C. (1978) Forte, J. C. 1978, AJ 83, 1199
- Gorenstein (1975) Gorenstein, P. 1975, ApJ 198, 95
- Grevesse & Sauval (1998) Grevesse, N., & Sauval, A. J. 1998, Space Sci. Rev. 85, 161
- Herbst (1976) Herbst, W. 1976, ApJ, 208, 923
- den Herder et al. (2001) den Herder, J. W., et al. 2001, A&A 365, L7
- Hillier et al. (2001) Hillier, D. J., Davidson, K., Ishibashi, K., & Gull, T. 2001, ApJ553, 837
- Holweger (2001) Holweger, H., 2001, Joint SOHO/ACE workshop Solar and Galactic Composition, AIP Conf. Proc. 598, ed. R. F. Wimmer-Schweingruber, p. 23
- Koyama et al. (1990) Koyama, K., Asaoka, I., Ushimaru, N., Yamauchi, S., & Corbet, R. H. D. 1990, ApJ 362, 215
- Lamers et al. (1998) Lamers, H. J. G. L. M., Livio, M., Panagia, N., Walborn, N. R. 1998, ApJ 505, L13
- Lamers et al. (2001) Lamers, H. J. G. L. M., Nota, A., Panagia, N., Smith, L. J., & Langer, N. 2001, ApJ 551, 764
- Maeder (1987) Maeder, A. 1987, A&A 178, 159
- Maeder (1995) Maeder, A. 1995, Astrophysical applications of stellar pulsation, ASP Conf. Series 83, eds. R. S. Stobie & P. A. Whitelock, p. 1
- Meynet & Maeder (2000) Meynet, G., & Maeder, A. 2000, A&A 361, 101
- Peterson et al. (2002) Peterson, J. R., Jernigan, J. G., & Kahn, S. M. 2002, Proc. SPIE submitted
- Ryter, Cesarsky & Audouze (1975) Ryter, C., Cesarsky, C. J., & Audouze, J. 1975, ApJ 198, 103
- Savage et al. (1977) Savage, B. D., Bohlin, R. C., Drake, J. F., & Budich, W. 1977 ApJ 216, 291
- Seward et al. (1979) Seward, F. D., Forman, W. R., Giacconi, R. et al. 1979, ApJ 234, L55
- (34) Seward, F. D., & Chlebowski, T. 1982, ApJ 256, 530
- Seward et al. (2001) Seward, F. D., Butt, Y. M., Karovska M., et al. 2001, ApJ 553, 832
- Strüder et al. (2001) Strüder, L., et al. 2001, A&A 365 L18
- Tapia et al. (1988) Tapia, M., Roth, M., Marraco, H., Ruiz, M. T. 1988, MNRAS 232, 661
- Thé & Groot (1983) Thé, P. S., & Groot, M. 1983, A&A 125, 75
- Thé & Graafland (1995) Thé, P. S., & Graafland, F. 1995, Rev Mex AA 2, 75
- Tsuboi et al. (1997) Tsuboi, Y., Koyama, K., Sakano, M., & Petre, R. 1997, PASJ 49, 85
- Turner et al. (2001) Turner, M. J. L., et al. 2001, A&A 365, L27
- Turner & Moffat (1980) Turner, D. G., & Moffat, A. F. J. 1980 MNRAS 192, 283
- Walborn (1999) Walborn, N. R. 1999, Eta Carinae at the Millenium, ASP Conf. Series 179, eds. J. A. Morse, R. M. Humphreys, & A. Damineli, p. 110
- Weis et al. (2001a) Weis, K., Duschl, W. J., & Bomans, D. J. 2001a, A&A 367, 566
- Weis et al. (2001b) Weis, K., Corcoran, M. F., & Davidson, K. 2001b, astro-ph/0108427