A new measurement of zinc metallicity in a DLA at z 3.351
Abstract
We present chemical abundance measurements in the Damped Lyman- (DLA) system observed in the UVES spectrum of the BAL quasar BR 11171329. We measure a neutral hydrogen column density atoms cm-2 and derive mean abundances relative to solar: , , , , , , and . This is the third measurement of Zn, an element mildly depleted onto dust grain, at . The iron to zinc and chromium to zinc ratios, and demonstrate that the absorber has a low dust content. The nitrogen ratio suggests that the “secondary” N production process is taking place in this DLA. Finally, this absorber does not seem to present a convincing -enhancement as shown by the over Fe-peak element ratios: , and .
keywords:
galaxies: abundance – galaxies: high-redshift – quasars: absorption lines – quasars: individual: BR 11171329PACS:
PACS code1 Introduction
The chemical abundances of the highest H I column density quasar absorbers ( atoms cm-2), the Damped Lyman- systems (DLAs), are commonly expressed using column density weighted measurements. They are used as observational tracers of the cosmological evolution of metallicities, up to very high redshifts (see for example Pettini et al. 1994, 1997; Lu et al. 1996; Prochaska & Wolfe 1999, 2000, 2001; Dessauges-Zavadsky et al. 2001; Ledoux, Bergeron & Petitjean 2002 and references therein). However, recent studies give somehow surprising results: Prochaska & Wolfe (2002) claim no evolution of the mean weighted iron metallicity over the redshift range , in contradiction with predictions from essentially all chemical evolution models. A possible explanation for this result is that iron is not the optimal element for tracing metals on cosmological scales, because it is easily depleted onto dust grains. Dust depletion greatly complicates the interpretation of the metal content of DLAs. Nevertheless at very high-redshift (), there are evidences that [Fe/H] is beginning to fall, in such a way that at the metallicity is substantially lower than at (Prochaska, Gawiser & Wolfe 2001, Songaila & Cowie 2002).
Pettini et al. (1994) estimated the dust content of DLAs with the help of a comprehensive survey of Zn measurements, an element which is known to be only slightly depleted onto dust grains, and thus provide an unbiased tracer of metallicities. However such measurements are challenging because of both the paucity and weakness of Zn features in quasar absorbers. At the moment, only two measurements of [Zn/H] have been made in DLAs at z3 (Molaro et al. 2000, Levshakov et al. 2001). Here, we present a third detection of Zn in a DLA at z3.35, thus providing clues on the dust-free abundance determination in high-redshift Damped Lyman- systems. We first detail the observational set-ups and data reduction processes of the quasar spectrum. We then present the analysis and chemical abundance determination for a number of elements in the DLA studied, providing a short discussion on the consequences of these additional measurements at high-redshift.
2 Observation and Data Reduction

BR 11171329 is a high-redshift ( 3.96) quasar exhibiting broad absorption lines (BAL) discovered by Storrie-Lombardi et al. (1996). The data presented in this study were obtained using the Ultraviolet-Visual Echelle Spectrograph (UVES) on the 8.2m VLT in April 2000 and April 2002. UVES is particularly well suited for the study of Zn at high-redshift thanks to its good sensitivity at the longer wavelengths. Three partially overlapping setups (480+710+725) were used to provide a complete coverage of the quasar spectrum ranging from 4195 Å to 9200 Å.
The individual spectra were reduced using the UVES data reduction pipeline of the ESO MIDAS package (see Ballester et al. 2000 for a detailed description). The steps of the data processing include wavelength calibration, order extraction and flat-fielding. Once extracted, the individual frames were corrected to a vacuum heliocentric scale and combined together resulting in a spectrum with signal-to-noise ratio of about 40 per pixel at 7000Å. The quasar continuum was then fitted to the quasar spectrum using a spline function.
A careful inspection of the spectrum bluewards of the Lyman- emission reveals a DLA absorption in a region free of BAL features. The redshift () is well defined by the presence of higher Lyman series lines and heavy element absorption lines including some from Zn ii.
3 Analysis
3.1 Column Densities Measurements
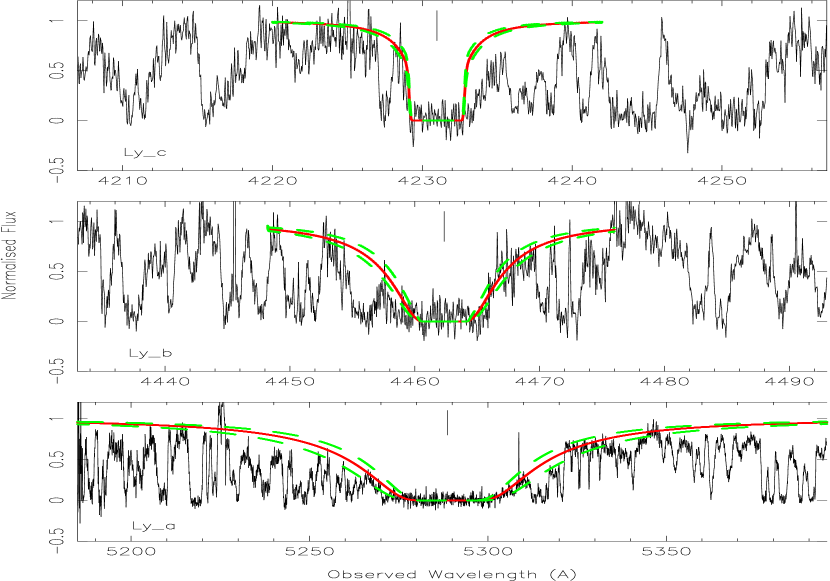
The H i column density of this system is measured by fitting a theoretical Voigt profile to the Lyman series. The quasar continuum was fitted with a spline function in MIDAS. As always in DLAs at high-redshift, the positioning of the continuum over the strong absorption lines is the main source of uncertainties in the H i column density measurement. The use of several lines to perform the fit gives confidence in the result however. The fitting of the profile is performed with VPFIT 111VPFIT was written by R.F.Carswell, J.K. Webb, M.J. Irwin, A.J. Cooke. More information about VPFIT are available at following URL: http://www.ast.cam.ac.uk/rfc/vpfit.html (Webb et al. 1987) and the resulting fit is presented in Figure 1 for the first three lines of the Lyman series. The total H i column density is (H i) atoms cm-2.
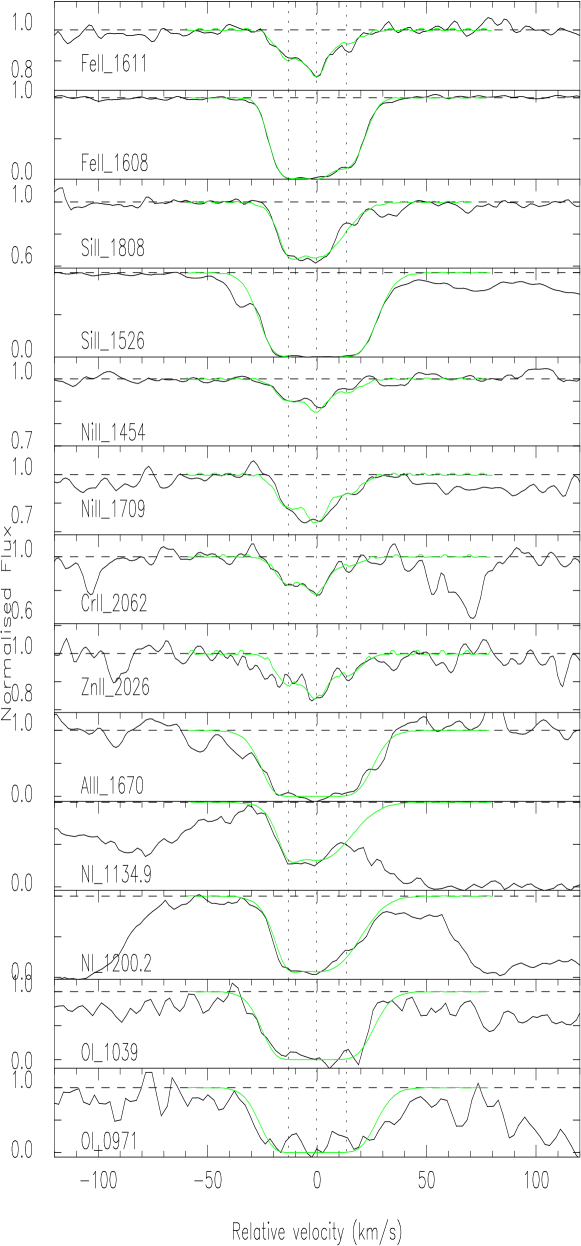
We derive the column density of the ions associated with the DLA by fitting theoretical Voigt profiles to the observed features minimizing . For this purpose we make use of the FITLYMAN package in the MIDAS data reduction software. Only the lines free of telluric contamination and blending are used to determine the column densities of the elements. In particular, we took great care to check possible atmospheric contamination in the Cr ii 2062 region (see Figure 2).
| Ion | References | |
|---|---|---|
| Si ii 1526 | 0.11000 | Spitzer & Fitzpatrick (1993) |
| Si ii 1808 | 0.00218 | Bergeson & Lawler (1993b) |
| Fe ii 1608 | 0.05800 | Bergeson et al. (1996b) |
| Fe ii 1611 | 0.00130 | Welty et al. (1999) |
| Ni ii 1454 | 0.03230 | Fedchak et al. (2000) |
| Ni ii 1709 | 0.03240 | Fedchak et al. (2000) |
| Cr ii 2062 | 0.07796 | Bergeson & Lawler (1993a) |
| Zn ii 2026 | 0.48860 | Bergeson & Lawler (1993a) |
| Al ii 1670 | 1.83300 | Morton (1991) |
| O I 971 | 0.01214 | Morton (1991) |
| O I 1039 | 0.00920 | Morton (1991) |
| N I 1200.2 | 0.08849 | Morton (1991) |
| C iv 1548 | 0.19080 | Morton (1991) |
| C iv 1550 | 0.09522 | Morton (1991) |
| Al iii 1854 | 0.56020 | Morton (1991) |
| Al iii 1862 | 0.27890 | Morton (1991) |
3.2 Results
The column densities obtained from the Voigt profile fits are used to derive abundances of Fe, Si, Ni, Zn, Cr and to place a lower limit on the abundance of Al and O and an upper limit on the abundance of N. All the low ionization species were fitted together with 3 components (see Table 2). We notice that all the lines can not be fitted with a single Doppler parameter. However a
| Component | Ion | N(X)b | ||
|---|---|---|---|---|
| [km/s] | [cm-2] | |||
| A | 3.350265 | FeII 1608–1611 | 6.50.5 | 14.390.01 |
| SiII 1526–1808 | 4.00.4 | 14.340.05 | ||
| NiII 1454–1709 | 6.50.5 | 13.070.02 | ||
| CrII 2062 | 6.50.5 | 12.760.02 | ||
| ZnII 2026 | 6.50.5 | 11.790.03 | ||
| AlII 1670 | … | 13.85c | ||
| OI 971–1039 | … | 15.85c | ||
| NI 1200.2 | … | 13.75c | ||
| B | 3.350452 | FeII 1608–1611 | 4.90.7 | 14.500.03 |
| SiII 1526–1808 | 14.80.1 | 15.040.05 | ||
| NiII 1454–1709 | 4.90.7 | 13.140.02 | ||
| CrII 2062 | 4.90.7 | 12.800.02 | ||
| ZnII 2026 | 4.90.7 | 11.860.02 | ||
| AlII 1670 | … | 13.65c | ||
| OI 971–1039 | … | 16.15c | ||
| NI 1200.2 | … | 14.39c | ||
| C | 3.350650 | FeII 1608–1611 | 7.70.5 | 14.090.01 |
| SiII 1526–1808 | 15.00.1 | 13.510.05 | ||
| NiII 1454–1709 | 7.70.5 | 12.880.04 | ||
| CrII 2062 | 7.70.5 | 12.300.05 | ||
| ZnII 2026 | 7.70.5 | 11.670.04 | ||
| AlII 1670 | … | 11.80c | ||
| OI 971–1039 | … | 14.50c | ||
| NI 1200.2 | … | 13.55c |
a The good fit is achieved by assuming two different Doppler values
respectively for Fe, Ni, Zn, Cr and Si, Al, O, N. The latter set of
lines is broader than the other one. This difference is possibly due
to the presence of extra components in these lines.
b Limits are 3-. c Using same b-parameter as in Si ii.
good fit is achieved by assuming two different values respectively for Fe, Ni, Zn, Cr and Si, Al, O, N. The latter set of lines are slightly broader than the other one. This difference is possibly due to the presence of extra components. It must be noted that this does not affect the column density determination as most of the species have at least one transition which is optically thin. An exception may be Si ii for which the weakest observed transition Si ii 1808 is partially saturated (although not going to zero). Errors indicated in the tables are statistical errors in the fit. However, there are also systematic errors not accounted for here but which are smaller than the statistical errors.
The metal content with respect to solar values is expressed in the usual manner: , assuming that and , where the solar values are taken from Grevesse & Savage (1998) and Holweger (2001; see Table 4). Silicon abundance is derived from the slightly saturated (but not going to zero) Si ii 1808 transition and the saturated Si ii 1526 transition. This results in a [Si/H] value of . The error in the Si ii column density also includes the uncertainty in b’s determination. Similarly the iron abundance is obtained from the optically thin Fe ii 1611 and saturated Fe ii 1608 transitions. We derive . Two Ni ii lines (Ni ii 1454, 1709) are available for abundance determination. We measure the column density: . The Cr ii lines are detected (Cr ii 2056,2062,2066), but only one line is suitable for abundance determination (see Figure 2). The abundance derived from the Cr ii 2062 is . After checking for possible atmospheric contaminations at these wavelengths, we find the Zn ii 2026 line allows for the determination of the Zn content of this DLA. The new measurement of Zn at , , is higher than other measurements at these redshifts. The Al ii 1670 line is heavily saturated and hence only a lower limit can be derived from this absorption feature: . Similarly, several O i lines are detected but all are saturated. Using O I 971 and OI 1039, we derive: . Finally, the two red most triplets of N i are observed but are severely blended. Only one of the lines at our disposal is suitable to determine an upper limit to the N I abundance in this system: N I 1200.2. We derive: .
| Component | Vel | Ion | N(X) | ||
|---|---|---|---|---|---|
| [km/s] | [cm-2] | ||||
| A | 3.350745 | 25 | CIV | 20.90.4 | 13.730.01 |
| B | 3.351459 | 24 | CIV | 16.60.9 | 13.140.02 |
| C | 3.352319 | 83 | CIV | 12.41.0 | 12.950.02 |
| D | 3.353086 | 136 | CIV | 6.01.2 | 12.780.07 |
| E | 3.353214 | 145 | CIV | 24.50.4 | 13.730.01 |
| a | 3.351072 | 6 | AlIII | 8.52.4 | 12.170.02 |
| b | 3.351246 | 7 | AlIII | 5.21.4 | 11.920.03 |
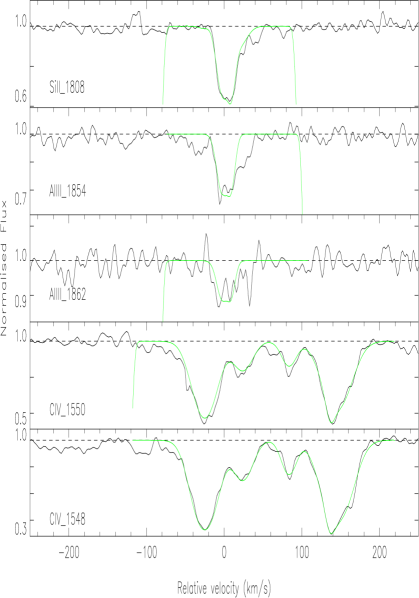
We also fit the high-ionization species in the DLA. The resulting column density estimates are summarized in Table 3 together with the redshift and Doppler parameters associated with each individual component. The C iv doublet (C iv1548,1550) is spread over 300 km s-1. It is well fitted by 5 components (Figure 4). We note that there is a velocity shift between the centroid of the low-ionization line profiles (Si ii 1808, Fe ii 1608, etc) and the one from the C iv doublet. This is illustrated in Figure 5 where the Fe ii1608 line profile is plotted together with the two members of the C iv doublet on the same velocity scale.
Finally, the Al iii doublet (Al iii1854,1862) is fitted with two components which have their positions and -values fixed to those of Si ii. Indeed, the velocity structure of Al iii is known to follow closely the one from singly ionized species in DLAs (Lu et al. 1996, Prochaska & Wolfe 1999, Prochaska & Wolfe 2000). This observational fact is not straight forward to explain: the ionization potential of Al ii being greater than the one of hydrogen, Al iii is not expected to be present in the regions dominated by neutral hydrogen (i.e. DLA) although the atomic physics of aluminum species is not well known (see Petitjean et al. 1994). Several studies have tried to explain the observations (Howk & Sembach 1999, Izotov, Schaerer & Charbonnel 2001, Vladilo et al. 2001).
4 Discussion and Conclusion
In the DLA studied here, we observe a velocity shift between the low and the high ionization ionic features. The fact that the high-ionization profiles show much more disturbed velocity structure than the low-ionization profiles has already been noticed in the past (Lu et al. 1996; Ledoux et al. 1998). Haehnelt, Steinmetz & Rauch (1998) have suggested that such feature could be the signature of merging protogalactic clumps. Indeed they use numerical simulations to model the Si ii1808 and C iv1548 line profiles and note that the absorption features vary independently in the high ionization and low ionization species since the C iv absorption arises mainly from the warmer gas outside the self-shielding region of DLAs. Nevertheless, other numerical simulations fail to reproduce the DLA kinematics in a self-consistent manner (e.g. Prochaska & Wolfe 2001) and actually require that a significant fraction of DLAs have 150 km s-1 (Maller et al. 2001) even within the Cold Dark Matter cosmology. In other words, if one wants to interpret the global kinematics of the whole DLA population with a simple model, the kinematics of the strongest systems might rule out a global dwarf galaxy scenario if one adopts 100 km s-1 as the dwarf criterion. Nevertheless, note that in the case of BR 11171329, the neutral component has a velocity width of about 50 km s-1 and that the strongest C iv components are seen on both side (at 50 and +130 km s-1) of the low-ionization profile. This is suggestive of a galactic wind from a dwarf galaxy.

The detection of N i in this DLA system allows us to probe the chemical history of the system. Indeed, the [N/O] ratio is useful to disentangle the contribution from the “primary” and “secondary” production processes for N enrichment. The limits obtained here suggests that [N/O] which is slightly lower than what one expects (i.e., ) if the primary process dominates (Vila-Costas & Edmunds, 1993). Like in most of the DLAs the [O/N] limits for the measured element metallicity is consistent with the delayed production of N compared to O and inconsistent with the primary production of N from the massive stars in the low metallicity gas (Lipman, Pettini & Hunstead, 1995; Lu et al. 1998; Centurión et al. 1998; Pettini et al. 2002 in press; Prochaska et al. in press).
The abundances of the DLA have been studied in detail. In this DLA, we find a zinc abundance slightly higher than the iron one: which suggests that the amount of dust present in this absorber is rather low. This is further supported by the chromium over zinc ratio , another tracer of dust. Thus in this DLA the abundances of refractory elements (such as Fe and Cr) are in line with the one from the non-refractory element Zn. In addition, Al iii/Al ii is less than 5%. This means that the effect of ionization correction in the measurement of metallicity in this system is almost negligible (Vladilo et al. 2001) and the absolute abundances derived here do not suffer severe biases due to dust depletion.
We derive various -chain element to Fe-peak element ratios: , and . Thus the abundance pattern in this system is consistent with no enhancement with very little depletion in Fe and Cr with respect to Zn. The results indicate that the Type II SNe enrichment process does not dominate in this system, possibly because the Type I SNe enrichment process is already important. The fact that we observe the DLA when Type I SNe processes start to dominate over Type II SNe can not easily be interpreted since the turn-over depends on both the star formation rate and the initial mass function (Matteucci & Recchi 2001).
| Ion | [N(X)/N(H)]⊙ (Ref) | N(X) | [X/H] |
|---|---|---|---|
| H I | … | 20.840.12 | … |
| Fe II | 4.50 (1) | 14.830.03 | 1.510.13 |
| Si II | 4.45 (1) | 15.130.05 | 1.260.13 |
| Ni II | 5.75 (1) | 13.520.03 | 1.570.13 |
| Cr II | 6.33 (1) | 13.150.03 | 1.360.13 |
| Zn II | 7.40 (1) | 12.260.03 | 1.180.13 |
| Al II | 5.53 (1) | 14.06 | 1.25 |
| OI | 3.26 (2) | 16.33 | 1.25 |
| NI | 4.07 (2) | 14.53 | 2.24 |
| C IV | … | 14.130.01 | … |
| Al III | … | 12.360.03 | … |
References:
[1] Grevesse & Savage 1998.
[2] Holweger 2001.
We derive a Zn abundance, at , which is higher than the very few measurements available at these redshifts (corrected to the same solar value as use in the present study): Molaro et al. (2000) derives in a DLA at towards QSO 00002620 and Levshakov et al. (2002) find in an absorber at towards QSO 03473819 although the metallicity in this absorber is uncertain and could be larger (see Ledoux, Srianand & Petitjean 2002). The resulting column density weighted mean at is , i.e. dominated by the highest HI column density, which here corresponds to the lowest Zn measurement from Molaro et al. (2000). For comparison, Pettini et al. (1997) find from to (where the measures at are upper limits). Although statistics are small, our result suggests an increase of metallicities from to present times. Previous compilations of Zn measurements at all redshifts have shown that the column density weighted metallicity does not evolve with time (Pettini et al. 1997, Vladilo et al. 2000, Prochaska & Wolfe 2002). These authors argue however that this cannot be directly interpreted as a lack of evolution of the cosmic metallicity of DLAs since measurements are still affected by low number statistics and possible bias against high column density, high metallicity absorbers (as first pointed out by Fall & Pei 1993 and Boissé et al. 1998). The presence of this bias is controversial at the moment (Ellison et al. 2001, Prochaska & Wolfe 2002, Petitjean et al. 2002) and many more measurements of undepleted metals in quasar absorbers are needed at before any conclusion can be drawn.
5 Acknowledgments
We are grateful to Cédric Ledoux for reducing the spectrum of BR 11171329 presented here and to an anonymous referee for providing very constructive comments. C. P. thanks Bob Carswell and Miriam Centurión for help with VPFIT and FITLYMAN respectively and Giovanni Vladilo and Paolo Molaro for comments on an earlier version of this manuscript. This work was supported in part by the European Communities RTN network ”The Physics of the Intergalactic Medium”. P.P.J. and R. S. gratefully acknowledge support from the Indo-French Centre for the Promotion of Advanced Research (Centre Franco-Indien pour la Promotion de la Recherche Avancée) under contract No. 1710-1.
References
- (1) Ballester, P., Modigliani, A., Boitquin, O., et al., 2000, ESO Messenger, 101, 31.
- (2) Bergeson, S. D. & Lawler, J. E., 1993a, ApJ, 408, 382.
- (3) Bergeson, S. D. & Lawler, J. E., 1993b, ApJ, 414, L 137. 9204.
- (4) Bergeson, S. D., Mullman, K. L., Wickliffe, W. E., Lawler, J. E., Litzen, U., Johansson, S., 1996, ApJ, 464, 1044.
- (5) Boissé, P., Le Brun, V., Bergeron, J., & Deharveng, J-M., 1998, A&A, 333, 841.
- (6) Centurión, M., Bonifacio, P., Molaro, P. & Vladilo, G., 1998, ApJ, 509, 620.
- (7) Dessauges-Zavadsky, M., D’Odorico, S., McMahon, R. G., Molaro, P., Ledoux, C., Péroux, C. & Storrie-Lombardi, L. J., 2001, A&A, 370, 426.
- (8) Ellison, S.L., Yan, L., Hook, I. M., Pettini, M., Wall, J. V., Shaver, P., 2001, A&A, 379, 393.
- (9) Fall, S. M. & Pei, Y. C. 1993, ApJ, 402, 479.
- (10) Fedchak, J. A., Wiese, L. M., Lawler, J. E., 2000, ApJ, 533, 773.
- (11) Grevesse, N. & Sauval, A. J., 1998, Space Science Review, vol. 85.
- (12) Holweger, H., 2001, “Joint SOHO/ACE workshop ”Solar and Galactic Composition”.
- (13) Haehnelt, M., Steinmetz, M. & Rauch, M., 1998, ApJ, 495, 647.
- (14) Howk, J. C. & Sembach, K. R., 1999, ApJ, 523, L141.
- (15) Izotov, U. I., Schaerer, D. & Charbonnel, C., 2001, ApJ, 549, 878.
- (16) Ledoux, C., Bergeron, J. & Petitjean, P., 2002, A&A, 385, 802.
- (17) Ledoux, C., Petitjean, P., Bergeron, J., Wampler, E. J. & Srianand, R., 1998, A&A, 337, 51.
- (18) Ledoux, C., Srianand, R., & Petitjean, P., 2002, MNRAS, submitted.
- (19) Levshakov, S.A., Dessauges-Zavadsky, M., D’Odorico, S. & Molaro, P., 2002, ApJ, 565, 696.
- (20) Lipman, K., Pettini, M., Hunstead. R. W., 1995, in QSO Absorption lines ed G. Meylan(Berlin:springer), 89
- (21) Lu, L., Sargent, W.L.W., Barlow, T.A., Churchill, C. W. & Vogt, S. S., 1996, ApJ, 107, 475.
- (22) Lu, L., Sargent, W.L.W. & Barlow, T.A., 1998, ApJ, 115, 55.
- (23) Maller, A.H., Prochaska, J.X., Somerville, R.S. & Primack, J.R., 2001, MNRAS, 326, 1475.
- (24) Matteucci, F. & Recchi, S., 2001, ApJ, 558, 351.
- (25) Molaro, P., Bonifacio, P., Centurión, M., D’Odorico, S., Vladilo, G., Santin, P. & Di Marcantonio, P., 2000, ApJ, 541, 54.
- (26) Morton, D. C., 1991, ApJS, 77, 119.
- (27) Petitjean, P., Rauch, M. & Carswell, R. F, 1994, A&A, 291,29.
- (28) Petitjean, P., Srianand, R. & Ledoux, C., 2000, A&A, 364,26.
- (29) Petitjean, P., Srianand, R. & Ledoux, C., 2002, (astro-ph/0201477).
- (30) Pettini, M., Smith, L.J., Hunstead, R.W. & King, D.L., 1994, ApJ, 426, 79.
- (31) Pettini, M., Smith, L.J., King, D.L., & Hunstead, R.W., 1997, ApJ, 486, 665.
- (32) Pettini, M., Ellison, S.L., Bergeron, J. & Petitjean, P., in press (astro-ph/02050472).
- (33) Prochaska, J.X., Gawiser, E. & Wolfe, A.M., 2001, ApJ, 552, 99.
- (34) Prochaska, J.X., & Wolfe, A.M., 1999, ApJS, 121, 369.
- (35) Prochaska, J.X., & Wolfe, A.M., 2000, ApJ, 533L, 5.
- (36) Prochaska, J.X., & Wolfe, A.M., 2001, ApJ, 560, 33.
- (37) Prochaska, J.X., & Wolfe, A.M., 2002, ApJ, 566, 68.
- (38) Prochaska, J.X., Henry, R.B.C., O’Meara, J.M., Tytler, D., Wolfe, A.M., Kirkman, D.L., & Suzuki, N., in press (astro-ph/0206296).
- (39) Savage, B.D. & Sembach, K.R. 1991, ARA&A, 34, 279.
- (40) Savage, B.D. & Sembach, K.R. 1996, ARA&A, 34, 279.
- (41) Songaila, A. & Cowie, L. L., 2002, 123, 2183.
- (42) Spitzer, L., Jr., Fitzpatrick, E. L., 1993, ApJ, 409, 299.
- (43) Storrie-Lombardi, L.J., Irwin, M. & McMahon, R.G., 1996, MNRAS, 282, 1330.
- (44) Vila-Costas, M. B., & Edmunds, M. G. 1993, MNRAS, 265, 199.
- (45) Vladilo, G., Centurión, M, Bonifacio, P. & Howk, J. C., 2001, ApJ, 557, 1007.
- (46) Vladilo, G., Bonifacio, P., Centurión, M., & Molaro, P., 2000, ApJ, 543, 24.
- (47) Webb, J.K. 1987, Ph.D. thesis, Cambridge University.
- (48) Welty, D. E., Hobbs, L. M., Lauroesch, J. T., Morton, D. C., Spitzer, L., York, D. G., 1999, ApJS, 124, 465.