A Young Blue Tidal Stream in NGC 5128
Abstract
Stellar streams in galaxy halos are the natural consequence of a history of merging and accretion. We present evidence for a blue tidal stream of young stars in the nearest giant elliptical galaxy, NGC 5128 (Centaurus A). Using optical UBVR color maps, unsharp masking, and adaptive histogram equalization, we detect a blue arc in the northwest portion of the galaxy that traces a partial ellipse with an apocenter of 8 kpc. We also report the discovery of numerous young star clusters that are associated with the arc. The brightest of these clusters is spectroscopically confirmed, has an age of Myr, and may be a proto-globular cluster. It is likely that this arc, which is distinct from the surrounding shell system and the young jet-related stars in the northeast, is a tidally disrupted stellar stream orbiting the galaxy. Both the age derived from the integrated optical colors of the stream and its dynamical disruption timescale have values of 200–400 Myr. We propose that this stream of young stars was formed when a dwarf irregular galaxy, or similar sized gas fragment, underwent a tidally triggered burst of star formation as it fell into NGC 5128 and was disrupted Myr ago. The stars and star clusters in this stream will eventually disperse and become part of the main body of NGC 5128, suggesting that the infall of gas-rich dwarfs plays a role in the building of stellar halos and globular cluster systems.
To appear in the December 2002 issue of The Astronomical Journal
1 Introduction
The accretion and subsequent tidal disruption of low mass galaxies is suspected to be an important agent in the evolution of galaxy halos. Both the outer halo of the Milky Way (Searle & Zinn 1978) and the globular cluster systems of nearby ellipticals (Côté, Marzke, & West 1998) may have been formed by the late infall of low mass fragments. Hierarchical models of galaxy formation suggest that structure first forms on small scales, and later combines to form larger galaxies (e.g. Klypin et al. 1999). In our own Galaxy, the discovery of tidal streams associated with the Sagittarius dwarf galaxy (Ibata et al. 2001a) as well as tidal tails around Galactic globular clusters (Odenkirchen et al. 2000) give credence to the idea of “spaghetti halos”—that galaxy halos may be comprised of the many remnants of tidally disrupted dwarf galaxies (Morrison et al. 2000).
The study of streams in galaxy halos is valuable, both for understanding the stellar mass assembly of galaxies, and as probes of the galaxy potential (Johnston, Sackett, & Bullock 2001, hereafter JSB01). However, the identification of accretion events that still maintain their spatial coherence (ages of less than a few Gyr) is challenging. In our own Galaxy, debris streams have been identified using star counts and kinematics (Majewski et al. 1999; Helmi et al. 1999; Newberg et al. 2002). In external galaxies, these streams can only be detected with deep imaging at surface brightness levels fainter than 27 mag/arcsec2. Low surface brightness features in many galaxies, which may or may not be debris trails, were detected by Malin & Hadley (1997) using photographic amplification techniques. Until now, perhaps the best example of an observed tidal streamer is the one in NGC 5907 (Shang et al. 1998). There is also strong evidence that tidal streams exist in the halo of M31 (Ibata et al. 2001b; Choi, Guhathakurta & Johnston 2002). However, in all cases outside the Local Group, distance and low surface brightness preclude any direct study of the stellar populations and kinematics of the accreted stars.
2 NGC 5128 (Centaurus A)
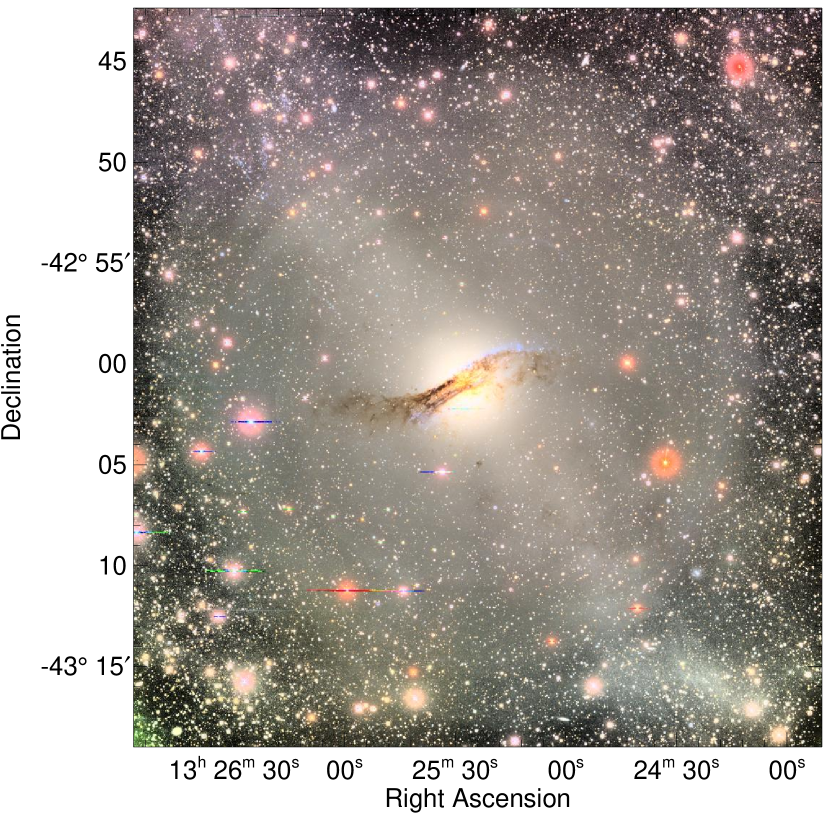
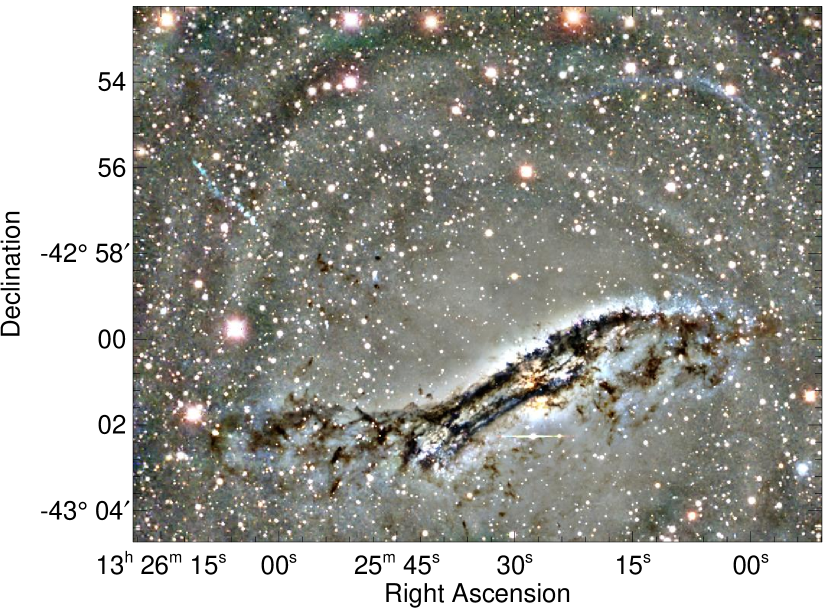
NGC 5128 (also the radio source Centaurus A) is the nearest easily observable giant elliptical galaxy, and is the prototype for a post-merger elliptical. A BVR color image of NGC 5128 is shown in Figure 1. The prominent central rotating disk of gas and dust (Graham 1979), optical shells (Malin, Quinn, & Graham 1983, hereafter MQG83), and H I shells (Schiminovich et al. 1994) all point to a merger event within the last Gyr. It is also the prototype Fanaroff-Riley Class I radio galaxy, with an AGN-driven radio jet believed to be inducing star formation in the northeast halo regions (Fassett & Graham 2000). While NGC 5128 appears to be a uniquely complex system, it is only because of its proximity that we are able to discern and study features that are likely to be common in more distant galaxies. We adopt a distance of 3.5 Mpc () to NGC 5128 given by the planetary nebula luminosity function (Hui et al. 1993). This distance is consistent with measurements from the globular cluster luminosity function (G.Harris et al. 1984) and the tip of the red giant branch (Soria et al. 1996; Harris & Harris 2000). At this distance, 1 kpc , and the full extent of the galaxy’s halo covers over two degrees of sky. NGC 5128’s effective radius is given by Dufour et al. (1979) to be , or 5.2 kpc. Throughout this paper, we adopt (, , J2000) as the position of the center of NGC 5128.
Studies of the NGC 5128 halo regions are difficult because of its large extent on the sky and its relatively low Galactic latitude (). Nevertheless, it is an extremely valuable case study because its proximity facilitates resolved stellar population studies, and its post-merger state makes it a likely candidate for harboring recent accretion and disruption events. We are conducting an optical study of the halo of NGC 5128 that encompasses the planetary nebulae, globular clusters, and unresolved stellar light. In this paper, we discuss our search for tidal streams in NGC 5128’s halo.
3 Observations and Data Reduction
We obtained our observations during 2000 June 1–4 at the 4-meter Blanco telescope of the Cerro Tololo Inter-American Observatory (CTIO). We observed three fields in NGC 5128 with the Mosaic II optical CCD camera, which has pixels and a 0.5-degree field of view. In this paper, we discuss our central pointing which includes the inner of the galaxy.
We imaged the galaxy through the Johnson-Cousins UBVRI filters. Total effective exposure times were 3600s, 1500s, 1800s, 1000s, and 1000s, respectively. Conditions were moonless and photometric for the entirety of the observing run, with a typical seeing of 1″. We split our observations into a series of five dithered exposures in order to reject cosmic rays and fill in the gaps between the CCDs. We observed standard stars from Landolt (1992) and obtained photometric solutions in UBVRI with rms errors of 0.07, 0.02, 0.02, 0.02, and 0.03 magnitudes, respectively.
We reduced the data using MSCRED, a software package for IRAF that is specifically designed for the reduction of data from NOAO Mosaic CCD cameras (Valdes 1998). Images were bias subtracted, flat-fielded using both dome and night sky flats, astrometrically regridded, and combined with a 3-sigma upper threshold rejection of cosmic rays. Because the galaxy filled most of the field of view, the individual CCDs were not background subtracted before combining.
4 Image Processing
Some of the best work to date on faint halo features in nearby galaxies was done by Malin (1978) with photographic plates of NGC 5128. It is only with the relatively recent development of wide-field mosaic CCD cameras that we can apply modern digital processing techniques to a comparable field of view. Below, we describe the techniques that we used to bring out faint or low-contrast features.
4.1 Adaptive Histogram Equalization
Astronomical images often contain vastly more information than can be displayed in a conventional grayscale or color representation of the image. Observers will be familiar with the process of fiddling with the contrast and brightness of an image in order to look for features buried in a strongly varying background. This problem is particularly difficult for our image of NGC 5128 because the galaxy extends across the entire field of view and varies in brightness by more than a factor of 100 from the center to the edge.
Adaptive histogram equalization (AHE; Pizer et al. 1987) is an image processing algorithm that is designed to solve this very problem. Although AHE has been relatively commonly used for medical images, it appears to have been used at most rarely in astronomy. We here describe the algorithm briefly and discuss some improvements we have made.
The more familiar (non-adaptive) histogram equalization algorithm for a grayscale image maps the input image pixel values monotonically to the output such that the output image has an approximately equal number of pixels at each gray level. The histogram of pixel values for a typical astronomical image is strongly peaked around the sky brightness; the histogram-equalized image has a flat distribution of pixel values and therefore uses most of the gray levels near the sky. Such an image is typically much better for seeing faint structures than is a linear grayscale mapping.
The basic algorithm for AHE is straightforward: one applies standard histogram equalization to a region around each pixel and chooses a local gray level mapping that is determined by the distribution of input pixel values in that region. The contrast is allowed to vary across the image, with the scale of variation determined by the region size (which is a parameter of the method.) Pizer et al. (1987) discuss methods of performing the computation and propose a simple algorithm where the grayscale is computed for non-overlapping tiles covering the image and then is linearly interpolated for pixels not in the centers of tiles.
Both histogram equalization and AHE have the drawback that they can unacceptably enhance the noise in images. For example, in a typical astronomical image 99% of the pixel values fall within 3 sigma of the sky brightness; if that distribution is made perfectly flat by AHE, the resulting image looks basically like white noise with a few saturated regions where objects are found. Pizer et al. have addressed this problem by clipping the intensity histogram before determining the gray scale to limit the maximum contrast in the image. The clipped parts of the histogram are uniformly distributed into the unclipped bins of the histogram. This clipped histogram equalization is equally applicable in the adaptive and non-adaptive cases. In their approach there is a single parameter specifying the maximum slope of the function mapping input to output pixel values.
We have made a few modifications to the Pizer et al. AHE algorithm to produce better results for astronomical images:
-
1.
In the clipping algorithm, we incorporate a CCD noise model (readout noise plus Poisson counting noise); the clipping parameter is then specified as the maximum fraction of output gray levels that can be assigned within any 1-sigma intensity range. This gives good results and also determines the natural bin size for floating point images. Our algorithm thus works on either integer or floating point images.
-
2.
In computing the lookup tables for the adaptive regions, we find it necessary to use overlapping tiles (shifting by less than the tile size) in order to eliminate visual artifacts when the tiles are small. Typically we sample the histogram at an interval of half the region size, although for smaller regions the sampling interval may need to be one third. Pizer et al. discuss this approach but conclude it is not needed for their images.
-
3.
We do not necessarily fix the maximum and minimum values for the histogram across the entire image, instead allowing the values to vary depending on the range of pixel values in that region. This is needed for high dynamic range images.
To apply AHE color (multi-band) images, we have used two approaches. The first is to perform AHE on a single combined image from the three bands, and then to create a color output image using the AHE image for the intensity and the ratios of the input image pixel value to determine the RGB values of the output. This has the advantage that it preserves the colors of the input pixels while enhancing the contrast. A color AHE version of our NGC 5128 image created using this technique is shown in Figure 1. Note that it shows detail across the whole range of the image, from the faint outer reaches of the galaxy (where the shells and jet-induced star formation regions are visible) to the center of the galaxy (where details of the dust lane can be seen.) The colors here are consistent and comparable across the image; gradients in the apparent colors of stars across the field are the result of slight flat-fielding inconsistencies.
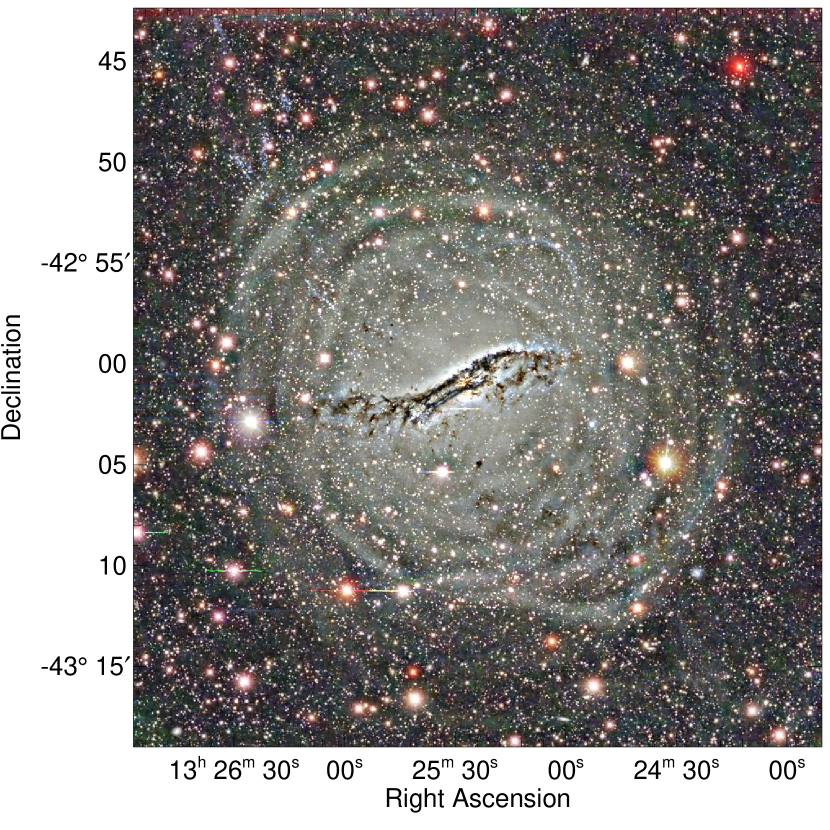
The second approach for applying AHE to color images is to independently equalize the three bands and then to combine them. This does not generate output colors that map directly to the input colors. However, if one is interested in the presence of a low-contrast blue feature on a bright red background, this second approach will do a better job of bringing out the contrasting color of the weak features. Figure 2 shows a color AHE version of our image using this second method. (For this image, we have also adaptively filtered each filter’s data using a wavelet shrinkage method as suggested by Donoho (1992)). The difference from Figure 1 is striking. In this image the complex system of shells is clearly visible, as is a blue elliptical arc in the northwest quadrant of the galaxy.
4.2 Object Detection and Masking
Most of the discrete sources visible in the field of NGC 5128 are foreground stars in the Milky Way. Because we are only interested in the unresolved stellar light of NGC 5128, another way to better reveal the structure of the galaxy is to identify and interpolate across foreground and background objects.
We used the object detection package SExtractor (Bertin & Arnouts 1996) to create a catalog with positions and magnitudes for all objects. Detection and aperture definition were done on the V-band image, which went as deep or deeper than images taken through the other filters. We used SExtractor because it does a good job of fitting the variable background introduced by the underlying galaxy light, and also because we wished to measure magnitudes for globular clusters, which are slightly resolved. In order to create an image free of discrete sources such as foreground stars, globular clusters, and background galaxies, we used the pixel mask created by SExtractor to identify the location of “object” pixels. We replaced these pixels with the estimated background values as determined by the package’s mode and median algorithm. This is a valid approximation where the galaxy’s light varies slowly and on large spatial scales, and allows us to create a “source-free” image.
4.3 Unsharp Masking
Unsharp masking is an image processing technique that emphasizes sharp features on a smooth background. By subtracting or dividing out a smoothed version of the image from the original, one can increase the contrast of features that vary on scales smaller than the smoothing box. Malin and Carter (1983) successfully applied unsharp masking to photographic plates to reveal faint shells and filaments in galaxies.
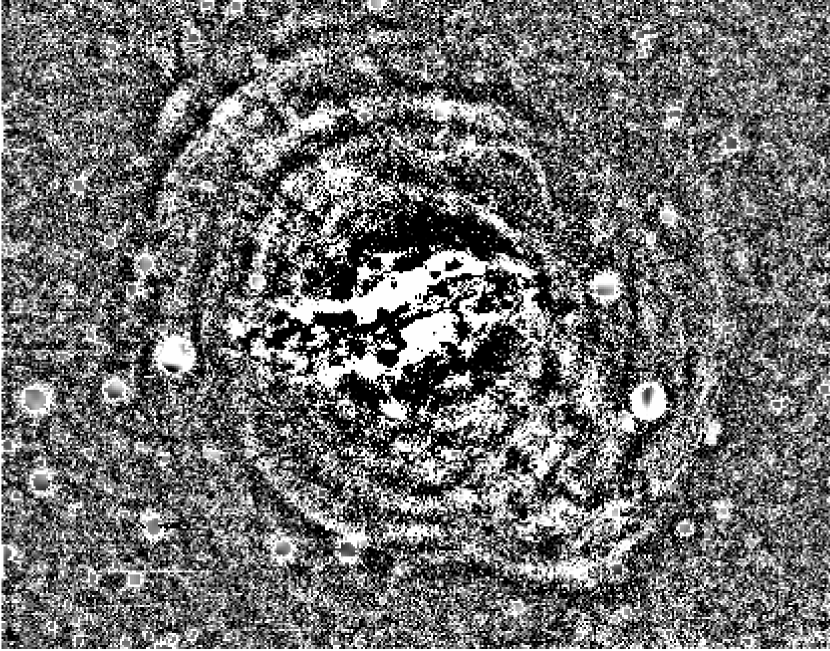
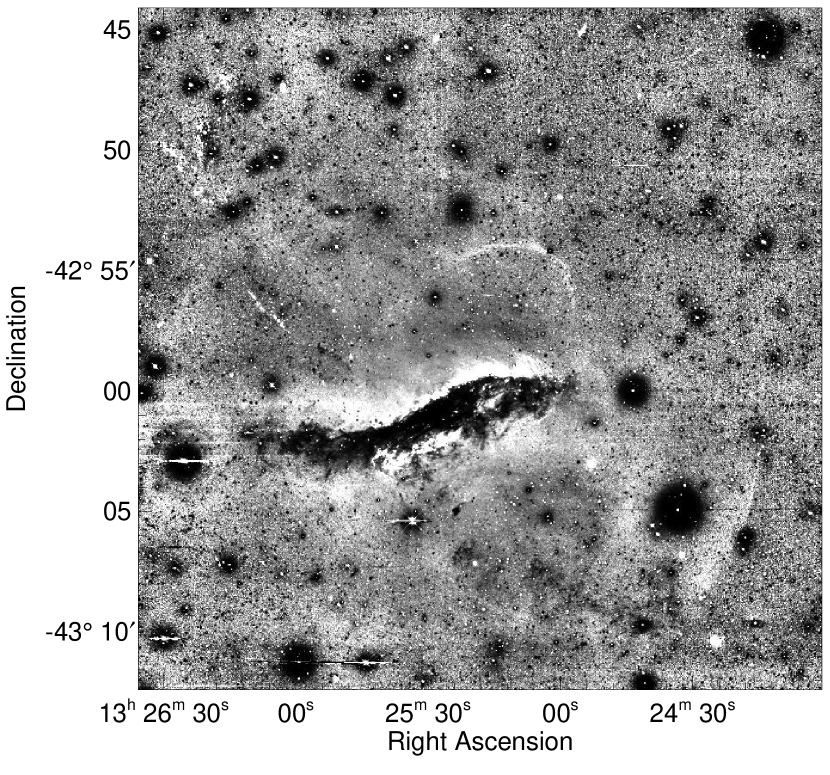
NGC 5128 is a known shell galaxy, having had some of its shells photographically cataloged in pioneering work by MQG83. We unsharp masked our CCD images to look for more fine structure in NGC 5128. We created a blurred image of the galaxy by applying a pixel median filter to the source-free image. We subsequently subtracted the blurred image from the source-free image. The final processed V-band image is shown in Figure 3. With modern CCD data, we have the dynamic range and areal coverage to capture the richness of the NGC 5128 shell system from its bright central regions to its faint halo. Figure 3 shows that NGC 5128 possesses many shells, some of which have not been previously cataloged. Also visible along the major axis in the NE are two faint radial extensions that may be reflected light from the embedded AGN. We defer discussion of these and other features in our CCD fields to a later paper.
4.4 Color Maps
Faint stellar features that are significantly younger or more metal-poor than the bulk of the galaxy will be bluer than their surrounding light, and as a result will stand out in a color map. Because some objects that may have recently merged with a giant elliptical—like spirals and dwarf galaxies—are generally bluer than ellipticals, searching for anomalously blue features can be an efficient way to map recent mergers.
We created color maps of NGC 5128 using our UBVR images. The varying sky in the I-band image made it unsuitable for faint surface photometry. We first sky subtracted each of the source-free images, a task that is non-trivial because the galaxy itself fills most of the CCD frame. When planning our observing, we examined a deep photographic image by Malin to be sure to include in each field a region that is primarily “sky”—i.e. a region that appears to be free of obvious galaxy light or Galactic cirrus down to the surface brightness limit of Malin’s image (29 B mag/arcsec2, Malin 1978). This darkest portion of our image was used as the reference sky level, which was then subtracted off for each image. Because there are so few true sky pixels in the image, we made the necessary assumption that the sky level is constant across the image. After sky subtraction, we divided one image into another to create color maps.
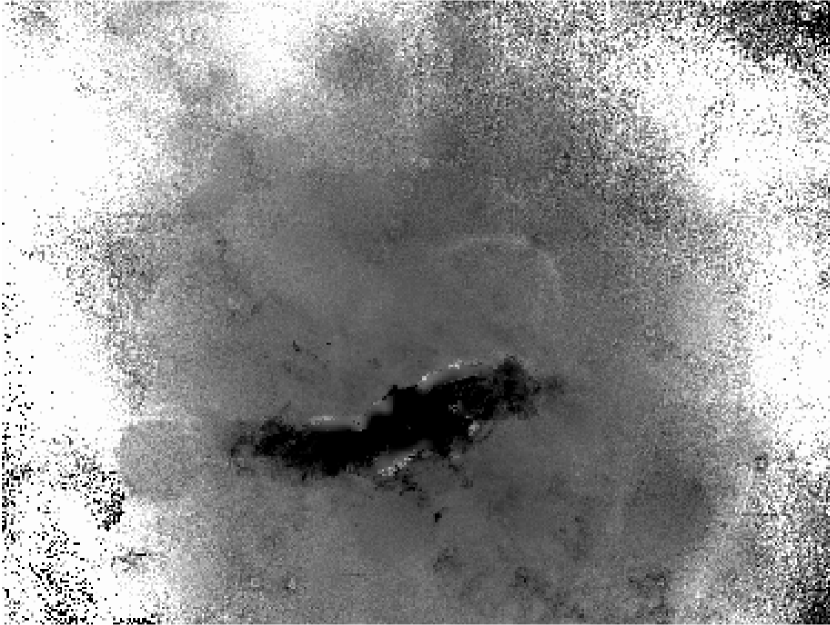
A smoothed color map with the best combination of contrast and signal-to-noise, (–), is shown in Figure 4. In this image, light shades represent bluer values, and dark shades are redder. The prominent central dust lane is visible as a dark band, and other patches of dust are also identifiable along the major axis of the galaxy. The main body of the galaxy is red, as one would expect for a typical elliptical. An exception to this is the arc-like feature in the NW portion of the inner halo. This feature is much bluer than the surrounding stars, and appears to trace out a partial ellipse around the galaxy center.
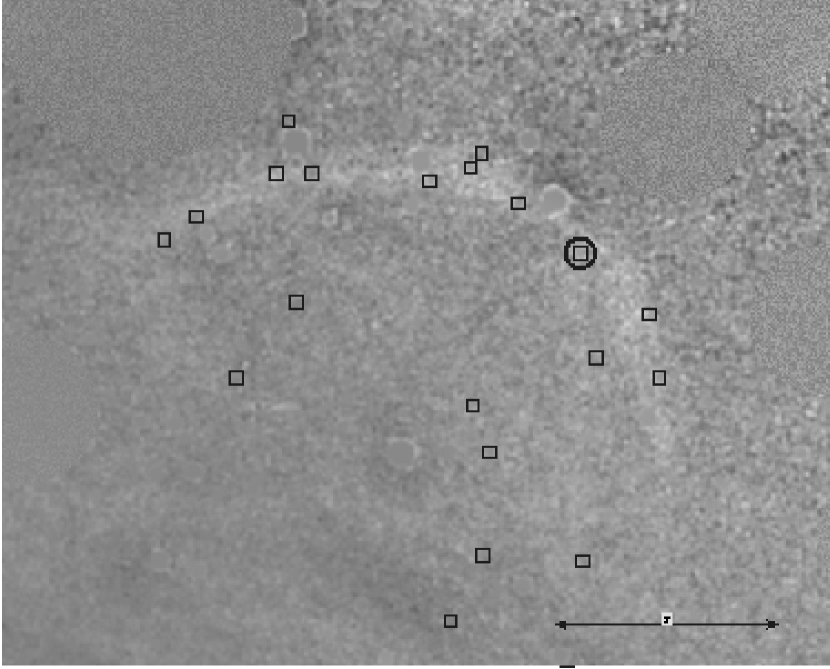
This arc is also evident in the upper right quadrant of the color image in Figure 5, a closeup taken from the AHE-processed Figure 2. We note that in this color image, the arc has a braided appearance. Furthermore, by applying AHE to a (–) color map, we can enhance features that are both sharp and blue. An example of this is shown in Figure 6, where we see that the arc extends southeast of the brightest portion, across the major axis of the galaxy, still northeast of the galaxy center.
In the following sections, we discuss the properties, stellar content, and possible origin of this blue arc.
5 The Blue Arc
5.1 Geometry
Photometry of faint, low surface brightness features on a variable background is challenging. The color maps in Figures 4 and 6 show that the arc’s bluest portion is in the northwest quadrant of the galaxy, with less prominent extensions closer in across to the north and northeast regions. At these smaller distances from the center, the increasing surface brightness of the galaxy and the increased extinction from dust within NGC 5128 make the arc more difficult to follow. We show a schematic of the traceable regions of the arc in Figure 7. The arc’s apocenter (), the largest projected distance from the galaxy center, is at 8.1 kpc. The closest visible region, which we will refer to as pericenter (), is at 3.5 kpc. The width of the arc at apocenter is kpc. Only after determining the arc width did we smooth the color map to increase the signal-to-noise, using a comparably sized ( pixel) median filter.
5.2 Photometry
To measure the light intrinsic to the arc, we first minimized the varying galaxy background by fitting and then subtracting a model of the galaxy. We created this model using the ISOPHOTE package in IRAF by fitting ellipses to a masked image of the galaxy in each band (Jedrzejewski 1987). The dust lane, blue arc, and all resolved sources were masked and not included in the fits. We used the color map to define an arc aperture that includes the brightest region at apocenter. We also define two flanking apertures to measure the background level both inside and outside the arc. The background level used and subtracted from the arc aperture was the average of the values in the two flanking apertures. The resulting photometry of the arc is presented in Table 1. All values have been corrected for Galactic foreground reddening using the extinction maps of Schlegel, Finkbeiner, & Davis (1998). Because the photometry was measured on the image with all resolved sources already removed, any light from resolved sources that belong to the arc must also be included. We discuss this in the following section.

5.3 Young Star Clusters
Star clusters are single-age, single-metallicity stellar populations, and are useful markers of a galaxy’s star formation history. At the distance of NGC 5128, where pc, some star clusters are marginally resolved in ground-based seeing. In the course of our survey for old globular clusters in the halo of NGC 5128, we obtained fiber spectroscopy of objects that were slightly resolved in our imaging. We acquired these spectra with 2.5 hr exposures on the CTIO/Hydra spectrograph. The radial velocities of these objects allow us to determine whether they are genuine clusters or foreground Galactic disk stars.

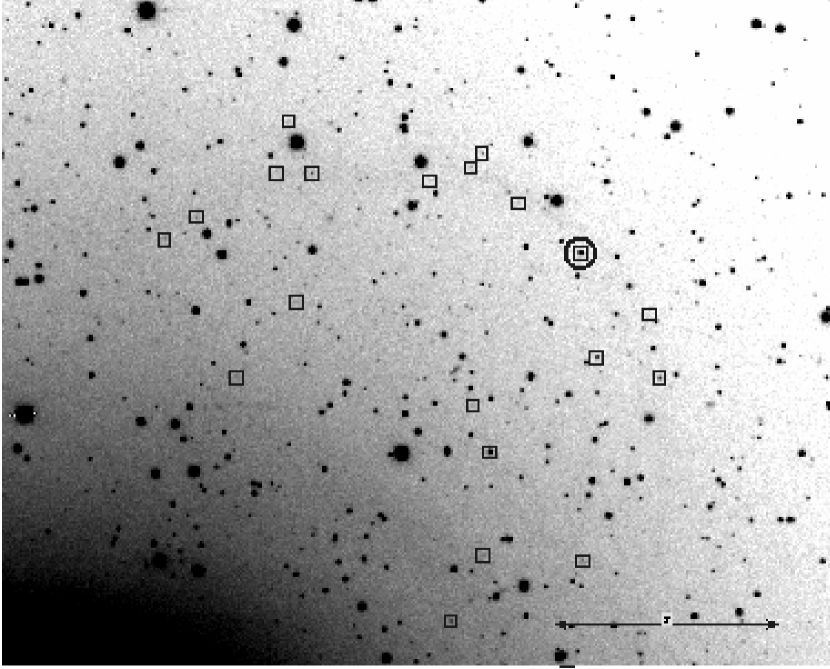
One of these newly confirmed clusters lies directly atop the blue arc, with its position shown in Figure 8. This cluster, which is at (, , J2000), has a heliocentric velocity of 581 km/s. This velocity is close to the systemic velocity of NGC 5128, km/s (Hui et al. 1995), making it convincingly associated with the galaxy. Its UBVRI broadband colors (Table 1) and spectrum show it to be by far the youngest and bluest of the confirmed clusters in the NGC 5128 halo.
Mergers remnants are known to have young or intermediate-age clusters associated with them (e.g. NGC 1316; Goudfrooij et al. 2001). Because NGC 5128 is obviously a recent merger, we might expect that some of its star clusters to be young and associated with the larger merger rather than directly with the arc. While it is possible that this blue star cluster is merely superimposed on the arc, we believe that this is unlikely. Our spectroscopic survey included many objects at similar distances to the galaxy center, including blue objects that are unresolved, and this was the only young cluster discovered. Moreover, its colors are very similar to the integrated colors of the arc, providing more evidence for association. Other cluster candidates that were fainter than our survey limit are more widely distributed, and may be associated with either the arc or with the central gas disk.
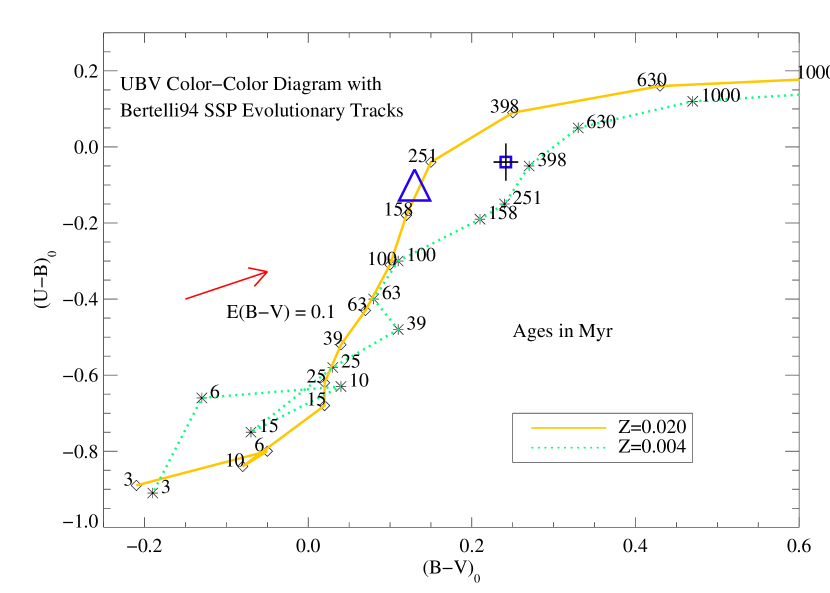
In Figure 9 we compare the cluster’s UBV colors to the single stellar population evolutionary tracks of Bertelli et al. (1994). Modulo any internal reddening, we obtain an age of Myr, possibly with a slightly sub-solar metallicity. The strong Balmer absorption lines evident in the star cluster’s spectrum (Figure 10) are also age diagnostics. We measured the equivalent widths of the Balmer lines from H to H9 using the line and continuum windows defined in Table 3 of González Delgado & Leitherer (1999). The results are listed in Table 2. When we compared these line widths to instantaneous burst models at metallicities of solar and 5% solar (González Delgado, Leitherer, & Heckman 1999), we find that they are consistent with those for a few hundred Myr old stellar population. Unfortunately, these equivalent widths are sensitive to the continuum fit, and have relatively large errors of approximately Å. Determining a more precise age and metallicity will require a spectrum with higher signal-to-noise. Nevertheless, the range of ages allowed by the spectroscopy is consistent with the previously derived photometric age.
Could this cluster be a proto-globular cluster? With and (B V), this cluster is similar to the young massive clusters in spiral galaxies studied by Larsen & Richtler (1999). When we compared its and age to the fading tracks of Girardi & Bica (1993), assuming a Salpeter IMF and a metallicity of Z=0.004, we find that the cluster had an initial mass of approximately , and that in 15 Gyr it will fade to . This makes it close in mass to the mean mass of the Milky Way globular cluster system, which is (Mandushev, Staneva & Spasova 1991). The blue cluster’s appearance is as compact as that of old NGC 5128 globular clusters, and while it is difficult to predict the disruptive forces that it will experience, it is likely that this cluster will become indistinguishable from the low mass globular clusters in the NGC 5128 halo as it ages.
In addition to this spectroscopically confirmed cluster, there are a number of other blue objects in the vicinity of the arc. In Figure 8 we also show the locations of all discrete sources that have apparent magnitudes and colors bluer than (B V). Many of these objects lie along the blue arc, while others are probably associated with the central gas disk. The blue color of the arc is similar to that of an A-type star. A stellar population that is younger than Myr would contain individual A-supergiants with , an absolute magnitude range that corresponds to the apparent magnitude range of our “blue objects”. While it is possible that some of the blue objects are supergiant stars in NGC 5128, preliminary imaging with the Very Large Telescope/Kueyen taken in seeing show that all of the blue objects that lie on the arc are resolved. Therefore, it is likely that they are fainter star clusters rather than A-supergiants. Further observations to confirm the nature of these objects will be obtained and discussed in a future paper.
The combined light of the unresolved and discrete blue light in the brightest NW portion of the arc is listed in Table 1. The total luminosity of this arc is .
6 The Tidal Disruption of an Accreted Dwarf Irregular Galaxy?
Previous studies of fine structure in NGC 5128 show that the galaxy has a rich shell structure that likely is a result of the recent merger event (MQG83). Could the blue arc be related to the shells? MQG83, in their shell catalog, labeled the brightest portion of the arc as “Feature 8” and described it as a “filament”. With the benefit of having multicolor CCD observations, we compared the unsharp masked image (Figure 3) to the color map (Figure 4). The shells, which are ubiquitous within the inner few effective radii, differ from the blue arc in their color. Outside of the central dust obscuration and the blue arc, the color structure of the galaxy is relatively smooth, showing little of the fine structure seen in Figure 3. This color difference between the arc and the shells is also visible in the color image in Figure 2. Moreover, the arc is not concentric along the major axis as are most of the known shells. The one exception is a sharp blue feature in the SW corner of the image that corresponds to an off-center shell.
While it is difficult to rule out a shell-like origin for the arc, our color maps allow us to distinguish it clearly from the surrounding structure. It is possible that this is a young shell—one might expect inner shells to be bluer because the orbital timescale is short. However, there are many shells inside of the arc that are not as blue, implying that the dynamical time is not likely to be the only explanation for the color difference. With its A-star colors and young star clusters, the arc has a different stellar population from the other shells, and from a canonical elliptical galaxy.
We propose that the arc is the product of a recent tidal disruption. The morphology, brightness, and associated stellar populations of the arc suggest a stream of young stars following an orbit through the NGC 5128 potential. It is unlike previously detected halo streams—e.g. NGC 5907 and those associated with the Sgr dwarf in the Milky Way—because it is composed primarily of young stars. Dwarf irregular (dI) galaxies, however, are gas-rich and contain young stellar populations. Given the large numbers of dIs in the Centaurus Group (Côté et al. 1997; Banks et al. 1999), it is possible that one has been accreted by NGC 5128, perhaps in association with the larger merger event that created the shells and central gas disk. An infalling dwarf would be tidally disrupted, creating a stream of young stars in the halo. Many of these stars may have been formed recently, in an event triggered by the encounter.
To create a young tidal stream in this fashion, the dI would need to be massive and compact enough to retain gas as it passed close to the center of NGC 5128, but not so massive that it would survive the encounter largely intact. Would we expect this to be the case for an infalling dI? The tidal limit, , for a dwarf galaxy orbiting a massive host is given by (Lang 1974; von Hoerner 1957)
| (1) |
where is the mass of the dwarf, is the mass of the host galaxy, and R is the distance between galaxies. Using the mass profile derived by Hui et al. (1995), we adopt masses for NGC 5128 within 25, 8, and 2 kpc as , , and , respectively. We assume a dwarf galaxy mass of . For a dwarf at these distances , the tidal limit is 550, 250, and 100 pc. The “core” radii of Local Group dwarf galaxies ranges from 95 pc (DDO 210) to 710 pc (WLM) (Mateo et al. 1998). By this measure, it is possible that a dI galaxy similar to those found in the Local Group could retain much of its gas until it was well into the main body of NGC 5128. Once the dI reaches the center, though, it is likely to be severely disrupted by tidal forces. The star formation episode that accompanies this tidal interaction may also have a role in disrupting the ISM of the dwarf. How much of the galaxy core remained concentrated would depend on its initial mass and density, as well as the time since the encounter. While we do not detect such an overdensity along the orbit of the tidal stream, the extinction in NGC 5128’s center could be hiding other parts of the disrupted galaxy.
When compared to the dwarf galaxies in the Local Group, the colors and luminosity of the stream are most similar to those of Leo A and SagDIG (Mateo 1998). However, because our measured luminosity for the arc does not necessarily include the entire content of the progenitor, we must treat this measured value as a lower limit. The infalling galaxy may originally have been more extensive and luminous.
If the arc did originate in a minor gas-rich merger, we can use its size to infer its mass and a timescale for the event. JSB01 provide a useful semi-analytic formulation for the behavior of tidally disrupted stellar streams in a galaxy halo. Because it is impossible to know the true three-dimensional geometry of the arc, we made the simplifying assumption that it is in the plane of the sky. This allowed us to place a lower limit on the disruption timescale and make an estimate of the total mass.
JSB01 represent the time since disruption () as
| (2) |
where is the width of the streamer at radius , is the angular length of the streamer, and is the radius of a circular orbit with the same energy as the true orbit. The width of the streamer is 490 pc at a projected galactocentric distance of 8 kpc. It is possible to trace almost half of a complete ellipse in the (–) color map, so we take a value of for . The circular velocity at 8 kpc is 250 km/s (Hui et al. 1995), and we assume that is approximately half way between the apocenter and pericenter of the orbit, a value of 5.8 kpc. This provides a lower limit on the time since disruption, as there may be additional parts of the stream that are not visible. Using this formulation, we find that the time since disruption is at least 240 Myr.
The one confirmed star cluster has an age that is consistent with this disruption timescale. By comparing the integrated color of the arc to the Bertelli et al. (1994) evolutionary tracks in Figure 9 we derive a luminosity-weighted, single stellar population age of Myr. The agreement of these three ages suggest a scenario where the stars in the arc formed during a tidally triggered event as their parent body passed through the potential of NGC 5128.
JSB01 also describe the mass of a stellar streamer as
| (3) |
where is the pericentric distance of the orbit, and all the other quantities are the same as above. Modulo inclination effects that change the values of and , we derive a mass of for the blue tidal stream. Using the luminosity measured in section 5.2, this gives a mass-to-light ratio of . The total luminosity of the arc is likely to be underestimated because of extinction, and because our measured value is only for the brightest quarter of the arc. However, this is still a reasonable estimate because stars in a stream will pile up at apocenter rather than evenly distribute themselves through the orbit. The resulting value is very similar to what is measured in Local Group dIs (e.g. Mateo 1998).
Published H I observations in the vicinity of the tidal stream allow us to place more constraints on its nature. A survey for H I in NGC 5128 by Schiminovich et al. (1994) revealed shell-like structures that they associate with the optical shells. While their NW shell is close to the apocenter of the stream, there is no H I detected along the tidal stream. Likewise, Charmandaris, Combes, & van der Hulst (2000) detected CO in the H I shells, but none in the vicinity of the tidal stream. In fact, their “S4” pointing was very close to the apocenter of the stream, and was a non-detection. The lack of neutral atomic or molecular gas is not entirely unexpected, as we see neither a young ( Myr) population of massive stars nor any obvious H II regions that would be the signature of ongoing star formation. This is in contrast to the AGN jet-induced star formation currently ongoing in the NE halo, where stars have ages of 1–15 Myr, and the spatial groupings are much looser (Fassett & Graham 2000).
Recent X-ray observations by Chandra also show diffuse structure in the region of the tidal stream (Karovska et al. 2002). It is also possible that interactions with the hot halo gas may have affected the stream’s formation or evolution.
7 Conclusions
The detection of tidal debris streams in the halos of nearby galaxies is a burgeoning field that promises to shed new light on galaxy building. Using broadband optical color maps, we have identified one of the first trails of young stellar debris—a young blue tidal stream in the halo of the nearest giant elliptical galaxy, NGC 5128. Associated with this arc are numerous blue star clusters, one of which is both spectroscopically confirmed and massive enough to be a young globular cluster. The mean age of the unresolved blue light, age of the star cluster, and dynamical disruption timescale all have values of 200–400 Myr. We propose that this stream of young stars was formed when a dwarf irregular galaxy, or similar sized gas fragment, underwent a tidally triggered star formation episode as it fell into NGC 5128 and was disrupted Myr ago. Non-detections to date of neutral or molecular gas in the stream is consistent with the lack of obvious OB associations or resolved H II regions, implying that the star formation is no longer ongoing.
The larger merger event that formed the central gas disk has a wide range of published ages, from 200 Myr (Quillen et al. 1993) to 750 Myr (Sparke 1996). While it is strongly possible that the formation of the tidal stream occurred in tandem with the larger merger, perhaps as an infalling satellite of the larger galaxy, we emphasize that the stream’s morphology, stellar age, and gas content now makes it distinct from both the central disk and the jet-induced star formation in the NE halo.
The stars and star clusters from this tidal stream will eventually disperse into the main body of NGC 5128, suggesting that the late infall of gas-rich dwarf galaxies may play an important a role in the building of stellar halos. Future spectroscopic observations of the blue star clusters will provide valuable information on the stream’s metallicity distribution and kinematic structure.
References
- Banks et al. (1999) Banks, G. D. et al. 1999, ApJ, 524, 612
- Bertelli et al. (1994) Bertelli, G., Bressan, A., Chiosi, C., Fagotto, F., & Nasi, E. 1994, A&AS, 106, 275
- Bertin & Arnouts (1996) Bertin, E. & Arnouts, S. 1996, A&AS, 117, 393
- Charmandaris, Combes, & van der Hulst (2000) Charmandaris, V., Combes, F., & van der Hulst, J. M. 2000, A&A, 356, L1
- Choi, Guhathakurta, & Johnston (2000) Choi, P. I., Guhathakurta, P., & Johnston, K. V. 2002, AJ, in press (astro-ph/0111465)
- Côté, Freeman, Carignan, & Quinn (1997) Côté, S., Freeman, K. C., Carignan, C., & Quinn, P. J. 1997, AJ, 114, 1313
- Côté, Marzke, & West (1998) Côté, P., Marzke, R. O., & West, M. J. 1998, ApJ, 501, 554
- Davis et al. (1985) Davis, M., Efstathiou, G., Frenk, C. S., White, S. D. M. 1985, ApJ, 292, 371
- Donoho (1992) Donoho, D. L. 1992, ”De-noising via soft-thresholding”, IEEE Transactions on Information Theory, 41, 613–627.
- Dufour et al. (1979) Dufour, R. J., Harvel, C. A., Martins, D. M., Schiffer, F. H., Talent, D. L., Wells, D. C., van den Bergh, S., & Talbot, R. J. 1979, AJ, 84, 284
- Fassett & Graham (2000) Fassett, C. I. & Graham, J. A. 2000, ApJ, 538, 594
- Girardi & Bica (1993) Girardi, L. & Bica, E. 1993, A&A, 274, 279
- González Delgado & Leitherer (1999) González Delgado, R. M. & Leitherer, C. 1999, ApJS, 125, 479
- González Delgado, Leitherer, & Heckman (1999) González Delgado, R. M., Leitherer, C., & Heckman, T. M. 1999, ApJS, 125, 489
- Goudfrooij et al. (2001) Goudfrooij, P., Mack, J., Kissler-Patig, M., Meylan, G., & Minniti, D. 2001, MNRAS, 322, 643
- Graham (1979) Graham, J. A. 1979, ApJ, 232, 60
- Harris, Hesser, Harris & Curry (1984) Harris, G. L. H., Hesser, J. E., Harris, H. C., & Curry, P. J. 1984, ApJ, 287, 175
- Helmi et al. (1999) Helmi, A., White, S., de Zeeuw, P. T., Zhao, H. 1999, Nature, 402, 53
- von Hoerner (1957) von Hoerner, S. 1957, ApJ, 125, 451
- Hui, Ford, Ciardullo, & Jacoby (1993) Hui, X., Ford, H. C., Ciardullo, R., & Jacoby, G. H. 1993, ApJ, 414, 463
- Hui, Ford, Freeman, & Dopita (1995) Hui, X., Ford, H. C., Freeman, K. C., & Dopita, M. A. 1995, ApJ, 449, 592
- Ibata et al. (2001a) Ibata, R., Irwin, M., Lewis, G., Stolte, A. 2001, ApJ, 547, 133
- Ibata et al. (2001b) Ibata, R., Irwin, M., Lewis, G., Ferguson, A. M. N., & Tanvir, N. 2001, Nature, 412, 49
- Jedrzejewski (1987) Jedrzejewski, R. I. 1987, MNRAS, 226, 747
- Johnston, Sackett, & Bullock (2001) Johnston, K. V., Sackett, P. D., & Bullock, J. S. 2001, ApJ, 557, 137 (JSB01)
- Karovska et al. (2002) Karovska, M., Fabbiano, G., Nicastro, F., Elvis, M., Kraft, R. P., & Murray, S. S. 2002, ApJ, in press
- Klypin et al. (1999) Klypin, A., Kravtsov, A. V., Valenzuela, O., & Prada, F. 1999, ApJ, 522, 82
- Landolt (1992) Landolt, A. U. 1992, AJ, 104, 340
- Lang (1980) Lang, K. R. 1980, Astrophysical Formulae. A Compendium for the Physicist and Astrophysicist, XXIX, 783 pp. 46 figs., 69 tabs.. Springer-Verlag Berlin Heidelberg New York.
- Majewski et al. (1999) Majewski, S., et al. 1999, AJ, 118, 1709
- Malin & Carter (1983) Malin, D. F. & Carter, D. 1983, ApJ, 274, 534
- Malin & Hadley (1997) Malin, D. & Hadley, B. 1997, in “The Nature of Elliptical Galaxies; 2nd Stromlo Symposium. ASP Conference Series; Vol. 116; 1997; ed. M. Arnaboldi; G. S. Da Costa; and P. Saha (1997), p.460
- Malin, Quinn, & Graham (1983) Malin, D., Quinn, P., & Graham, J. 1983, ApJ, 272, 5
- Mandushev, Staneva, & Spasova (1991) Mandushev, G., Staneva, A., & Spasova, N. 1991, A&A, 252, 94
- Mateo (1998) Mateo, M. L. 1998, ARA&A, 36, 435
- Morrison et al. (2000) Morrison, H. L., Mateo, M., Olszewski, E. W., Harding, P., Dohm-Palmer, R. C., Freeman, K. C., Norris, J. E., & Morita, M. 2000, AJ, 119, 2254
- Newberg et al. (2002) Newberg, H. J., Yanny, B., Rockosi, C. et al. 2002, ApJ, 569, 245
- Odenkirchen et al. (2001) Odenkirchen, M., et al. 2001, ApJ, 548, 165
- Pizer (1987) Pizer, S. M., Amburn, E. P., Austin, J. D., Cromartie, R., Geselowitz, A., Greer, T., Romeny, B. t. H., Zimmerman, J. B., & Zuiderveld, K. 1987, ”Adaptive Histogram Equalization and Its Variations”, Computer Vision, Graphics and Image Processing, 39, 355–368.
- Quillen, Graham, & Frogel (1993) Quillen, A. C., Graham, J. R., & Frogel, J. A. 1993, ApJ, 412, 550
- Searle & Zinn (1978) Searle, L. & Zinn, R. 1978, ApJ, 225, 357
- Schiminovich, van Gorkom, van der Hulst, & Kasow (1994) Schiminovich, D., van Gorkom, J. H., van der Hulst, J. M., & Kasow, S. 1994, ApJ, 423, L101
- Schlegel, Finkbeiner, & Davis (1998) Schlegel, D. J., Finkbeiner, D. P., & Davis, M. 1998, ApJ, 500, 525
- Shang et al. (1998) Shang, Z., et al. 1998, ApJ, 504, L23
- Valdes (1998) Valdes, F. G. 1998, ASP Conf. Ser. 145: Astronomical Data Analysis Software and Systems VII, 7, 53
| Filter | (U B)0 | (B V)0 | (V R)0 | (–)0 | |||||
|---|---|---|---|---|---|---|---|---|---|
| Diffusea | 16.60 | 16.70 | 16.59 | 16.39 | |||||
| Star Cluster | 19.12 | 19.15 | 18.91 | 18.68 | 18.42 | 0.04 | 0.24 | 0.23 | 0.49 |
| Totalb | 16.40 | 16.50 | 16.37 | 16.18 | 0.10 | 0.13 | 0.19 | ||
| Total(abs)c | 11.32 | 11.22 | 11.35 | 11.54 |
Note. — All photometry is corrected for Galactic foreground reddening using the extinction maps of Schlegel, Finkbeiner, & Davis (1998).
| H (Å) | H (Å) | H (Å) | H8 (Å) | H9 (Å) |
|---|---|---|---|---|
| 11 | 14 | 13 | 13 | 10 |