Optical Recombination Lines of Heavy-elements
in Giant Extragalactic H II Regions111Based on observations made with William Herschel
Telescope operated on the island of La Palma by the Isaac Newton
Group of Telescopes in the
Spanish Observatorio del Roque de Los Muchachos of the
Instituto de Astrofísica de Canarias.
Abstract
We present high resolution observations of the giant extragalactic H II regions NGC 604, NGC 2363, NGC 5461 and NGC 5471, based on observations taken with the ISIS spectrograph on the William Herschel Telescope. We have detected -by the first time- C II and O II recombination lines in these objects. We find that recombination lines give larger C++ and O++ abundances than collisionallly excited lines, suggesting that temperature variations can be present in the objects. We detect [Fe IV] lines in NGC 2363 and NGC 5471, the most confident detection of optical lines of this kind in H II regions. Considering the temperature structure we derive their H, He, C, N, O, Ne, S, Ar, and Fe abundances. From the recombination lines of NGC 5461 and NGC 5471 we determine the presence of C/H and O/H gradients in M101. We calculate the / and / values considering the presence of temperature variations and under the assumption of constant temperature. We obtain a better agreement with models of galactic chemical evolution by considering the presence of temperature variations than by assuming that the temperature is constant in these nebulae.
1 Introduction
The analysis of the spectra of H II regions allows to determine the abundances of He, C, N, O, Ne, S, Ar and Fe in the ionized phase of the interstellar medium. This is useful to trace the chemical evolution of the interstellar gas, to compute the radial abundance gradients in spiral galaxies and even to estimate the primordial helium abundance. Due to the surface brightness of distant extragalactic H II regions it is possible to measure their line intensities with reasonable accuracy. Therefore, it is essential and feasible to have confident determinations of their chemical composition. The possibility to obtain deep spectra of H II regions with large telescopes allows us to detect and measure important faint emission lines. Among these, recombination lines (hereafter RLs) of heavy element ions are of special interest. The brightest RLs of heavy element ions in the optical domain are C II 4267 Å and those of multiplet 1 of O II around 4650 Å. These are in fact very faint lines that have an intensity of the order of 0.001 . These lines can give us a more complete view of the physics and chemical content of nebulae and can be used to test if the standard methods for deriving chemical abundances –based on the intensity of bright collisionally excited lines (hereafter CELs)– are valid.
The ionic abundances of elements heavier than He are usually derived from the intensity of CELs, which depend exponentially on the electron temperature () of the nebular gas. This fact makes necessary to have a very precise determination of to obtain reliable ionic abundances. Peimbert (1967) found that in the presence of inhomogeneities or stratification in the spatial distribution of (the so-called temperature fluctuations, defined by the mean square temperature variation over the observed volume: ) the ionic abundances obtained from the intensity of CELs are systematically underestimated. In comparison, ionic abundances determined from RLs are almost independent on and are not sensible to the effects of possible temperature structure inside the nebula. However, the faintness of these lines makes very difficult their measurement and even their detection. Esteban et al. (1998, 1999a, 1999b) have obtained high resolution observations of the Galactic H II regions Orion nebula, M8, and M17, obtaining good measurements of C II and O II lines in the three objects. These authors have found that ionic abundances derived from those RLs are systematically larger than the values obtained from CELs. A similar result has been obtained by Tsamis et al. (2003) who present measurements of C II, N II, and O II lines for Orion nebula, M17, NGC 3576, and three Magellanic Clouds H II regions (30 Doradus, LMC N11, and SMC N66).
The main aim of the observations reported in this paper was to detect and measure C II and O II lines in bright giant extragalactic H II regions (hereafter GEHRs) of the northern hemisphere. These observations will permit to compare the O++ abundances obtained by both CELs and RLs from the same spectrum as well as to derive the C++ abundance and compare them with the values derived by other authors from space observations of the UV [C III] 1907 C III] 1909 Å lines.
2 Observations
The observations were made on 2001 February 25 and 26 at the Observatorio del Roque de los Muchachos (La Palma), using the 4.2 m William Herschel Telescope (WHT) with the ISIS spectrograph at the Cassegrain focus. Two different CCDs were used at the blue and red arms of the spectrograph: an EEV12 CCD with a configuration of 40962048 pixels of 13 m in the blue arm and a TEK with 10241024 of 24 m in the red arm. The spatial scale was 0.19 arcsec pixel-1 and 0.36 arcsec pixel-1 for the blue and red arms respectively. The maximum unvignetted slit-length usable with ISIS is 3.7′ and the width was 1′′. The dichroic used to separate the blue and red beams was set at 5400 Å. Two gratings were used, a 1200 g mm-1 one in the blue and a 316 g mm-1 one in the red arm. These gratings gave reciprocal dispersions of 17 and 62 Å mm-1, and effective resolutions of 0.73 Å and 2.9 Å for the blue and red arms, respectively. The blue spectra cover from 4230 Å to 5060 Å and the red ones from 5720 Å to 7200 Å. A summary of the observations is presented in Table 1.
The average seeing was between 0.8′′ and 2′′ throughout the observations. The slit center and position angle (PA) was chosen to cover the brightest zone of each H II region. For NGC 604 we centered our slit on zone D defined by D’Odorico, Rosa, & Wampler (1983) that was also observed by Díaz et al. (1987). NGC 5461 is rather compact and we placed the slit center on the bright core passing through two fainter H II regions located at 15 and 30 arcsec to the southeast (see image shown by Giannakopoulou-Creighton. Fich, & Wilson, 1999). For NGC 5471 we centered the slit passing through the knots labeled as A and C by Skillman (1985, see his Figure 1). Finally, for NGC 2363 our slit position covered knots A and B defined by González-Delgado et al. (1994, see their Figure 2). Several 30 min exposures were combined to produce the final blue and red spectra of the objects. As we can see in Table 1, the total exposure time for the objects was very large (between 2.5 and 7 hours), this indicates that we are at the limit of the possibilities of a 4m-class telescope. Comparison lamp exposures (CuAr + CuNe) were taken between consecutive spectra of the same object. The absolute flux calibration was achieved by observations of the standard stars Feige 15, Feige 25, Feige 56 (Stone, 1977), Feige 34, G191 B2B (Massey et al., 1988), and BD+33 2642 (Oke, 1990). The correction for atmospheric extinction was performed using an average curve for the continuous atmospheric extinction at Roque de los Muchachos Observatory.
The data were reduced using the standard 222IRAF is distributed by NOAO, which is operated by AURA, under cooperative agreement with NSF. LONGSLIT reduction package to perform bias corrections, flatfielding, cosmic ray rejection and flux calibration.
3 Line Intensities and Physical Conditions
Line intensities were measured integrating all the flux in the line between two given limits and over a local continuum estimated by eye. In the few cases of line-blending, the line flux of each individual line was derived from a multiple Gaussian profile fit procedure. All these measurements were made with the SPLOT routine of the package.
All the line intensities of a given spectrum have been normalized to a particular bright recombination line present in each wavelength interval. For the blue spectra the reference line was H. For NGC 604, NGC 5461 and NGC 2363 it was necessary to take shorter exposures in the red arm to avoid problems of saturation of H. In these three objects we normalized the line intensities measured in the longer exposure spectra to He I 5876 Å. Finally, the intensity ratios were re-scaled to the (He I 5876)/(H) ratio obtained from the shorter exposure red spectra.
The reddening coefficient, (H), was determined by fitting iteratively the observed (H)/(H) ratio to the theoretical one computed by Storey & Hummer (1995) for the physical conditions determined for each object (see below) and assuming the extinction law of Seaton (1979). The Balmer line intensities were not corrected for the presence of underlying stellar absorption lines due to their large equivalent widths in emission. In Table 2 we present the (H) values for all the objects. Alternatively, the 4388, 4471, and 4922 He I lines present in Table 2 were corrected for underlying absorption considering the starburst models of González-Delgado, Leitherer, & Heckman (1999) and considering that the observed continuum is due to a stellar component plus a nebular component. The observed intensities of these helium lines (corrected for reddening but not for underlying absorption) were: 0.50, 4.14, and 1.07 for NGC 604; 0.41, 4.11, and 1.09 for NGC 5461; 0.41, 3.89, and 0.89 for NGC 5471; and 0.46, 3.93, and 0.98 for NGC 2363. The line intensities of the blue arm spectra were corrected for reddening with respect to H and the red arm ones with respect to H. Finally, the resulting reddening corrected line ratios of the red arm spectra were re-scaled to (H) simply multiplying by the theoretical (H)/(H) corresponding to the physical conditions derived for each nebula.
The values of (H) obtained are consistent with those obtained by other authors for NGC 604 (0.30: Díaz et al., 1987) and NGC 5471 (0.02: Garnett et al. 1999; 0.18: Luridiana et al. 2002), slightly lower in the case of NGC 5461 (0.56: Garnett et al. 1999; 0.45: Luridiana et al. 2002), and clearly higher in the case of NGC 2363 (0.25: Peimbert et al. 1986; 0.20: González-Delgado et al. 1994). The reason of the large difference found in the case of NGC 2363 is unknown but seems to be a real feature and not an error in the flux calibration nor an effect of atmospheric refraction. The final spectrum used for NGC 2363 is a combination of several spectra taken in two consecutive nights, calibrated independently with different standard stars and giving a similar value of (H) (0.74 for February 25th and 0.66 for February 26th). In any case, the effect on the derived intensity ratios is not large because the emission lines of the blue arm spectra have been corrected for reddening with respect to H and those of the red arm with respect to H. Therefore, the wavelength baseline between the lines is not large enough to produce strong intensity uncertainties. By comparing the intensities obtained from our (H) value with those obtained from the (H) value by González-Delgado et al. (1994) the differences in the line intensities reach a maximum of 15% for the C II 4267 Å , [N II] 5755 Å , and He I 5876 Å lines and are considerably smaller for the other lines.
The final list of observed wavelengths (referred to the heliocentric reference frame) and line intensities (including their uncertainties) relative to H for all the objects is presented in Table 2. Colons indicate uncertainties of the order of or larger than 40 per cent. For a given emission line, the observed wavelength is determined by the centroid of a Gaussian fit of its line profile and it is included in columns 5, 7 , 9, and 11 of Table 2.
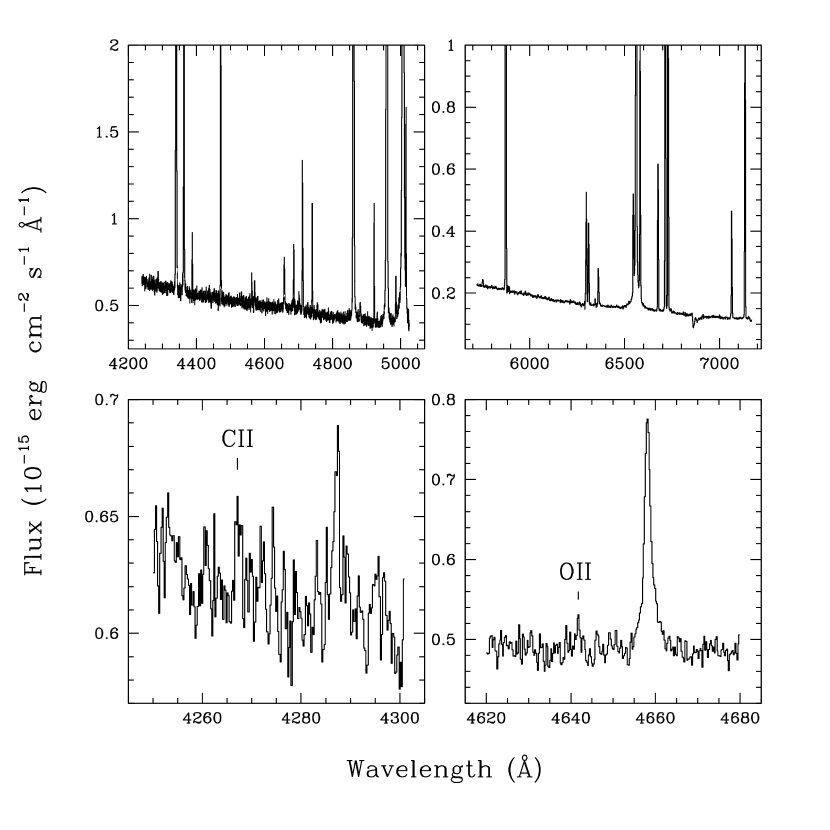
Figures 1 to 4 show the spectra of the four GEHRs observed. Enlargement of the spectral zones containing C II 4267 Å line and the lines of multiplet 1 of O II (around 4650 Å) are included in the figures. It is evident that the C II 4267 Å line is well measured in the spectra of NGC 604 and NGC 5461 and barely detected in NGC 2363 and NGC 5471. Grandi (1976) showed that recombination dominates the excitation of C II 4267 Å by an order of magnitude. This line comes from a transition involving terms with large values (3-4), levels that cannot be excited by permitted resonance transitions from the ground term (2). We have detected several lines of different multiplets of O II in the spectra of the GEHRs observed. In most of the cases the lines are at the detection level, only those belonging to multiplet 1 –the brightest one– have enough signal-to-noise ratio to be reasonably well measured (see Figures 1 to 4). Several lines of multiplet 1 of O II are measured in the objects except in the case of NGC 5471, where only one line is detected. It is worth noting that LS-coupling predicts that O II 4649 Å is the brightest line of multiplet 1, and this is what it is observed in NGC 5461, NGC 2363, and also in the Orion nebula (Esteban et al., 1998). However, in the case of NGC 604 that line is too weak with respect the other lines of the multiplet. This anomalous trend has been reported in the spectra of the two slit positions observed in M17 by Esteban et al. (1999b) as well as in the three Magellanic Cloud H II regions observed by Tsamis et al. (2003), but to a lesser extent, in some planetary nebulae (Liu, 2003). Liu (2003) pointed out that this might be caused by the under-population of the ground fine-structure level of the recombining O++ relative to its statistical equilibrium value. The excitation mechanism of the O II spectrum was also investigated by Grandi (1976). The presence of many emission lines of different multiplets of O II in the spectra of H II regions cannot be explained by resonance fluorescence, in fact some of those observed in NGC 604 come from 4f-3d transitions (multiplets 66 and 67) these lines cannot be excited by fluorescence from the 2 ground level. Therefore, recombination is the dominant excitation mechanism of the observed O II lines in NGC 604, but very probably for H II regions in general.
We have observed several lines of Si II in all the objects. These lines belong to multiplets 2 and 4, which correspond to doublets. Grandi (1976) has found that starlight excitation of the 5 and 4 terms (levels that feed the observed transitions) dominates over recombination in producing the observed intensities in H II regions. Other interesting lines observed are those of Mg I], the strongest semiforbidden optical lines in nebular spectra, corresponding to transitions. These lines have been observed in bright planetary nebulae (PNe) and are always weak, with intensity in the range 0.05-1.00 per cent of the H intensity (see Allan et al., 1988, and references therein). Baldwin et al. (2000) measured the Mg I] 4571.1 Å line in the Orion nebula (intensity about 0.009 percent of H), as far as we know, the first detection of this line reported in an H II region. Clegg et al. (1987) and Allan et al. (1988) have found that the weakness of this line in PNe is due to the Mg0+H+ charge-transfer reaction, in the absence of which the intensity would be higher. This conclusion can be also applied to the spectra of H II regions.
In Figures 1 and 2 it can be seen that NGC 604 and NGC 5461 show broad emission features around 4650 Å and 5800 Å, which are produced by Wolf-Rayet (WR) stars. The bump in the blue spectra is produced by the blend of He II 4686 Å, N III 4640 Å, and perhaps N V 4620 Å, characteristic of WN stars. On the other hand, the detection of the C IV 5808 Å broad emission feature indicates the presence of WC stars which can also contribute to a fraction of the emission around 4650 Å. The detection of WR stars in NGC 604 was independently reported by D’Odorico & Rosa (1981) and Conti & Massey (1981). In their spectroscopical study of NGC 604 D’Odorico, Rosa, & Wampler (1983) detect WC emission at their zone D, which encompasses the brightest part of our slit position in this object. Drissen, Moffat, & Shara (1993) obtain images of the ionizing cluster of NGC 604 finding three individual WR stars (their WR1, WR2a, and WR2b) in the zone in common with our extracted 1-D spectrum. In the case of NGC 5461, the presence of the blue WR bump around 4650 Å was first detected by Rayo, Peimbert, & Torres-Peimbert (1982) and later confirmed by D’Odorico, Rosa, & Wampler (1983). Our deep spectrum of NGC 5461 has revealed also a faint bump corresponding to C IV 5808 Å, this indicates -for the first time- the presence of WC stars in this region.
There are several references about the detection of WR stars in NGC 5471, (see Schaerer, Contini, & Pindao, 1999, and references therein), but we only find faint narrow He II 4686 Å emission in our deep spectrum. Izotov, Thuan, & Lipovetsky (1997) report broad and nebular He II 4686 Å emission in the brightest zone of NGC 2363 (zone A). However, we only find nebular He II 4686 Å emission in this zone.
The O II lines of multiplet 1 are in the problematic spectral zone where the WR emission feature is present. This could lead to be suspicious of some contamination of stellar emission in the lines identified as O II. However, several reasons lead us to be fairly confident that the emission lines identified as belonging to O II are of true nebular nature and not due to stellar emission. Firstly, the detection of several lines that can be identified as of O II (except for NGC 5471). Secondly, the observed rest wavelength of all the lines are consistent with their identification as O II ones inside the uncertainties in the wavelength calibration. Finally, they have a line width similar to that of the rest of the nebular lines. In fact the width of the WR bump in NGC 604 and NGC 5461 is clearly much broader than the nebular lines. Our relatively high spectral resolution permits a proper discrimination between nebular and stellar emission in this problematic spectral zone.
In Table 3 we show the physical conditions derived for the four GEHRs from the observed emission line ratios and the five-level program for the analysis of emission line nebulae of Shaw & Dufour (1995). The electron density, has been derived from the ratio of the [S II] 6717, 6731 Å doublet for all the objects and also from the [Ar IV] 4711, 4740 Å doublet in the case of the higher degree of ionization nebulae (NGC 5471 and NGC 2363). The electron temperature, has been derived from both the [O III] and [N II] emission line ratios. The values of and obtained are in good agreement with those reported in previous works. In the case of NGC 2363, we report the first determination of ([N II]).
4 Ionic Abundances from Collisionally Excited Lines
Ionic abundances of N+, O++, S+, S++, Ar++, Ar3+, and K3+ have been obtained from the intensity of CELs, using the five-level atom program of Shaw & Dufour (1995), and the atomic parameters referenced in it. We have measured several [Fe III] lines in all the H II regions and detected [Fe IV] lines in NGC 5471 (one line) and NGC 2363 (four lines). Although [Fe III] lines were previously reported in NGC 5461 (Torres-Peimbert, Peimbert, & Fierro, 1989) and NGC 5471 (Skillman, 1985), the Fe++/H+ ratio has been never determined for these objects. Following Rodríguez (2002), we have used the Fe III collision strengths of Zhang (1996) and transition probabilities of Quinet (1996) to obtain the Fe++ abundance. No optical [Fe IV] lines have been previously detected with confidence in H II regions. Izotov, Chaffee & Schaerer (2001) report a dubious detection of [Fe IV] 4907 Å in a low resolution spectrum of the blue compact dwarf galaxy SBS 0335-052 and Rubin et al. (1997) report the detection of [Fe IV] 2837 Å in the UV spectrum of the Orion nebula. Therefore NGC 2363 and NGC 5471 are -by now- the H II regions where optical [Fe IV] lines have been most clearly identified. The Fe3+/H+ ratio has been determined considering all collisional and downward radiative transitions from the 33 lower levels of Fe3+. To make these calculations we have used the collision strengths of Zhang & Pradhan (1997) and the transition probabilities recommended by Froese Fischer & Rubin (1998) and those of Garstang (1978) for those transitions not included in that reference. We have assumed a two-zone scheme for deriving the ionic abundances, adopting ([O III]) for the high-ionization-potential ions O++, S++, Ar++, Ar3+, K3+, and Fe3+ and ([N II]) for the low-ionization-potential ions N+, S+, and Fe++. The ionic abundances obtained are listed in Table 4.
5 Ionic Abundances from Recombination Lines
We can derive ionic abundances from RLs for C++, and O++ and they are presented in Table 5. C II 4267 Å is a case-insensitive recombination line and it is located in a spectral zone without problems of line-blending. These important features make C II 4267 Å a suitable line to derive a proper value of the C++ abundance. We have used the C II values recently calculated by Davey, Storey, & Kisielius (2000) to derive the C++ abundance. We have assumed ([O III]) as representative of the zone where this ion is located. The C++/H+ ratio obtained for each object is included in Table 5. There are two previous calculations of the effective recombination coefficient for C II 4267 Å one by Pequignot, Petitjean, & Boisson (1991) and other by Pengelly (1963). We have compared the C++/H+ ratios obtained making use of the different CII values finding that Davey, Storey, & Kisielius (2000) and Pequignot, Petitjean, & Boisson (1991) give virtually the same abundances (inside 0.01 dex) whilst the CII obtained by Pengelly (1963) gives C++/H+ ratios about 0.08 dex higher.
Storey (1994) has computed the O II , assuming LS coupling and different cases (A, B, and C). We have used these coefficients to derive the O++ abundances listed in Table 5. The physical conditions assumed are the same as for the C II calculations. The abundances determined from multiplet 1 are almost independent of the case but case B seems to be more appropriate for quartets (see Liu et al., 1995). Taking into account the faintness of the individual lines of O II we have derived the abundances adding the intensity of all the observed lines of multiplet 1 and multiplying it by a correction factor which introduces the expected contribution of unobserved lines of the multiplet assuming LS-coupling (see Esteban et al., 1998). The abundance derived by this method reduce the observational errors related with the faintness of the lines and minimize the effects of possible departures from LS-coupling, as it has been noticed to occur in several objects considering the weakness of O II 4649 Å line with respect the other ones of the same multiplet (see Sect. 6).
6 Temperature fluctuations in GEHRs
Ionic abundances from CELs often differ from those derived from RLs in ionized nebulae. Esteban et al. (1998, 1999a, 1999b) have found that the difference is between 0.1 and 0.3 dex in three of the brightest Galactic H II regions. Moreover, Tsamis et al. (2003) obtain similar differences for the Orion nebula and M17 and between 0.30 and 0.69 dex for three Magellanic Clouds H II regions. In the case of planetary nebulae (PNe) the differences vary from one object to another and can be as large as a factor of ten for some PNe (Rola & Stasińska, 1994; Peimbert, Torres-Peimbert, & Luridiana, 1995; Liu, 2002). This discrepancy between the abundances obtained from CELs and RLs is a crucial problem because most of our knowledge of chemical abundances in distant objects -specially in extragalactic ones- comes from determinations based on the intensity of CELs.
Torres-Peimbert et al. (1980) proposed that the abundance discrepancy between calculations based on CELs and RLs may be produced by the presence of spatial fluctuations of the electron temperature in the nebulae, parametrized by (Peimbert, 1967). This is due to the different dependence of the emissivity of CELs and RLs on electron temperature, . While the ratio of two RLs is almost independent of , the ratio of a CEL with respect to a RL is strongly dependent on it.
Another argument in favor of the presence of temperature variations in gaseous nebulae is the determination of and based on ([O III]) and (Bac). Some of the best determinations of (Bac) in planetary nebulae are those by Peimbert (1971), Liu & Danziger (1993), Liu et al. (1995, 2000, 2001). Liu et al.(2001), presented a good correlation between and ([O III])–(Bac) and mention that this correlation strongly supports the idea that the temperature variations are real, moreover Torres-Peimbert & Peimbert (2003) find that there is good agreemnet between the values determined from the CELs/Rls values and those determined from ([O III]) and (Bac) for three of the planetary nebulae with the largest values in the literature.
Torres-Peimbert and Peimbert(2003) present a review on tempertaure variations in planetary nebulae and discuss seven possible causes that could explain temperature variations in a given object. One of the possible explanations could be due to the presence of a small mass of extremely cold ( 103 K), metal and helium-rich inclusions embedded in diffuse material of “normal” temperature and abundances (see Liu 2002, 2003; Pequignot et al. 2002, 2003) This mechanism is not important in H II regions because they are not directly produced by stellar ejecta. Esteban(2002) reviews indirect evidence that indicates the presence of temperature variations in H II regions.
Assuming the validity of the temperature fluctuations paradigm, the comparison of the abundances determined from both kinds of lines for a given ion should provide an estimation of . In Table 6 we compare the O++/H+ and C++/H+ ratios obtained from CELs and RLs and the values that produce the agreement between both. For the O++/H+ ratios, the values obtained from RLs are always about 0.2 to 0.35 dex larger than those derived from CELs measured in the same spectra, the associated parameter is between 0.027 and 0.128. For the C++/H+ ratios the comparison between values obtained from CELs and RLs is not so direct. The brightest CELs of C++ are [C III] 1907 C III] 1909Å , which are in the UV and have to be measured from space observations. Garnett et al. (1999) have observed NGC 5461 and NGC 5471 with the spectrograph at the deriving their C++ abundance. The C++/H+ values included in Table 6 are the higher and lower limits computed by Garnett et al. (1999) because of the uncertainty in the choice of UV reddening function from their data. Peimbert, Peña, & Torres-Peimbert (1986) obtained measurements of the [C III] 1907 C III] 1909Å lines for NGC 2363 and derived its C++/H+ ratio, which is also included in Table 6. For NGC 5471 and NGC 2363 the values of obtained from the comparison of the C++ abundances are consistent with those obtained from O++/H+. For NGC 5461 only the C++/H+ ratio derived assuming = 5 give a consistent with that estimated from the comparison of O++ abundances.
The values of obtained for bright Galactic H II regions by Esteban et al. (1998, 1999a, 1999b) are also included in Table 6 for comparison. It is important to remark that the C++ abundance of the two slit positions observed for M17 by Esteban et al. (1999b) are now corrected due to an error present in that paper [12+log(C++/H+) is actually 8.57 and 8.69 for slit positions 3 and 14 and not 8.76 and 8.88 as it was indicated in that paper] . In the cases of NGC 604 and NGC 5461, the magnitude of the fluctuations is modest and of the same order than those determined for the Galactic objects. Only the GEHRs of lower metallicity –but also higher observational uncertainties: NGC 5471 and NGC 2363– show larger values of . Observations of higher accuracy are needed to test this result.
The presence of in GEHRs has been a secular matter of discussion without a well established observational basis. The first indirect evidence reported was the significant differences between the O/H ratios obtained using the empirical calibration based on models and on observations. The differences are typically in the 0.20.4 dex range. Several authors suggested that such differences could be due to the presence of temperature inhomogeneities over the observed volume (Campbell, 1988; Torres-Peimbert, Peimbert, & Fierro, 1989; McGaugh, 1991). It is worth noting also that Peimbert, Sarmiento, & Fierro (1991) indicate that, in the presence of processes increasing the intensity of [O III] 4363 Å line (i. e. shocks) the [O III] 5007 Å and [O II] 3727 Å lines, and consequently , are almost unaffected.
There are few estimations of available for extragalactic objects. González-Delgado et al. (1994) find large values of =0.064-0.098 for NGC 2363 from the comparison of ([O III]) and (Pac), values not too different from our results. On the other hand, Terlevich et al. (1996) obtain 0.00 for NGC 604 making use of the same method. However, the derivation of from the comparison of ([O III]) and (Pac) –or (Bac)– has a large intrinsic uncertainty. Luridiana, Peimbert, & Leitherer (1999) have computed photoionization models for NGC 2363 and compare them with optical observational data. They are able to reproduce the observed emission-line spectrum and other properties of NGC 2363 only if they assume a metallicity 2.5 times higher than usually adopted and derived from the intensity of CELs. Luridiana, Peimbert, & Leitherer (1999) propose that the presence of temperature fluctuations can explain this discrepancy. It is remarkable that our results are in complete agreement with this suggestion. In fact, if we take the O/H abundance as reference of the metallicity and that O/H is largely O++/H+ in NGC 2363, our O++ abundance obtained from RLs is about 2.2 larger than the value we obtain from CELs. Following the conclusions by Luridiana, Peimbert, & Leitherer (1999), with this corrected metallicity for NGC 2363 it is possible: a) to reconcile the presence of WR stars with the current models of stellar evolution; b) reproduce most of the characteristics of the observed spectrum of the nebula; c) obtain a better agreement with the metallicity estimated making use of the parameter.
Another estimation of in an extragalactic H II region has been obtained by Peimbert, Peimbert, & Ruíz (2000) for NGC 346 who find =0.022 from the comparison of ([O III]) and (Bac) and a self-consistent determination of (He II). Additional indications of the possible presence of in GEHR and starburst galaxies have been given by Esteban & Peimbert (1995) and Pérez (1997). Esteban & Peimbert (1995) studied the chemical enrichment produced by massive stars in Wolf-Rayet galaxies, finding that the apparent abnormal position of some of these objects in O vs. and N vs. diagrams can be explained by the effect of large in the ionized gas associated with the intense star-forming bursts. On the other hand, Pérez (1997) has investigated the change of the ionization structure during the first Myrs of the evolution of a starburst. He has shown that large temperature fluctuations arise naturally in homogeneous gaseous spheres when the spectral energy distribution of the ionizing cluster hardens at about 3 Myr, coinciding with the onset of the WR phase.
Stasińska (2000) has discussed the problems that detailed photoionization models face to reproduce the observed [O III] 4363/5007 ratio of several GEHRs classified as Wolf-Rayet galaxies. The models always predict lower ratios than observed. In the case of I Zw 18, Stasińska & Schaerer (1999) obtain a temperature discrepancy of the order of 30%, which is a rather large value. Stasińska (2000) considers that the classical photoionization models fail and that temperature fluctuations produced by an unknown process could be present in these objects.
7 Helium abundances
The He/H value in an H II region is derived from recombination lines that are proportional to , therefore the total He/H value can be obtained from:
| (1) |
in particular it is important to include the factors when there are neutral atoms in regions of appreciable electron density. Equation (1) can be approximated by:
| (2) |
To obtain He+/H+ values we need a set of effective recombination coefficients for the He and H lines, the contribution due to collisional excitation to the helium line intensities, and an estimate of the optical depth effects for the helium lines. The recombination coefficients that we used were those by Hummer & Storey (1987) and Storey & Hummer (1995) for H, and Smits (1996) for He. The collisional contribution to the helium lines was estimated from Kingdon & Ferland (1995) and Benjamin, Skillman, & Smits (1999). The collisional contribution to the hydrogen lines was not taken into account. The optical depth effects in the triplet lines were estimated from the computations by Robbins (1968).
In Table 7 we present the He+/H+ values derived from six helium lines assuming no temperature variations; consequently and ([He II]) is given by the observed ([O III]) value. To estimate the optical depth of the triplet lines -represented by - and (He ii) we made use of Table 3 and the intensity of He I 7065 Å, which is very sensitive to both quantities; fortunately, the other helium line intensities are considerably less sensitive to (He ii) and . The He+/H value is based on the other helium lines excluding He I 7065 Å, with the exception of NGC 2363 where He I 5876 Å was also excluded due to an uncertain reddening correction. The He++/H+ values presented in Table 7 were obtained from the He II 4686 Å to H() ratio using line emissivities calculated by Hummer & Storey (1987) and Storey & Hummer (1995). The He0/H+ and (He) values presented in Table 7 were estimated from CLOUDY (Peimbert & Peimbert, 2002; Luridiana et al., 2002).
Similarly in Table 8 we present the He+/H+ values derived from six helium lines assuming temperature variations; consequently and ([He II]) is smaller than the observed ([O III]) value (Peimbert, Peimbert, & Luridiana, 2002).
8 Heavy element abundances
To derive the total abundances we need to adopt a value and to correct for unseen ionization stages by using ionization correction factors. The values of adopted for each object are those obtained from the comparison of the O++/H+ ratios obtained from CELs and RLs, which are given in Table 6. To correct the ionic abundances derived for the effect of temperature fluctuations we have made use of the expressions given by Peimbert & Costero (1969), some reference photoionization models by Stasińska (1990) (model C2C1 for NGC 604; C2B1 for NGC 5461; the average of C2D1 and D2D1 for NGC 5471; D4E1 for NGC 2363), and the most recent atomic parameters and line emissivities available for the different ions used. Since we do not observe [O II] lines in our spectra, we have derived the O+/H+ ratio from the intensity of [O II] 3727 Å doublet reported by other authors (references given in Table 9) for the brightest zones of each nebulae and assuming our values for the physical conditions. The uncorrected and corrected ionic and total abundances are presented in Table 9.
The absence or faintness of the He II 4686 Å line (and the low He++/H+ ratio associated) and the similarity between the ionization potentials of He+ and O++ implies the absence of significant O3+ in the objects. Therefore, to obtain the total oxygen abundance we have simply added the O+/H+ and O++/H+ ratios.
To derive the N abundance we have used the usual based on the similarity between the ionization potential of N+ and O+ (Peimbert & Costero, 1969) for all the objects. For these objects the models of Stasińska (1990) give values of the similar to the by Peimbert and Costero. Alternatively the models based on CLOUDY give somewhat larger (Relaño, Peimbert, & Beckman, 2002; Luridiana et al., 2002).
To derive the C abundance we only have direct determinations of the C++/H+ ratios therefore we have adopted the following equation
| (3) |
where the C++/O++ ratios are determined from RLs. The (C++/O++) values have been estimated from the models by Stasińska (1990) and Garnett et al. (1999) and fortunately are close to one.
We have measured CELs from two ionization stages of S: S+ and S++. Taking into account the ionization degree of the objects, an for the presence of S3+ has to be considered in all cases. We have adopted the given by the reference models, and the expected amount of S3+ results to be important in all cases, ranging from 1.45 for NGC 5461 to 5.15 for NGC 2363. Taking into account these high s we consider that the total S abundance we have derived is uncertain, specially for the objects of higher ionization degree: NGC 5471 and NGC 2363.
For Ar we have determinations of Ar++/H+ and Ar3+/H+. We do not expect significant contributions of Ar4+ but some Ar+ may be present. We have adopted the (Ar+++Ar3+) given by the reference photoionization models of Stasińska for all the objects. The are always very small being the largest that of NGC 5461, which amounts to 1.06.
We have measured lines of only one stage of ionization (Fe++) for NGC 604 and NGC 5461. In the case of NGC 5471 and NGC 2363 we have also detected lines of Fe3+. The contribution of Fe3+ is expected to be very important. On the other hand, some small contribution of Fe+ should be present, mainly in the nebulae of lower ionization degree. For all the objects, we have estimated the Fe/H ratio from the derived Fe++ abundance and adopting the (Fe++) given by the reference photoionization models. These models give very large values of that factor ranging from 6.2 to 41 (for NGC 604 and NGC 2363 respectively). We have compared with the given by the relation between the Fe++ abundance and O+/O++ obtained by Rodríguez (1996) from the models of Gruenwald & Viegas (1992), finding that the differences with our adopted values of the (Fe++) are only about 0.1 dex. In the cases of NGC 5471 and NGC 2363 we have also derived the gas-phase Fe/H ratio simply adding the Fe++/H+ and Fe3+/H+ ratios, which are expected to contain about the 97% of the total Fe abundance in the gas-phase according to the reference models. The Fe/H ratio obtained assuming s are in both cases much larger than the direct determination (0.35 dex for NGC 5471 and 0.65 for NGC 2363). This result was also obtained by Rubin et al. (1997) in the case of the Orion nebula, where their determination of the Fe/H ratio from the intensity of [Fe IV] 2837 Å line are much lower than the values obtained from the Fe++/H+ ratios and assuming an from detailed photoionization models. We agree with the suggestion of Rubin et al. (1997) that a reexamination of Fe3+ atomic data and perhaps improving H II region modeling would help to solve this problem.
9 Discussion
9.1 The O/H and C/H gradients in M101
The determination of the O/H and C/H ratios in NGC 5461 and NGC 5471 allows to derive the radial abundance gradients of these two elements in M101. The galactocentric distance of both H II regions is very different. NGC 5461 is located at 11.1 kpc and NGC 5471 at 26.2 kpc assuming a distance of 7.5 Mpc for M101 (Kelson et al., 1996).
The oxygen abundance gradient has been derived for M101 by many authors (Evans, 1986; Vila-Costas & Edmunds, 1992; Henry & Howard, 1995; Kennicutt & Garnett, 1996; Pilyugin, 2001). Our value of 0.038 dex kpc-1 has been computed from the O/H ratios obtained from RLs (using CELs and the slope becomes 0.035 dex kpc-1) and it is consistent with previous determinations (0.044: Vila-Costas and Edmunds 1992; 0.040 to 0.050: Kennicutt and Garnett 1992; 0.028: Pilyugin 2001) although it is rather uncertain due to the large observational error of the O/H ratio of NGC 5471.
Garnett et al. (1999) based on UV observations determined the presence of C/H and C/O gradients in external galaxies for the first time. For M101, those authors estimate two values of the C/H and two values for the C/O gradient depending on the value adopted (see Table 10). Our values of the C/H and C/O gradients derived from RLs are independent of the value adopted and are also presented in Table 10.
The values of C/O obtained for the objects in this paper based on RLs are similar or larger than previous determinations based on the intensity of CELs. For NGC 5461, our value is similar to that obtained by Garnett et al. (1999) assuming = 5 (0.37 dex) but smaller than their C/O ratio for = 3.1 (0.03 dex). For NGC 5471 and NGC 2363 our C/O ratios are 0.22 and 0.05 dex higher that those obtained by other authors (Garnett et al., 1999; Peimbert, Peña, & Torres-Peimbert, 1986).
9.2 The C/O ratio and chemical evolution
The exact value of the C/O gradient in a spiral galaxy is a strong constraint for models of chemical evolution and the star formation history. The evolution of C/O with O/H is very sensitive to the star formation/enrichment timescale because the different initial mass range of the main producers of both elements.
The O/H gradient for the Milky Way obtained by Esteban et al. (1999b) based on RLs is rather similar to the value found for M101 and it has been also included in Table 10 for comparison. The slope of the Galactic C/H gradient included in Table 10 is a revision of the value given by Esteban et al. (1999b) in their Table 13. This new slope has been re-calculated considering the recombination coefficients by Davey, Storey, & Kisielius (2000) and an error in the C++/H+ ratio of M 17 present in that paper (see Sect. 6).
A general correlation between C/O and O/H was obtained by Garnett et al. (1995) from UV observations of H II regions of dwarf irregular galaxies. This trend was later confirmed by Garnett et al. (1999) from similar observations of six H II regions in the spiral galaxies M101 and NGC 2403. We have found a similar behavior in our data, which are shown in Figure 5 along with the values for the Orion nebula, M8 and M17 (Esteban et al., 1998, 1999a, 1999b), and the Sun (Allende-Prieto, Lambert, & Asplund, 2001; Holweger, 2001). This graph is relevant because all the nebular data included are abundances derived from recombination lines, almost insensitive to potential electron temperature variations inside the nebulae.
The presence of C/O gradients in the Milky Way and M101 is a reflection of this correlation between C/O and metallicity. The behavior of C/O vs. O/H can be approximated by a power law
| (4) |
We have performed a regression analysis of the nebular data included in Figure 5 finding = 0.56 0.10 (by considering only the four GEHRS we find = 0.30 0.15) . This value of the slope is consistent with those obtained by Garnett et al. (1997) from a compilation of data for dwarf irregular galaxies (0.410.07) and the larger compilation by Henry & Worthey (1999) that includes irregular and spiral galaxies (slope between 0.48 and 0.59). This behaviour gives important insights into the origin and evolution of both elements. Simple chemical evolution models with instantaneous recycling predict a C/O = constant if both C and O are pure primary elements, and C/O O/H if O is primary and C secondary. As Garnett et al. (1999) have pointed out, since only primary sources of C are known to exist, the observed behavior of C/O vs. O/H indicates that the instantaneous recycling approximation does not hold for both elements and/or the yield of C varies with respect to O. In chemical evolution models that assume infall of primordial gas without galactic winds or radial outflows and a star formation rate proportional to (where is the surface gas density, is the total surface mass density, and is constant in time and space), the predicted C/O ratio depends mainly on the stellar yields and the initial mass function.
Based on chemical evolution models for the Galactic disk Carigi (2000) has studied the C and O gradients assuming different sets of stellar yields dependent on metallicity. This author has shown that the observed C/O vs. O/H relation –as well as the presence of negative C/O gradients in spiral galaxies– can be explained with the metallicity-dependent yields for C and O for massive stars with radiatively driven mass loss derived by Maeder (1992). In Figure 5 we have also plotted the prediction of selected models (those that reproduce the observed relation) obtained by Carigi (2000). It can be seen that the position of the Galactic objects is well reproduced by the models. However, as Garnett et al. (1999) have pointed out changes in the assumed star formation law through its dependence on the power of the gas surface density can change the curves, mainly shifting the curves in the C/O axis. Therefore, models for the solar vicinity do not necessarily reproduce correctly the chemical evolution of galaxies with different gas consumption timescales.
9.3 The / and / ratios and chemical evolution
Additional parameters that can be used to constrain models of galactic chemical evolution are and /; these values are obtained by assuming that the galaxies form with the primordial helium abundance and no heavy elements. The best objects to obtain this parameter are NGC 604 and NGC 5461 due to their high and abundances.
In Table 11 we present the helium, oxygen and heavy elements by mass (, , and ) for NGC 604 and NGC 5461. To derive the values we have added 0.08 dex to the gaseous values to take into account the fraction of heavy elements tied up in dust grains. To derive the heavy element content by mass of NGC 604 and NGC 5461 we made the following considerations: a) we added 0.08 dex and 0.10 dex to the and gaseous abundances respectively to take into account the fraction of these atoms tied up in dust grains (Esteban et al., 1998); b) we assumed that were representative of the total value and based on the solar abundances by Grevesse & Sauval (1998) and by Holweger (2001) we obtained that made up 69% of the total value,
Also in Table 11 we include the , and values obtained by Peimbert & Peimbert (2002) based on the line intensities by Esteban et al. (1999b) for M17, the galactic H II region with the best helium abundance determination. To derive the total values these authors assumed that , , and were representative of the value, and based on the solar abundances by Grevesse & Sauval (1998) and Holweger (2001) they found that these four elements amount to 79% of the total value.
We have assumed the primordial helium abundances by mass recently obtained by Peimbert, Peimbert, & Luridiana (2002) of (+Hc) = 0.2475 0.0025 for = 0 and (+Hc) = 0.23840.0025 for 0, that were obtained considering the collisional excitation of the Balmer lines (+Hc). In Table 12 we have included the values of / that we obtain assuming = 0 and 0.
From the data shown in Table 12 it is remarkable that we obtain fairly similar values of for = 0, which range from 4.6 to 6.6. These ratios for = 0 are larger than those obtained by chemical evolution models. For the galactic disk at the solar vicinity Chiappini, Matteucci, & Gratton (1997) find = 3.15, Copi (1997) derived values in the 2.4 to 3.4 range, and Carigi (2000) obtains ratios between 2.9 and 4.6, while closed box models for irregular galaxies by Carigi et al. (1995) and Carigi, Colín, & Peimbert (1999) give values in the 2.95 to 4.2 range. In Table 11 we can see that the ratios for 0 are in the 2.55 to 4 range in good agreement with the galactic chemical evolution models.
Similarly the models of chemical evolution of the Galaxy mentioned in the previous paragraph predict values in the 1.2–2 range. Again the values derived from observations under the assumption that 0 are in better agreement with the models than those derived under the assumption that (see Table 12).
10 Conclusions
Recombination lines of C II and O II are detected by the first time in some of the most interesting GEHRs of the Northern hemisphere. The comparison of ionic abundances obtained from these lines with those obtained from CELs suggests the presence of temperature variations inside these nebulae.
[Fe IV] optical lines are detected in NGC 2363 and NGC 5471, this is the clearest identification of these lines in H II regions.
The presence of values of 0 in GEHRs has important consequences in various fields of astrophysics, mainly because most of our knowledge about the chemical content of extragalactic objects comes from the spectra of GEHRs. The usual assumption of leads to underestimate the heavy element abundances derived from CELs. Moreover the usual assumption of leads to underestimate the primordial helium abundance (Peimbert, Peimbert, & Ruíz, 2000; Peimbert & Peimbert, 2002).
From the RLs of C and O we confirm the existence of C/H and O/H gradients in M101 derived from CELs.
We find a poor agreement between the predicted / and / values by galactic chemical evolution models and those derived from observations under the assumption that . Alternatively we find a good agreement between the predicted values and those derived from the RLs of C and O and the CELs of N, Ne, S, Ar, and Fe under the assumption that 0.
References
- Allan et al. (1988) Allan, R. J., Clegg, R. E. S., Dickinson, A. S., & Flower, D. R. 1988, MNRAS, 235, 1245
- Allende-Prieto, Lambert, & Asplund (2001) Allende-Prieto, C., Lambert, D. L., & Asplund, M. 2001, ApJ, 556, L63
- Baldwin et al. (2000) Baldwin, J. A., Verner, E. M., Verner, D. A., Ferland, G. J., Martin, P. G., Korista, K. T., & Rubin, R. H. 2000, ApJS, 129, 229
- Benjamin et al. (1999) Benjamin, R. A., Skillman, E. D., & Smits, D. P. 1999, ApJ, 514, 307
- Campbell (1988) Campbell, A. 1988, ApJ, 335, 644
- Carigi (2000) Carigi, L. 2000, Rev. Mexicana Astron. Astrofís., 36, 171
- Carigi et al. (1995) Carigi, L., Colín, P., Peimbert, M., & Sarmiento, A. 1995, ApJ, 445, 98
- Carigi, Colín, & Peimbert (1999) Carigi, L., Colín, P., & Peimbert, M. 1999, ApJ, 514, 787
- Chiappini, Matteucci, & Gratton (1997) Chiappini, C., Matteucci, F., & Gratton, R. 1997, ApJ, 477, 765
- Clegg et al. (1987) Clegg, R. E. S., Harrington, J. P., Barlow, M. J., & Walsh, J. R. 1987, ApJ, 314, 551
- Conti & Massey (1981) Conti, P. S., & Massey, P. 1981, ApJ, 249, 471
- Copi (1997) Copi, C. J. 1997, ApJ, 487, 704
- Davey, Storey, & Kisielius (2000) Davey, A. R., Storey, P. J., & Kisielius, R. 2000, Åps, 142, 85
- Díaz et al. (1987) Díaz, A. I., Terlevich, E., Pagel, B. E. J., Vílchez, J. M., & Edmunds, M. G. 1987, MNRAS, 226, 19
- D’Odorico & Rosa (1981) D’Odorico, S., & Rosa, M. 1981, ApJ248, 1015
- D’Odorico, Rosa, & Wampler (1983) D’Odorico, S., Rosa, M., & Wampler, E. J. 1983, Åps, 53, 97
- Drissen, Moffat, & Shara (1993) Drissen, L., Moffat, A. F. J., & Shara, M. M. 1993, AJ, 105, 1400
- Esteban (2002) Esteban, C. 2002, Rev. Mexicana Astron. Astrofís. Ser. Conf., 12, 56
- Esteban & Peimbert (1995) Esteban, C., & Peimbert, M. 1995, Åp, 300, 78
- Esteban et al. (1998) Esteban, C., Peimbert, M., Torres-Peimbert, S., & Escalante, V. 1998, MNRAS, 295, 401
- Esteban et al. (1999a) Esteban, C., Peimbert, M., Torres-Peimbert, S., García-Rojas, J., & Rodríguez, M. 1999a, ApJS, 120, 113
- Esteban et al. (1999b) Esteban, C., Peimbert, M., Torres-Peimbert, S., & García-Rojas, J. 1999b, Rev. Mexicana Astron. Astrofís., 35, 65
- Evans (1986) Evans, I. N. 1986, ApJ, 309, 544
- Froese Fischer & Rubin (1998) Froese Fischer, C., & Rubin, R. H. 1998, J. Phys. B: At. Mol. Opt. Phys., 31, 1657
- Garnett et al. (1999) Garnett, D. R., Shields, G. A., Peimbert, M., Torres-Peimbert, S., Skillman, E. D., Dufour, R. J., Terlevich, E., & Terlevich, R. J. 1999, ApJ, 513, 168
- Garnett et al. (1995) Garnett, D. R., Skillman, E. D., Dufour, R. J., Peimbert, M., Torres-Peimbert, S., Terlevich, R. J., Terlevich, E., & Shields, G. A. 1995, ApJ, 443, 64
- Garnett et al. (1997) Garnett, D. R., Skillman, E. D., Dufour, R. J., & Shields, G. A. 1997, ApJ, 481, 174
- Garstang (1978) Garstang, R. H. 1978, MNRAS, 118, 572
- Giannakopoulou-Creighton. Fich, & Wilson (1999) Giannakopoulou-Creighton, J., Fich, M., & Wilson, C. D. 1999, ApJ, 522, 238
- González-Delgado, Leitherer, & Heckman (1999) González-Delgado, R. M., Leitherer, C., & Heckman, T. M. 1999, ApJS, 125, 489
- González-Delgado et al. (1994) González-Delgado, R. M., Pérez, E., Tenorio-Tagle, G., Vílchez, J. M., Terlevich, E., Terlevich, R. J., Telles, E., Rodríguez-Espinosa, J. M., Mas-Hesse, M., García-Vargas, M. L., Díaz, A. I., Cepa, J., & Castañeda, H. 1994, ApJ, 437, 239
- Grandi (1976) Grandi, S. A. 1976, ApJ, 206, 658
- Grevesse & Sauval (1998) Grevesse, N., & Sauval, A. J. 1998, Space Sci. Rev., 85, 161
- Gruenwald & Viegas (1992) Gruenwald, R. B., & Viegas, S. M. 1992, ApJS, 78, 153
- Henry & Howard (1995) Henry, R. B. C., & Howard, J. W. 1995, ApJ, 438, 170
- Henry & Worthey (1999) Henry, R. B. C., & Worthey, G. 1999, PASP, 111, 919
- Holweger (2001) Holweger, H. 2001, in Solar and Galactic Composition, ed. R. F. Wimmer-Scweingruber, AIP Conference Series (Springer, New York), 598, 23
- Hummer & Storey (1987) Hummer, D. G., & Storey, P. J. 1987, MNRAS, 224, 801
- Izotov, Chaffee & Schaerer (2001) Izotov, Y. I., Chaffee, F. H., & Schaerer, D. 2001, Åp, 378, L45
- Izotov, Thuan, & Lipovetsky (1997) Izotov, Y. I., Thuan, T. X., & Lipovetsky, V. A. 1997, ApJS, 108, 1
- Kelson et al. (1996) Kelson, D. D., et al. 1996, ApJ, 463, 26
- Kennicutt & Garnett (1996) Kennicutt, R. C., & Garnett, D. R. 1996, ApJ, 456, 504
- Kingdon & Ferland (1995) Kingdon, J. B., & Ferland, G. J. 1995, ApJ, 442, 714
- Liu (2002) Liu, X.-W. 2002, Rev. Mexicana Astron. Astrofís. Ser. Conf., 12, 70
- Liu (2003) Liu, X.-W. 2003, in IAU Symp. No. 209, Planetary Nebulae: Their Evolution and Role in the Universe, eds. P. R. Wood and M. Dopita, ASP Conference Series, in press
- Liu & Danziger (1993) Liu, X.-W., & Danziger, I.J. 1993, MNRAS, 263, 256
- Liu et al. (2001) Liu, X.-W., Luo, S.-G., Barlow, M. J., Danziger, I. J., & Storey, P. J. 2001, MNRAS, 327, 141
- Liu et al. (1995) Liu, X.-W., Storey, P. J., Barlow, M. J., & Clegg, R. E. S. 1995, MNRAS, 272, 369
- Liu et al. (2000) Liu, X.-W., Storey, P. J., Barlow, M. J., Danziger, I. J., Cohen, M., & Bryce, M. 2000, MNRAS, 312, 585
- Luridiana et al. (2002) Luridiana, V., Esteban, C., Peimbert, M., & Peimbert, A. 2002, Rev. Mexicana Astron. Astrofís., 38, 97
- Luridiana, Peimbert, & Leitherer (1999) Luridiana, V., Peimbert, M., & Leitherer, C. 1999, ApJ, 527, 110
- Maeder (1992) Maeder, A. 1992, Åp, 264, 105
- Massey et al. (1988) Massey, P., Strobel, K., Barnes, J. V., & Anderson, E. 1988, ApJ, 328, 315
- McGaugh (1991) McGaugh, S. S. 1991, ApJ, 380, 140
- Oke (1990) Oke, J. B. 1990, AJ, 99, 1621
- Peimbert, Peimbert, & Luridiana (2002) Peimbert, A., Peimbert, M., & Luridiana, V. 2002, ApJ, 565, 668
- Peimbert (1967) Peimbert, M. 1967, ApJ, 150, 825
- Peimbert (1971) Peimbert, M. 1971, Bol. Obs. Tonantzintla y Tacubaya, 6, 29
- Peimbert & Costero (1969) Peimbert, M., & Costero, R. 1969, Bol. Obs. Tonantzintla y Tacubaya, 5, 3
- Peimbert & Peimbert (2002) Peimbert, M., & Peimbert, A. 2002, Rev. Mexicana Astron. Astrofís., in press (astro-ph/0204087)
- Peimbert, Peimbert, & Ruíz (2000) Peimbert, M., Peimbert, A., & Ruíz, M. T. 2000, ApJ, 541, 688
- Peimbert, Peña, & Torres-Peimbert (1986) Peimbert, M., Peña, M., & Torres-Peimbert, S. 1986, Åp, 158, 266
- Peimbert, Sarmiento, & Fierro (1991) Peimbert, M., Sarmiento, A., & Fierro, J. 1991, PASP, 103, 815
- Peimbert, Torres-Peimbert, & Luridiana (1995) Peimbert, M., Torres-Peimbert, S., & Luridiana, V. 1995, Rev. Mexicana Astron. Astrofís., 31, 131
- Pengelly (1963) Pengelly, R. M. 1963, PhD thesis, Univ. London
- Pequignot et al. (2002) Pequignot, D., Amara, M., Liu, X.-W., Barlow, M. J., Storey, P. J., Morisset, C., Torres-Peimbert, S., & Peimbert, M. 2002, Rev. Mexicana Astron. Astrofís. Ser. Conf., 12, 142
- Pequignot et al. (2003) Péquignot, D., Liu, X.-W., Barlow, M. J., Storey P. J., & Morisset, C. 2003, in IAU Symp. No. 209, Planetary Nebulae: Their Evolution and Role in the Universe, eds. P. R. Wood and M. Dopita, ASP Conference Series, in press
- Pequignot, Petitjean, & Boisson (1991) Pequignot, D., Petitjean, P., & Boisson, C. 1991, Åp, 251, 680
- Pérez (1997) Pérez, E. 1997, MNRAS, 290, 465
- Pilyugin (2001) Pilyugin, L. S. 2001, Åp, 373, 56
- Quinet (1996) Quinet, P. 1996, A&AS, 116, 573
- Rayo, Peimbert, & Torres-Peimbert (1982) Rayo, J. F., Peimbert, M., & Torres-Peimbert, S. 1982, ApJ, 255, 1
- Relaño, Peimbert, & Beckman (2002) Relaño, M., Peimbert, M., & Beckman, J. 2002, ApJ, 564, 704
- Robbins (1968) Robbins, R.R. 1968, ApJ, 151, 511
- Rodríguez (1996) Rodríguez, M. 1996, Åp, 313, L5
- Rodríguez (2002) Rodríguez, M. 2002, Åp, in press
- Rola & Stasińska (1994) Rola, C., & Stasińska, G. 1994, Åp, 282, 199
- Rubin et al. (1997) Rubin, R. H., Dufour, R. J., Ferland, G. J., Martin, P. G., O’Dell, C. R., Baldwin, J. A., Hester, J. J., Walter, D. K., & Wen, Z. 1997, ApJ, 474, L131
- Schaerer, Contini, & Pindao (1999) Schaerer, D., Contini, T., Pindao, M. 1999, Åp, 136, 35
- Seaton (1979) Seaton, M. J. 1979, MNRAS, 187, 73
- Shaw & Dufour (1995) Shaw, R. A., & Dufour, R. J. 1995, PASP, 107, 896
- Skillman (1985) Skillman, E. D. 1985, ApJ, 290, 449
- Smits (1996) Smits, D. P. 1996, MNRAS, 278, 683
- Stasińska (1990) Stasińska, G. 1990, Åps, 83, 501
- Stasińska (2000) Stasińska, G. 2000, Rev. Mexicana Astron. Astrofís. (Ser. de Conf.), 9, 158
- Stasińska & Schaerer (1999) Stasińska, G., & Schaerer, D. 1999, Åp, 351, 72
- Stone (1977) Stone, R. P. S. 1977, ApJ, 218, 767
- Storey (1994) Storey, P. J. 1994, Åp, 282, 999
- Storey & Hummer (1995) Storey, P. J., & Hummer, D. G. 1995, MNRAS, 272, 41
- Terlevich et al. (1996) Terlevich, E., Díaz, A. I., González-Delgado, R. M., Pérez, E., & García Vargas, M. L. 1996, MNRAS, 279, 1219
- Torres-Peimbert, & Peimbert (2003) Torres-Peimbert, S., & Peimbert, M. 2003,in IAU Symp. No. 209, Planetary Nebulae: Their Evolution and Role in the Universe, eds. P. R. Wood and M. Dopita, ASP Conference Series, in press (astro-ph/0203141)
- Torres-Peimbert et al. (1980) Torres-Peimbert, S., Peimbert, M., & Daltabuit, E. 1980, ApJ, 238, 133
- Torres-Peimbert, Peimbert, & Fierro (1989) Torres-Peimbert, S., Peimbert, M., & Fierro, J. 1989, ApJ, 345, 186
- Tsamis et al. (2003) Tsamis, Y. G., Barlow, M. J., Liu, X.-W., & Danziger, I. J. 2003, in IAU Symp. No. 209, Planetary Nebulae: Their Evolution and Role in the Universe, eds. P. R. Wood and M. Dopita, ASP Conference Series, in press
- Vila-Costas & Edmunds (1992) Vila-Costas, M. B., & Edmunds, M. G. 1992, MNRAS, 259, 121
- Zhang (1996) Zhang, H. L. 1996, A&AS, 119, 523
- Zhang & Pradhan (1997) Zhang, H. L., & Pradhan, A. K. 1997, A&AS, 126, 373
| Spectral | Spatial | Exposure | |||||||
|---|---|---|---|---|---|---|---|---|---|
| R.A. | Dec. | P.A. | Size | resol. | scale | time | |||
| Object | (hh mm ss) | (∘ ′ ′′) | (∘) | (arcsec2) | (Å) | (Å pix-1) | (arcsec pix-1) | (s) | |
| NGC 604 | 01 34 32.7 | +30 47 02 | 305 | 12.7 | 42305060 | 0.225 | 0.19 | 9000 | |
| 57207200 | 1.47 | 0.36 | 9000 | ||||||
| 300 | |||||||||
| NGC 5461 | 14 03 39.8 | +54 18 51 | 240 | 4.6 | 42305060 | 0.225 | 0.19 | 9600 | |
| 57207200 | 1.47 | 0.36 | 9600 | ||||||
| 1200 | |||||||||
| NGC 5471 | 14 04 27.7 | +54 23 43 | 310 | 4.4 | 42305060 | 0.225 | 0.19 | 12600 | |
| 57207200 | 1.47 | 0.36 | 12600 | ||||||
| NGC 2363 | 07 28 43.8 | +69 11 15 | 80 | 4.9 | 42305060 | 0.225 | 0.19 | 25200 | |
| 57207200 | 1.47 | 0.36 | 25200 | ||||||
| 300 |
| NGC 604 | NGC 5461 | NGC 5471 | NGC 2363 | ||||||||
|---|---|---|---|---|---|---|---|---|---|---|---|
| 0 | |||||||||||
| (Å) | Ion | Mult. | f() | (Å) | I() | (Å) | I() | (Å) | I() | (Å) | I() |
| 4267.16 | C II | (6) | 0.141 | 4267.17 | 0.200.03 | 4267.11 | 0.180.04 | 4267.24 | 0.05: | 4267.07 | 0.04: |
| 4275.55 | O II | (68) | 0.140 | 4275.96 | 0.03: | ||||||
| 4276.75 | O II | (67) | 0.139 | 4276.64 | 0.02: | ||||||
| 4276.83 | [Fe II] | (21F) | 0.139 | ||||||||
| 4287.40 | [Fe II] | (7F) | 0.138 | 4287.51 | 0.040.01 | 4287.02 | 0.110.03 | 4287.25 | 0.100.03 | 4287.61 | 0.03: |
| 4303.61 | O II | (66) | 0.135 | 4303.93 | 0.090.02 | 4303.93 | 0.07: | 4303.40 | 0.01: | ||
| 4303.82 | O II | (53) | 0.135 | ||||||||
| 4317.14 | O II | (2) | 0.132 | 4317.30 | 0.04: | 4317.25 | 0.01: | ||||
| 4340.47 | H I | H | 0.129 | 4340.49 | 46.60.9 | 4340.45 | 46.50.09 | 4340.46 | 47.60.09 | 4340.47 | 47.30.9 |
| 4345.56 | O II | (2) | 0.128 | 4345.63 | 0.05: | 4345.71 | 0.03: | ||||
| 4349.43 | O II | (2) | 0.127 | 4349.34 | 0.05: | ||||||
| 4359.34 | [Fe II] | (7F) | 0.125 | 4359.14 | 0.05: | ||||||
| 4363.21 | [O III] | (2F) | 0.124 | 4363.22 | 0.710.05 | 4363.21 | 1.270.13 | 4363.23 | 10.30.5 | 4363.20 | 15.90.5 |
| 4366.89 | O II | (2) | 0.123 | 4366.89 | 0.03: | ||||||
| 4368.25 | O I | (5) | 0.123 | 4368.04 | 0.05: | ||||||
| 4387.93 | He I | (51) | 0.118 | 4387.94 | 0.600.04 | 4387.98 | 0.560.05 | 4387.91 | 0.520.06 | 4387.92 | 0.520.04 |
| 4413.78 | [Fe II] | (7F) | 0.111 | 4413.72 | 0.06: | 4413.85 | 0.02: | ||||
| 4416.27 | [Fe III] | (6F) | 0.113 | 4417.16 | 0.02: | ||||||
| 4416.97 | O II | (5) | 0.113 | ||||||||
| 4437.55 | He I | (50) | 0.104 | 4437.40 | 0.070.02 | 4437.32 | 0.06: | 4437.52 | 0.080.03 | ||
| 4471.48 | He I | (14) | 0.095 | 4471.52 | 4.380.16 | 4471.51 | 4.440.16 | 4471.51 | 4.150.23 | 4471.50 | 4.070.16 |
| 4491.22 | O II | (86) | 0.092 | 4491.21 | 0.03: | ||||||
| 4562.60 | Mg I] | (1) | 0.074 | 4562.62 | 0.060.02 | 4562.40 | 0.070.03 | 4562.47 | 0.190.05 | 4562.57 | 0.090.02 |
| 4571.10 | Mg I] | (1) | 0.072 | 4571.07 | 0.070.02 | 4571.18 | 0.050.02 | 4571.01 | 0.160.05 | 4571.03 | 0.060.02 |
| 4590.97 | O II | (15) | 0.067 | 4591.02 | 0.03: | 4591.02 | 0.03: | ||||
| 4638.85 | O II | (1) | 0.053 | 4638.83 | 0.080.03 | 4638.67 | 0.070.03 | ||||
| 4641.81 | O II | (1) | 0.053 | 4641.60 | 0.060.02 | 4641.72 | 0.130.04 | 4641.75 | 0.04: | 4641.64 | 0.050.02 |
| 4649.14 | O II | (1) | 0.051 | 4649.13 | 0.050.01 | 4650.13 | 0.220.06 | 4649.88 | 0.080.02 | ||
| 4650.84 | O II | (1) | 0.050 | 4650.87 | 0.080.02 | ||||||
| 4658.10 | [Fe III] | (3F) | 0.048 | 4658.14 | 0.300.03 | 4658.06 | 0.630.08 | 4658.17 | 0.690.10 | 4658.13 | 0.150.03 |
| 4661.64 | O II | (1) | 0.048 | 4661.52 | 0.060.01 | 4661.46 | 0.05: | 4661.83 | 0.040.01 | ||
| 4676.23 | O II | (1) | 4676.09 | 0.01: | |||||||
| 4685.71 | He II | (1) | 0.043 | 4684.67 | 0.140.04 | 4685.83 | 0.570.09 | 4685.94 | 0.41 0.04 | ||
| 4701.62 | [Fe III] | (3F) | 0.037 | 4701.57 | 0.070.02 | 4701.50 | 0.160.04 | 4701.71 | 0.16: | 4701.53 | 0.03: |
| 4711.34 | [Ar IV] | (1F) | 0.036 | 4711.14 | 0.050.01 | 4711.46 | 1.030.08 | 4711.34 | 2.660.08 | ||
| 4713.14 | He I | (12) | 0.036 | 4713.13 | 0.370.03 | 4713.13 | 0.370.06 | 4713.24 | 0.370.07 | 4713.12 | 0.620.05 |
| 4740.20 | [Ar IV] | (1F) | 0.029 | 4740.72 | 0.02: | 4740.32 | 0.04: | 4740.31 | 0.800.10 | 4740.18 | 2.140.09 |
| 4754.69 | [Fe III] | (3F) | 0.026 | 4754.80 | 0.03: | 4754.58 | 0.080.03 | 4754.60 | 0.10: | 4755.03 | 0.03: |
| 4814.55 | [Fe II] | (20F) | 0.011 | 4815.22 | 0.050.01 | ||||||
| 4815.51 | S II | (9) | 0.011 | ||||||||
| 4861.33 | H I | H | 0.000 | 4861.31 | 1002 | 4861.33 | 1002 | 4861.33 | 1002 | 4861.30 | 1002 |
| 4867.95+8.16 | [Fe IV] | () | 0.002 | 4867.71 | 0.02: | ||||||
| 4881.00 | [Fe III] | (2F) | 0.005 | 4881.07 | 0.090.02 | 4880.95 | 0.210.05 | 4881.39 | 0.270.08 | 4881.07 | 0.04: |
| 4903.07 | [Fe IV] | () | 0.009 | 4902.97 | 0.04: | 4902.97 | 0.03: | ||||
| 4906.56 | [Fe IV] | () | 0.010 | 4906.59 | 0.04: | ||||||
| 4921.93 | He I | (48) | 0.014 | 4921.90 | 1.230.05 | 4921.94 | 1.230.09 | 4921.94 | 1.010.07 | 4921.90 | 1.060.06 |
| 4931.23 | [O III] | (1F) | 0.016 | 4931.17 | 0.02: | 4931.34 | 0.09: | 4931.19 | 0.090.03 | ||
| 4958.91 | [O III] | (1F) | 0.023 | 4958.88 | 78.01.7 | 4958.95 | 1122 | 4958.97 | 2094 | 4958.87 | 2445 |
| 4985.90 | [Fe III] | (2F) | 0.029 | 4985.84 | 0.270.04 | 4985.60 | 0.570.11 | 4985.79 | 0.410.08 | 4985.89 | 0.100.03 |
| 5006.84 | [O III] | (1F) | 0.034 | 5006.81 | 2504 | 5006.85 | 3527 | 5006.88 | 64010 | 5006.80 | 72914 |
| 5015.68 | He I | (4) | 0.036 | 5015.65 | 2.120.11 | 5015.65 | 1.980.14 | 5015.64 | 1.440.09 | 5015.64 | 1.650.12 |
| 5754.64 | [N II] | (3F) | 0.191 | 5753.86 | 0.280.04 | 5755.59 | 0.350.04 | 5753.29 | 0.140.02 | 5755.59 | 0.070.01 |
| 5875.67 | He I | (11) | 0.216 | 5874.81 | 13.10.4 | 5876.28 | 12.70.04 | 5874.48 | 11.80.5 | 5876.28 | 12.30.2 |
| 5957.67 | Si II | (4) | 0.229 | 5957.27 | 0.06: | 5957.73 | 0.060.02 | 5956.31 | 0.03: | 5957.79 | 0.05: |
| 5978.93 | Si II | (4) | 0.233 | 5977.69 | 0.06: | 5979.06 | 0.060.02 | 5977.19 | 0.03: | 5979.07 | 0.03: |
| 6046.44 | O I | (22) | 0.244 | 6043.95 | 0.08: | 6046.53 | 0.02: | ||||
| 6101.83 | [K IV ] | (1F) | 0.253 | 6099.18 | 0.06: | 6102.31 | 0.140.02 | ||||
| 6300.30 | [O I] | (1F) | 0.285 | 6299.16 | 0.270.02 | 6300.93 | 1.310.07 | 6298.57 | 2.640.18 | 6300.70 | 0.880.06 |
| 6312.10 | [S III] | (3F) | 0.287 | 6310.05 | 1.460.06 | 6312.82 | 1.370.07 | 6310.49 | 1.640.16 | 6312.47 | 1.290.06 |
| 6347.09 | Si II | (2) | 0.291 | 6345.56 | 0.06: | 6348.20 | 0.150.04 | 6345.20 | 0.08: | 6348.03 | 0.070.02 |
| 6363.78 | [O I] | (1F) | 0.294 | 6362.90 | 0.330.03 | 6364.43 | 0.390.06 | 6362.02 | 0.920.14 | 6364.17 | 0.310.05 |
| 6371.36 | Si II | (2) | 0.295 | 6370.60 | 0.090.02 | 6372.37 | 0.090.03 | 6370.82 | 0.03: | ||
| 6548.03 | [N II] | (1F) | 0.321 | 6547.34 | 9.840.40 | 6548.83 | 10.80.3 | 6546.32 | 1.890.19 | 6548.28 | 0.450.05 |
| 6562.82 | H I | H | 0.323 | 6561.80 | 2915 | 6563.48 | 2916 | 6561.17 | 2785 | 6563.03 | 2786 |
| 6583.41 | [N II] | (1F) | 0.326 | 6582.37 | 26.30.5 | 6584.13 | 31.20.6 | 6581.78 | 6.230.25 | 6583.67 | 1.510.09 |
| 6678.15 | He I | (46) | 0.338 | 6676.84 | 3.690.15 | 6678.76 | 3.600.18 | 6676.49 | 2.950.24 | 6678.27 | 2.880.09 |
| 6716.47 | [S II] | (2F) | 0.343 | 6715.16 | 14.40.4 | 6717.05 | 11.70.4 | 6714.84 | 8.950.27 | 6716.48 | 3.150.09 |
| 6730.85 | [S II] | (2F) | 0.345 | 6729.60 | 10.70.3 | 6731.46 | 10.00.3 | 6729.22 | 7.260.22 | 6730.85 | 2.710.08 |
| 6761.3 | [Fe IV] | () | 0.349 | 6760.87 | 0.01: | ||||||
| 7065.28 | He I | (10) | 0.383 | 7062.08 | 2.210.09 | 7066.66 | 3.320.17 | 7064.06 | 2.340.23 | 7063.90 | 3.500.10 |
| 7135.79 | [Ar III] | (1F) | 0.391 | 7131.69 | 10.00.3 | 7137.63 | 11.40.4 | 7134.78 | 6.230.19 | 7133.86 | 4.810.14 |
| (H) | 0.270.07 | 0.300.07 | 0.000.07 | 0.720.08 | |||||||
| (H) (10-14erg cm-2 s-1 arcsec-2) | 2.33 | 2.75 | 2.16 | 3.28 | |||||||
| (H) (Å) | 400 | 190 | 225 | 325 | |||||||
| Parameter | NGC 604 | NGC 5461 | NGC 5471 | NGC 2363 |
|---|---|---|---|---|
| ([S II]) (cm-3) | 100 | 30070 | 22070 | 36090 |
| ([Ar IV]) (cm-3) | 1150 | 1200550 | ||
| ([O III]) (K) | 8150150 | 8600250 | 14100300 | 15700300 |
| ([N II]) (K) | 8600450 | 8850400 | 12000900 | 165001400 |
| Ion | NGC 604 | NGC 5461 | NGC 5471 | NGC 2363 |
|---|---|---|---|---|
| O++/H+ | 8.270.05 | 8.340.06 | 7.910.04 | 7.850.04 |
| N+/H+ | 6.910.08 | 6.940.07 | 5.880.10 | 4.980.05 |
| S+/H+ | 5.900.08 | 5.820.08 | 5.370.09 | 4.650.05 |
| S++/H+ | 6.910.05 | 6.750.09 | 5.970.07 | 5.720.05 |
| Ar++/H+ | 6.200.05 | 6.200.05 | 5.450.03 | 5.250.04 |
| Ar3+/H+ | 4.170.12 | 4.13: | 4.830.06 | 5.150.05 |
| K3+/H+ | 3.86: | 4.140.10 | ||
| Fe++/H+ | 5.430.09 | 5.660.08 | 5.260.09 | 4.200.08 |
| Fe3+/H+ | 5.63: | 5.10: |
| Ion | NGC 604 | NGC 5461 | NGC 5471 | NGC 2363 |
|---|---|---|---|---|
| C++/H+ | 8.280.06 | 8.240.10 | 7.70: | 7.60: |
| O++/H+ | 8.470.10 | 8.630.12 | 8.12: | 8.190.11 |
| O++/H+ | C++/H+ | |||||
|---|---|---|---|---|---|---|
| Object | CELs | RLs | CELs | RLs | ||
| NGC 604 | 8.270.05 | 8.470.10 | 0.0270.018 | 8.280.06 | ||
| NGC 5461 | 8.340.06 | 8.630.12 | 0.0410.021 | 8.27aaGarnett et al. 1999 assuming = 3.1. /7.90bbGarnett et al. 1999 assuming = 5. | 8.240.10 | 0.003/0.030 |
| NGC 5471 | 7.910.04 | 8.12: | 0.074: | 7.30aaGarnett et al. 1999 assuming = 3.1. /7.28bbGarnett et al. 1999 assuming = 5. | 7.70: | 0.091:/0.095: |
| NGC 2363 | 7.850.04 | 8.190.11 | 0.1280.045 | 7.29ccPeimbert et al. 1986. | 7.60: | 0.102: |
| Galactic H II regions | ||||||
| M 42 - 1ddEsteban et al. 1998. | 8.39 | 8.52 | 0.018 | 8.05 | 8.36 | 0.025 |
| M 42 - 2ddEsteban et al. 1998. | 8.39 | 8.59 | 0.028 | 7.94 | 8.34 | 0.031 |
| M 8eeEsteban et al. 1999a. | 8.02 | 8.32 | 0.040 | 7.95 | 8.33 | 0.028 |
| M 17 - 3ffEsteban et al. 1999b. | 8.49 | 8.75 | 0.033 | 8.57 | ||
| M 17 - 14ffEsteban et al. 1999b. | 8.40 | 8.74 | 0.044 | 8.69 | ||
| Ratio/Parameter | NGC 604 | NGC 5461 | NGC 5471 | NGC 2363 |
|---|---|---|---|---|
| He+/H+ (4387 Å) | 96597 | 90490 | 87688 | 87588 |
| He+/H+ (4471 Å) | 86134 | 87535 | 85434 | 81132 |
| He+/H+ (4921 Å) | 90945 | 91346 | 79440 | 83233 |
| He+/H+ (5876 Å) | 91918 | 88427 | 91327 | 903bbThis value is not used to derive He+/H+, see text. |
| He+/H+ (6678 Å) | 91036 | 89636 | 81933 | 80332 |
| He+/H+ (7065 Å)ccThis line strongly depends on and (He ii), therefore it is not used to derive He+/H+, see text. | 904 | 880 | 824 | 814 |
| He+/H+ | 90518 | 88917 | 86217 | 81818 |
| He++/H+ | 1.10.4 | 4.90.7 | 3.60.4 | |
| He0/H+ | 3617 | 5218 | ||
| He/H | 94125 | 94225 | 86119 | 81620 |
| Adopted parameters | ||||
| 0.00 | 0.00 | 0.00 | 0.00 | |
| 1.0 | 5.0 | 0.2 | 1.5 | |
| (He ii) (cm-3) | 100 | 300 | 100 | 400 |
| (He) | 1.042 | 1.058 | 0.993 | 0.993 |
| Ratio/Parameter | NGC 604 | NGC 5461 | NGC 5471 | NGC 2363 |
|---|---|---|---|---|
| He+/H+ (4387 Å) | 95595 | 89189 | 85686 | 84885 |
| He+/H+ (4471 Å) | 84740 | 85734 | 83533 | 79232 |
| He+/H+ (4921 Å) | 89245 | 89045 | 76938 | 79632 |
| He+/H+ (5876 Å) | 88527 | 83825 | 86726 | 849bbThis value is not used to derive He+/H+, see text. |
| He+/H+ (6678 Å) | 87536 | 84934 | 77131 | 73729 |
| He+/H+ (7065 Å)ccThis line strongly depends on and (He ii), therefore it is not used to derive He+/H+, see text. | 894 | 845 | 833 | 799 |
| He+/H+ | 87817 | 85417 | 82516 | 77918 |
| He++/H+ | 1.10.4 | 4.90.7 | 3.60.4 | |
| He0/H+ | 3717 | 5017 | ||
| He/H | 91524 | 90524 | 82418 | 77720 |
| Adopted parameters | ||||
| 0.027 | 0.041 | 0.074 | 0.128 | |
| 1.5 | 6.5 | 1.2 | 3.5 | |
| (He ii) (cm-3) | 200 | 300 | 100 | 600 |
| (He) | 1.042 | 1.058 | 0.993 | 0.993 |
| Ion / | NGC 604 | NGC 5461 | NGC 5471 | NGC 2363 | ||||
|---|---|---|---|---|---|---|---|---|
| Element | = 0.00 | = 0.027 | = 0.00 | = 0.041 | = 0.00 | = 0.074 | = 0.00 | = 0.128 |
| C++ | 8.280.06 | 8.240.10 | 7.70: | 7.60: | ||||
| N+ | 6.910.08 | 7.010.08 | 6.940.07 | 7.100.07 | 5.880.10 | 6.050.10 | 4.980.05 | 5.150.05 |
| O+ | 8.090.11aaLine intensities taken from Díaz et al. 1987. | 8.210.11aaLine intensities taken from Díaz et al. 1987. | 8.170.08bbLine intensities taken from Torres-Peimbert et al. 1989. | 8.340.08bbLine intensities taken from Torres-Peimbert et al. 1989. | 7.400.10bbLine intensities taken from Torres-Peimbert et al. 1989. | 7.580.10bbLine intensities taken from Torres-Peimbert et al. 1989. | 6.470.10ccLine intensities taken from González-Delgado et al. 1994. | 6.650.10ccLine intensities taken from González-Delgado et al. 1994. |
| O++ | 8.270.05 | 8.470.10 | 8.340.06 | 8.630.12 | 7.910.04 | 8.12: | 7.850.04 | 8.190.11 |
| S+ | 5.900.08 | 6.000.08 | 5.820.08 | 5.980.08 | 5.370.09 | 5.540.09 | 4.650.05 | 4.820.05 |
| S++ | 6.910.05 | 7.130.05 | 6.750.09 | 7.080.09 | 5.970.07 | 6.200.07 | 5.720.05 | 6.080.05 |
| Ar++ | 6.200.05 | 6.370.05 | 6.200.05 | 6.440.05 | 5.450.03 | 5.630.03 | 5.250.04 | 5.540.04 |
| Ar3+ | 4.170.12 | 4.370.12 | 4.13: | 4.43: | 4.830.06 | 5.050.06 | 5.150.05 | 5.490.05 |
| K3+ | 3.86: | 4.05: | 4.140.10 | 4.450.10 | ||||
| Fe++ | 5.430.09 | 5.640.09 | 5.660.08 | 5.960.08 | 5.260.09 | 5.480.09 | 4.200.08 | 4.55 0.08 |
| Fe3+ | 5.63: | 5.84: | 5.10: | 5.44: | ||||
| C | 8.440.06 | 8.400.10 | 7.79: | 7.62: | ||||
| N | 7.310.14 | 7.460.14 | 7.330.12 | 7.570.12 | 6.510.15 | 6.700.15 | 6.380.12 | 6.700.12 |
| O | 8.490.06 | 8.660.10 | 8.560.07 | 8.810.12 | 8.030.05 | 8.23: | 7.870.04 | 8.200.11 |
| S | 7.130.05 | 7.340.05 | 6.960.09 | 7.270.09 | 6.300.07 | 6.520.07 | 6.470.05 | 6.820.05 |
| Ar | 6.260.05 | 6.430.05 | 6.230.05 | 6.470.05 | 5.560.03 | 5.740.03 | 5.500.05 | 5.820.05 |
| FeddDetermined from Fe++/H+ and assuming an (Fe++) | 6.220.09 | 6.430.09 | 6.450.08 | 6.750.08 | 6.140.09 | 6.360.09 | 5.810.08 | 6.160.08 |
| FeeeLower limits determined from Fe++/H+ + Fe3+/H+ | 5.78: | 5.99: | 5.16: | 5.49: | ||||
| O/H | C/H | C/O | |
|---|---|---|---|
| Galaxy | (dex kpc-1) | ||
| M101aaThis paper. | 0.038 | 0.040: | 0.002: |
| M101bbGarnett et al. 1999 (). | 0.030 | 0.055 | 0.025 |
| M101ccGarnett et al. 1999 (). | 0.030 | 0.075 | 0.040 |
| Milky WayddEsteban et al. 1999b, with revised 12 log (C/H) values for Orion (8.43), M8 (8.58), and M17 (8.66); see text. | 0.049 | 0.086 | 0.037 |
| Object | ||||||
|---|---|---|---|---|---|---|
| NGC 604 | 0.2705 | 0.2641 | 0.00427 | 0.00634 | 0.0108 | 0.0142 |
| NGC 5461 | 0.2706 | 0.2612 | 0.00501 | 0.00896 | 0.0115 | 0.0175 |
| M17aaPeimbert & Peimbert 2002. | 0.2766 | 0.2677 | 0.00440 | 0.00849 | 0.0135 | 0.0201 |
| / | / | |||
|---|---|---|---|---|
| Object | aa(+Hc)=0.2475, Peimbert et al. 2002 | bb(+Hc)=0.2384, Peimbert et al. 2002 | aa(+Hc)=0.2475, Peimbert et al. 2002 | bb(+Hc)=0.2384, Peimbert et al. 2002 |
| NGC 604 | ||||
| NGC 5461 | ||||
| M17ccPeimbert & Peimbert 2002. | ||||