Cluster Analysis in a Virtual Observatory 11institutetext: Palomar Observatory, Caltech, Pasadena, CA 91125, USA 22institutetext: Center for Advanced Computing Research, Caltech, Pasadena, CA 91125, USA 33institutetext: Jet Propulsion Laboratory, Pasadena, CA 91109, USA
Challenges for Cluster Analysis in a Virtual Observatory 111 To appear in: Statistical Challenges in Modern Astronomy III, eds. E. Feigelson and G.J. Babu, chapter 13, p. 125, New York: Springer Verlag (2002).
Abstract
here has been an unprecedented and continuing growth in the volume, quality, and complexity of astronomical data sets over the past few years, mainly through large digital sky surveys. Virtual Observatory (VO) concept represents a scientific and technological framework needed to cope with this data flood. We review some of the applied statistics and computing challenges posed by the analysis of large and complex data sets expected in the VO-based research. The challenges are driven both by the size and the complexity of the data sets (billions of data vectors in parameter spaces of tens or hundreds of dimensions), by the heterogeneity of the data and measurement errors, the selection effects and censored data, and by the intrinsic clustering properties (functional form, topology) of the data distribution in the parameter space of observed attributes. Examples of scientific questions one may wish to address include: objective determination of the numbers of object classes present in the data, and the membership probabilities for each source; searches for unusual, rare, or even new types of objects and phenomena; discovery of physically interesting multivariate correlations which may be present in some of the clusters; etc.
1 Towards a Virtual Observatory
Observational astronomy is undergoing a paradigm shift. This revolutionary change is driven by the enormous technological advances in telescopes and detectors (e.g., large digital arrays), the exponential increase in computing capabilities, and the fundamental changes in the observing strategies used to gather the data. In the past, the usual mode of observational astronomy was that of a single astronomer or small group performing observations of a small number of objects (from single objects and up to some hundreds of objects). This is now changing: large digital sky surveys over a range of wavelengths, from radio to x-rays, from space and ground are becoming the dominant source of observational data. Data-mining of the resulting digital sky archives is becoming a major venue of the observational astronomy. The optimal use of the large ground-based telescopes and space observatories is now as a follow-up of sources selected from large sky surveys. This trend is bound to continue, as the data volumes and data complexity increase. The very nature of the observational astronomy is thus changing rapidly. See, e.g., Szalay & Gray (2001) for a review.
The existing surveys already contain many Terabytes of data, from which catalogs of many millions, or even billions of objects are extracted. For each object, some tens or even hundred parameters are measured, most (but not all) with quantifiable errors. Forthcoming projects and sky surveys are expected to deliver data volumes measured in Petabytes. For example, a major new area for exploration will be in the time domain, with a number of ongoing or forthcoming surveys aiming to map large portions of the sky in a repeated fashion, down to very faint flux levels. These synoptic surveys will be generating Petabytes of data, and they will open a whole new field of searches for variable astronomical objects.
This richness of information is hard to translate into a derived knowledge and physical understanding. Questions abound: How do we explore datasets comprising hundreds of millions or billions of objects each with dozens of attributes? How do we objectively classify the detected sources to isolate subpopulations of astrophysical interest? How do we identify correlations and anomalies within the data sets? How do we use the data to constrain astrophysical interpretation, which often involve highly non-linear parametric functions derived from fields such as physical cosmology, stellar structure, or atomic physics? How do we match these complex data sets with equally complex numerical simulations, and how do we evaluate the performance of such models?
The key task is now to enable an efficient and complete scientific exploitation of these enormous data sets. The problems we face are inherently statistical in nature. Similar situations exist in many other fields of science and applied technology today. This poses many technical and conceptual challenges, but it may lead to a whole new methodology of doing science in the information-rich era.
In order to cope with this data flood, the astronomical community started a grassroots initiative, the National (and ultimately Global) Virtual Observatory (NVO). The NVO would federate numerous large digital sky archives, provide the information infrastructure and standards for ingestion of new data and surveys, and develop the computational and analysis tools with which to explore these vast data volumes. Recognising the urgent need, the National Academy of Science Astronomy and Astrophysics Survey Committee, in its new decadal survey Astronomy and Astrophysics in the New Millennium (McKee, Taylor, et al. 2001) recommends, as a first priority, the establishment of a National Virtual Observatory (NVO).
The NVO would provide new opportunities for scientific discovery that were unimaginable just a few years ago. Entirely new and unexpected scientific results of major significance will emerge from the combined use of the resulting datasets, science that would not be possible from such sets used singly. In the words of a “white paper” 222 Available at http://www.arXiv.org/abs/astro-ph/0108115, and also published in Brunner, Djorgovski, & Szalay (2001), p. 353. prepared by an interim steering group the NVO will serve as an engine of discovery for astronomy.
Implementation of the NVO involves significant technical challenges on many fronts, and in particular the data analysis. Whereas some of the NVO science would be done in the image (pixels) domain, and some in the interaction between the image and catalog domains, it is anticipated that much of the science (at least initially) will be done purely in the catalog domain of individual or federated sky surveys. A typical data set may be a catalog of sources with measured attributes each, i.e., a set of data vectors in a -dimensional parameter space.
Dealing with the analysis of such data sets is obviously an inherently multivariate statistical problem. Complications abound: parameter correlations will exist; observational limits (selection effects) will generally have a complex geometry; for some of the sources some of the measured parameters may be only upper or lower limits; the measurement errors may vary widely; some of the parameters will be continuous, and some discrete, or even without a well-defined metric; etc. In other words, analysis of the NVO data sets will present many challenging problems for multivariate statistics, and the resulting astronomical conclusions will be strongly affected by the correct application of statistical tools.
We review some important statistical challenges raised by the NVO. These include the classification and extraction of desired subpopulations, understanding the relationships between observed properties within these subpopulations, and linking the astronomical data to astrophysical models. This may require a generation of new methods in data mining, multivariate clustering and analysis, nonparametric and semiparametric estimation and model and hypothesis testing.
2 Clustering analysis challenges in a VO
The exploration of observable parameter spaces, created by combining of large sky surveys over a range of wavelengths, will be one of the chief scientific purposes of a VO. This includes an exciting possibility of discovering some previously unknown types of astronomical objects or phenomena (see Djorgovski et al. 2001a, 2001b, 2001c for reviews).
A complete observable parameter space axes include quantities such as the object coordinates, velocities or redshifts, sometimes proper motions, fluxes at a range of wavelength (i.e., spectra; imaging in a set of bandpasses can be considered a form of a very low resolution spectroscopy), surface brightness and image morphological parameters for resolved sources, variability (or, more broadly, power spectra) over a range of time scales, etc. Any given sky survey samples only a small portion of this grand observable parameter space, and is subject to its own selection and measurement limits, e.g., limiting fluxes, surface brightness, angular resolution, spectroscopic resolution, sampling and baseline for variability if multiple epoch observations are obtained, etc.
A major exploration technique envisioned for the NVO will be unsupervised clustering of data vectors in some parameter space of observed properties of detected sources. Aside from the computational challenges with large numbers of data vectors and a large dimensionality, this poses some highly non-trivial statistical problems. The problems are driven not just by the of the data sets, but mainly (in the statistical context) by the heterogeneity and intrinsic complexity of the data.
A typical VO data set may consist of data vectors in dimensions. These are measured source attributes, including positions, fluxes in different bandpasses, morphology quantified through different moments of light distribution and other suitably constructed parameters, etc. Some of the parameters would be primary measurements, and others may be derived attributes, such as the star-galaxy classification, some may be “flags” rather than numbers, some would have error-bars associated with them, and some would not, and the error-bars may be functions of some of the parameters, e.g., fluxes. Some measurements would be present only as upper or lower limits. Some would be affected by “glitches” due to instrumental problems, and if a data set consists of a merger of two or more surveys, e.g., cross-matched optical, infrared, and radio (and this would be a common scenario within a VO), then some sources would be misidentified, and thus represent erroneous combinations of subsets of data dimensions. Surveys would be also affected by selection effects operating explicitly on some parameters (e.g., coordinate ranges, flux limits, etc.), but also mapping onto some other data dimensions through correlations of these properties; some selection effects may be unknown.
Physically, the data set may consist of a number of distinct classes of objects, such as stars (including a range of spectral types), galaxies (including a range of Hubble types or morphologies), quasars, etc. Within each object class or subclass, some of the physical properties may be correlated, and some of these correlations may be already known and some as yet unknown, and their discovery would be an important scientific result by itself. Some of the correlations may be spurious (e.g., driven by sample selection effects), or simply uninteresting (e.g., objects brighter in one optical bandpass will tend to be brighter in another optical bandpass). Correlations of independently measured physical parameters represent a reduction of the statistical dimensionality in a multidimensional data parameter space, and their discovery may be an integral part of the clustering analysis.
Typical scientific questions posed may be:
-
•
How many statistically distinct classes of objects are in this data set, and which objects are to be assigned to which class, along with association probabilities?
-
•
Are there any previously unknown classes of objects, i.e., statistically significant “clouds” in the parameter space distinct from the “common” types of objects (e.g., normal stars or galaxies)? An application may be separating quasars from otherwise morphologically indistinguishable normal stars.
-
•
Are there rare outliers, i.e., individual objects with a low probability of belonging to any one of the dominant classes? Examples may include known, bur relatively rare types of objects such as high-redshift quasars, brown dwarfs, etc., but also previously unknown types of objects; finding any such would be a significant discovery.
-
•
Are there interesting (in general, multivariate) correlations among the properties of objects in any given class, and what are the optimal analytical expressions of such correlations? An example may be the “Fundamental Plane” of elliptical galaxies, a set of bivariate correlations obeyed by this Hubble type, but no other types of galaxies (see, e.g., Djorgovski 1992, 1993, and Djorgovski et al. 1995, for reviews).
The complications include the following:
-
1.
Construction of these complex data sets, especially if multiple sky surveys, catalogs, or archives are being federated (an essential VO activity) will inevitably be imperfect, posing quality control problems which must be discovered and solved first, before the scientific exploration starts. Sources may be mismatched, there will be some gross errors or instrumental glitches within the data, subtle systematic calibration errors may affect pieces of the large data sets, etc.
-
2.
The object classes form multivariate “clouds” in the parameter space, but these clouds in general need not be Gaussian: some may have a power-law or exponential tails in some or all of the dimensions, and some may have sharp cutoffs, etc.
-
3.
The clouds may be well separated in some of the dimensions, but not in others. How can we objectively decide which dimensions are irrelevant, and which ones are useful?
-
4.
The topology of clustering may not be simple: there may be clusters within clusters, holes in the data distribution (negative clusters?), multiply-connected clusters, etc.
-
5.
All of this has to take into the account the heterogeneity of measurements, censored data, incompleteness, etc.
The majority of the technical and methodological challenges in this quest derive from the expected heterogeneity and intrinsic complexity of the data, including treatment of upper an lower limits, missing data, selection effects and data censoring, etc. These issues affect the proper statistical description of the data, which then must be reflected in the clustering algorithms.
Related to this are the problems arising from the data modeling. The commonly used mixture-modeling assumption of clusters represented as multivariate Gaussian clouds is rarely a good descriptor of the reality. Clusters may have non-Gaussian shapes, e.g., exponential or power-law tails, asymmetries, sharp cutoffs, etc. This becomes a critical issue in evaluating the membership probabilities in partly overlapping clusters, or in a search for outliers (anomalous events) in the tails of the distributions. In general, the proper functional forms for the modeling of clusters are not known a priori, and must be discovered from the data. Applications of non-parametric techniques may be essential here. A related, very interesting problem is posed by the topology of clustering, with a possibility of multiply-connected clusters or gaps in the data (i.e., negative clusters embedded within the positive ones), hierarchical or multi-scale clustering (i.e., clusters embedded within the clusters) etc.
The clusters may be well separated in some of the dimensions, but not in others. How can we objectively decide which dimensions are irrelevant, and which ones are useful? An automated and objective rejection of the “useless” dimensions, perhaps through some statistically defined entropy criterion, could greatly simplify and speed up the clustering analysis.
Once the data are partitioned into distinct clusters, their analysis and interpretation starts. One question is, are there interesting (in general, multivariate) correlations among the properties of objects in any given cluster? Such correlations may reflect interesting new astrophysics (e.g.,, the stellar main sequence, the Tully-Fisher and Fundamental Plane correlations for galaxies, etc.), but at the same time complicate the statistical interpretation of the clustering. They would be in general restricted to a subset of the dimensions, and not present in the others. How do we identify all of the interesting correlations, and discriminate against the “uninteresting” observables?
Here we describe some of our experiments to date, and outline some possible avenues for future exploration.
3 Examples and some possible approaches
Separation of the data into different types of objects, be it known or unknown in nature, can be approached as a problem in automated classification or clustering analysis. This is a part of a more general and rapidly growing field of Data Mining (DM) and Knowledge Discovery in Databases (KDD). We see here great opportunities for collaborations between astronomers and computer scientists and statisticians. For an overview of some of the issues and methods, see, e.g., Fayyad et al. (1996b) .
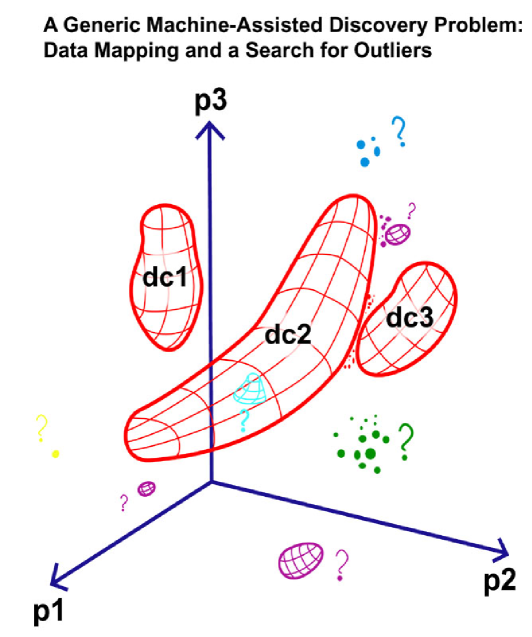
If applied in the catalog domain, the data can be viewed as a set of points or vectors in an -dimensional parameter space, where can be in the range of many millions or even billions, and in the range of a few tens to hundreds. The data may be clustered in statistically distinct classes, which could be modeled, e.g., as multivariate Gaussian clouds, and which hopefully correspond to physically distinct classes of objects (e.g., stars, galaxies, quasars, etc.). This is schematically illustrated in Figure 1.
If the number of object classes is known (or declared) a priori, and training data set of representative objects is available, the problem reduces to supervised classification, where tools such as Artificial Neural Nets or Decision Trees can be used. This is now commonly done for star-galaxy separation in sky surveys (e.g., Odewahn et al. 1992, or Weir et al. 1995). Searches for known types of objects with predictable signatures in the parameter space (e.g., high- quasars) can be also cast in this way.
However, a more interesting and less biased approach is where the number of classes is not known, and it has to be derived from the data themselves. The problem of unsupervised classification is to determine this number in some objective and statistically sound manner, and then to associate class membership probabilities for all objects. Majority of objects may fall into a small number of classes, e.g., normal stars or galaxies. What is of special interest are objects which belong to much less populated clusters, or even individual outliers with low membership probabilities for any major class. Some initial experiments with unsupervised clustering algorithms in the astronomical context include, e.g., Goebel et al. (1989), Weir et al. (1995), de Carvalho et al. (1995), and Yoo et al. (1996), but a full-scale application to major digital sky surveys yet remains to be done. Intriguing applications which addressed the issue of how many statistically distinct classes of GRBs are there (Mukherjee et al. 1998, Rogier et al. 2000, Hakkila et al. 2000).
In many situations, scientifically informed input is needed in designing the clustering experiments. Some observed parameters may have a highly significant, large dynamical range, dominate the sample variance, and naturally invite division into clusters along the corresponding parameter axes; yet they may be completely irrelevant or uninteresting scientifically. For example, if one wishes to classify sources of the basic of their broad-band spectral energy distributions (or to search for objects with unusual spectra), the mean flux itself is not important, as it mainly reflects the distance; coordinates on the sky may be unimportant (unless one specifically looks for a spatial clustering); etc. Thus, a clustering algorithm may divide the data set along one or more of such axes, and completely miss the really scientifically interesting partitions, e.g., according to the colors of objects.
One method we have been experimenting with (applied on the various data sets derived from DPOSS) is the Expectation Maximisation (EM) technique, with the Monte Carlo Cross Validation (MCCV) as the way of determining the maximum likelihood number of the clusters.
This may be a computationally very expensive problem. For the simple -means algorithm, the computing cost scales as , where is the number of clusters chosen a priori, is the number of data vectors (detected objects), is the number of iterations, and is the number of data dimensions (measured parameters per object). For the more powerful Expectation Maximisation technique, the cost scales as , and again one must decide a priori on the value of . If this number has to be determined intrinsically from the data, e.g., with the Monte Carlo Cross Validation method, the cost scales as where is the number of Monte Carlo trials/partitions, and is the maximum number of clusters tried. Even with the typical numbers for the existing large digital sky surveys (, ) this is already reaching in the realm of Terascale computing, especially in the context of an interactive and iterative application of these analysis tools. Development of faster and smarter algorithms is clearly a priority.
One technique which can simplify the problem is the multi-resolution clustering. In this regime, expensive parameters to estimate, such as the number of classes and the initial broad clustering are quickly estimated using traditional techniques, and then one could proceed to refine the model locally and globally by iterating until some objective statistical (e.g., Bayesian) criterion is satisfied.
One can also use intelligent sampling methods where one forms “prototypes”of the case vectors and thus reduces the number of cases to process. Prototypes can be determined from simple algorithms to get a rough estimate, and then refined using more sophisticated techniques. A clustering algorithm can operate in prototype space. The clusters found can later refined by locally replacing each prototype by its constituent population and reanalyzing the cluster.
Techniques for dimensionality reduction, including principal component analysis and others can be used as preprocessing techniques to automatically derive the dimensions that contain most of the relevant information.
4 Concluding comments
Given this computational and statistical complexity, blind applications of the commonly used (commercial or home-brewed) clustering algorithms could produce some seriously misleading or simply wrong results. The clustering methodology must be robust enough to cope with these problems, and the outcome of the analysis must have a solid statistical foundation.
In our experience, design and application of clustering algorithms must involve close, working collaboration between astronomers and computer scientists and statisticians. There are too many unspoken assumptions, historical background knowledge specific to the given discipline, and opaque jargon; constant communication and interchange of ideas are essential.
The entire issue of discovery and interpretation of multivariate correlations in these massive data sets has not really been addressed so far. Such correlations may contain essential clues about the physics and the origins of various types of astronomical objects.
Effective and powerful data visualization, applied in the parameter space itself, is another essential part of the interactive clustering analysis. Good visualisation tools are also critical for the interpretation of results, especially in an iterative environment. While clustering algorithms can assist in the partitioning of the data space, and can draw the attention to anomalous objects, ultimately a scientist guides the experiment and draws the conclusions. It is very hard for a human mind to really visualise clustering or correlations in more than a few dimensions, and yet both interesting clusters and multivariate correlations with statistical dimensionality or even higher are likely to exits, and possibly lead to some crucial new astrophysical insights. Perhaps the right approach would be to have a good visualisation embedded as a part of an interactive and iterative clustering analysis.
Another key issue is interoperability and reusability of algorithms and models in a wide variety of problems posed by a rich data environment such as federated digital sky surveys in a VO. Implementation of clustering analysis algorithms must be done with this in mind.
Finally, scientific verification and evaluation, testing, and follow-up on any of the newly discovered classes of objects, physical clusters discovered by these methods, and other astrophysical analysis of the results is essential in order to demonstrate the actual usefulness of these techniques for a VO or other applications. Clustering analysis can be seen as a prelude to the more traditional type of astronomical studies, as a way of selecting of interesting objects of samples, and hopefully it can lead to advances in statistics and applied computer science as well.
5 Acknowledgments
We wish to thank numerous collaborators, including R. Gal, S. Odewahn, R. de Carvalho, T. Prince, J. Jacob, D. Curkendall, and many others. This work was supported in part by the NASA grant NAG5-9482, and by private foundations. Finally, we thank the organizers for a pleasant and productive meeting.
6 References
Boller, T., Meurs, E., & Adorf, H.-M. 1992, A&A, 259, 101
Brunner, R.J., Djorgovski, S.G., & Szalay, A.S. (editors) 2001a, Virtual Observatories of the Future, ASPCS vol. 221.
Brunner, R., Djorgovski, S.G., Gal, R.R., Mahabal, A., & Odewahn, S.C. 2001b, in: Virtual Observatories of the Future, eds. R. Brunner, S.G. Djorgovski & A. Szalay, ASPCS, 225, 64
Burl, M., Asker, L., Smyth, P., Fayyad, U., Perona, P., Crumpler, L., & Aubelle, J. 1998, Mach. Learning, 30, 165
de Carvalho, R., Djorgovski, S., Weir, N., Fayyad, U., Cherkauer, K., Roden, J., & Gray, A. 1995, in Astronomical Data Analysis Software and Systems IV, eds. R. Shaw et al. , ASPCS, 77, 272
Djorgovski, S.G. 1992, in: Cosmology and Large-Scale Structure in the Universe, ed. R. de Carvalho, ASPCS, 24, 19
Djorgovski, S.G. 1993, in: The Globular Cluster – Galaxy Connection, eds. G. Smith & J. Brodie, ASPCS, 48, 496
Djorgovski, S.G., Pahre, M.A., & de Carvalho, R.R. 1995, in: Fresh Views of Elliptical Galaxies, eds. A. Buzzoni et al. , ASPCS, 86, 129
Djorgovski, S.G., Mahabal, A., Brunner, R., Gal, R.R., Castro, S., de Carvalho, R.R., & Odewahn, S.C. 2001a, in: Virtual Observatories of the Future, eds. R. Brunner, S.G. Djorgovski & A. Szalay, ASPCS, 225, 52 [astro-ph/0012453]
Djorgovski, S.G., Brunner, R., Mahabal, A., Odewahn, S.C., de Carvalho, R.R., Gal, R.R., Stolorz, P., Granat, R., Curkendall, D., Jacob, J., & Castro, S. 2001b, in: Mining the Sky, eds. A.J. Banday et al. , ESO Astrophysics Symposia, Berlin: Springer Verlag, p. 305 [astro-ph/0012489]
Djorgovski, S.G., Mahabal, A., Brunner, R., Williams, R., Granat, R., Curkendall, D., Jacob, J., & Stolorz, P. 2001c, in: Astronomical Data Analysis, eds. J.-L. Starck & F. Murtagh, Proc. SPIE 4477, in press [astro-ph/0108346]
Fayyad, U., Djorgovski, S.G., & Weir, W.N. 1996a, in: Advances in Knowledge Discovery and Data Mining, eds. U. Fayyad et al. , Boston: AAAI/MIT Press, p. 471
Fayyad, U., Piatetsky-Shapiro, G., Smyth, P., & Uthurusamy, R. (eds.) 1996b, Advances in Knowledge Discovery and Data Mining, Boston: AAAI/MIT Press
Goebel, J., Volk, K., Walker, H., Gerbault, F., Cheeseman, P., Self, M., Stutz, J., & Taylor, W. 1989, A&A, 222, L5
Hakkila, J., Haglin, D., Pendleton, G., Mallozzi, R., Meegan, C., & Rogier, R. 2000, ApJ, 538, 165
Mukherjee, S., Feigelson, E., Babu, J., Murtagh, F., Fraley, C., & Raftery, A. 1998, ApJ, 508, 314
Odewahn, S.C., Stockwell, E., Pennington, R., Humphreys, R., & Zumach, W. 1992, AJ, 103, 318
Paczyński, B. 2000, PASP, 112, 1281
Rogier, R., Hakkila, J., Haglin, D., Pendleton, G., & Mallozzi, R. 2000, in: Gamma-Ray Bursts, 5th Hunsville Symp., eds. R. Kippen et al. , AIP Conf. Proc. 526, 38
Szalay, A., & Gray, J. 2001, Science, 293, 2037
Weir, N., Fayyad, U., & Djorgovski, S. 1995, AJ, 109, 2401
Yoo, J., Gray, A., Roden, J., Fayyad, U., de Carvalho, R., & Djorgovski, S. 1996, in: Astronomical Data Analysis Software and Systems V, eds. G. Jacoby & J. Barnes, ASPCS, 101, 41
Note added in the preprint version of the paper: Interested reader may find a lot of information about the VO concept, and some useful links at the NVO Science Definition Team website, http://www.nvosdt.org