Cepheid, Tully-Fisher and SNIa Distances.
Abstract
We first discuss why the uncomfortable fine-tuning of the parameters of the -CDM cosmological model provides continuing, strong motivation to investigate Hubble’s Constant. Then we review evidence from the HST Key Project that there is a significant scale error between raw Cepheid and Tully-Fisher distances. An analysis of mainly HST Distance Scale Key Project data shows a correlation between host galaxy metallicity and the rms scatter around the Cepheid P-L relation, which may support a recent suggestion that the P-L metallicity dependence is stronger than expected. If Cepheids do have a significant metallicity dependence then the Tully-Fisher scale error increases and the distances of the Virgo and Fornax clusters extend to more than 20Mpc, decreasing the value of H0. Finally, if the Cepheids have a metallicity dependence then so do Type Ia Supernovae since the metallicity corrected Cepheid distances to eight galaxies with SNIa would then suggest that the SNIa peak luminosity is fainter in metal poor galaxies, with important implications for SNIa estimates of q0 as well as H0.
Dept. of Physics, Univ. of Durham, South Road, Durham, England
Dept. of Astrophysics, Univ. of Oxford, Keble Road, Oxford, England
Dept. of Physics, Drexel Univ., Disque Hall 816, Philadelphia, USA
Div. of Physics and Astronomy, Univ. of Herts., Hatfield, England
1. Status of the -CDM Cosmology
One major motivation for studying Hubble’s Constant is the complicated nature of the current standard model in cosmology, -CDM. In this model, to order of magnitude, and this seems unnatural. The coincidence between the CDM and Baryon densities worried some authors (Peebles 1984, Shanks 1985) when CDM was first postulated. The coincidence between and the others worried many more (eg Dolgov, 1983, Peebles and Ratra, 1988 and Wetterich, 1988). These fine-tuning problems of the standard model are compounded by the fact that the inflation model on which the standard model sits, was partly based on a fine-tuning argument, the flatness-problem; to begin by eliminating one fine tuning problem only to end up with several gives the appearance of circular reasoning!
Shanks (1985, 1991, 1999, 2001) noted that a simpler model immediately became available if H0 actually lay below 50 kms-1 Mpc-1. An inflationary model with =1 is then better placed to escape the baryon nucleosynthesis constraint. Simultaneously, the low value of H0 means that the X-ray gas in the Coma cluster increases towards the Coma virial mass and the lifetime of an Einstein-de Sitter Universe extends to become compatible with the ages of the oldest stars. Now this model does predict a first acoustic peak in the CMB anisotropy at around l330 which disagrees with the position of the first peak at l=22010 found by the Boomerang experiment (Netterfield et al, 2002). However, the above fine-tuning problems of the -CDM model plus the historical tendency for later data to overturn early confirmations of previous ‘concordance’ models such as the isocurvature model in the early 1980’s and the SCDM model in the early 1990’s suggests that it may be best, (a) to wait for MAP to confirm the Boomerang results before abandoning other models and (b) to continue to study Hubble’s Constant.
2. A New Era for Determining H0
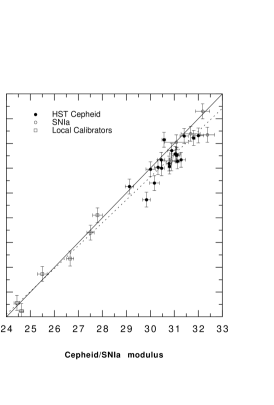
Some 25 galaxies have had Cepheids detected by HST. Seventeen of these were observed by the HST Distance Scale Key Project (Freedman et al, 1994). Seven were observed in galaxies with SNIa by Sandage and collaborators (eg Sandage et al, 1996) and M96 in the Leo I Group was observed by Tanvir et al (1995). In Fig. 1 we use these data to update the comparison of I-band TF distances of Pierce & Tully (1992) with HST Cepheid distances. As can be seen, the result implies that TF distance moduli at Virgo underestimated by 225%. This reduces Tully-Fisher estimates of H0 from 85 to 65kms-1Mpc-1 (Giovanelli et al, 1997, Shanks 1997, Shanks, 1999, Sakai et al, 1999). The correlation of Cepheid residuals with line-width suggests TF distances may be Malmquist biased - possibly implying a bigger TF scale error at larger distances. This clear problem for TF distances, which previously has been the ‘gold standard’ of secondary distance indicators, warns that errors in the extragalactic distance scale may still be seriously underestimated!
3. NGC7790 Cepheid Metallicity Dependence?
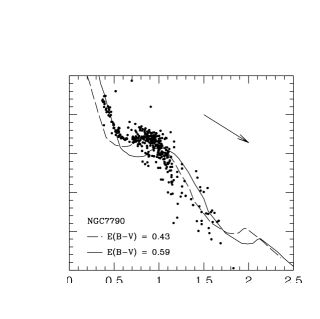
New JKT 1.0m + CTIO 0.9m + UKIRT UBVK photometry of Cepheid Open Clusters by Hoyle et al. (2001) has uncovered an anomaly in the NGC7790 UBV 2-colour diagram, in that the F stars in the cluster show a strong UV excess with respect to zero-age main sequence stars (see Fig. 2). The result is confirmed by independent photometric data (Fry, 1997, Fry and Carney, 1997) as shown in Fig. 7b of Hoyle et al (2001). If the UV excess is caused by metallicity then NGC7790 would have [Fe/H] -1.5 ! To keep the Galactic Cepheid P-L relation as tight as previously observed implies that Cepheids may have a stronger metallicity dependence, , than previously expected, in the sense that low metallicity Cepheids are intrinsically fainter. Currently we are obtaining metallicities for the F stars in NGC7790 in order to distinguish this interpretation from other explanations such as non-standard dust reddening towards this open cluster.

4. HST Cepheid Metallicity Dependence
Meanwhile, Allen & Shanks (2001) have found an correlation between dispersion around the Cepheid P-L relation and galaxy metallicity for HST Cepheid galaxies (see Fig. 3). This again suggests that the dependence of the Cepheid P-L relation on metallicity may be more complex than previously expected.

Allen & Shanks (2001) also obtain Cepheid distances via truncated maximum likelihood P-L fits to account for magnitude incompleteness caused by the above, non-negligible, dispersion in the HST P-L relations. They found that Cepheid galaxy distances at the limit of HST reach are too low. The higher than expected P-L dispersion for distant, metal-rich galaxies accentuates this effect. The conclusion is that current HST Cepheid distance moduli may be underestimated by more than 0.5 mag at the redshift of Virgo and Fornax due to both metallicity and statistical incompleteness bias. The TF distances discussed above are then underestimates by approximately 1 magnitude.
Eight HST Cepheid galaxies also have Type Ia distances. Correcting the Cepheid scale for metallicity and incompleteness bias as above and then using these distances to derive peak luminosities using the SNIa data from Gibson et al (2000), implies a strong correlation between Type Ia peak luminosity and metallicity. Such a scatter in SNIa luminosities could easily be disguised by magnitude selection effects at moderate redshifts. At higher redshift the correlation is in the right direction to explain away the need for a cosmological constant in the Supernova Hubble Diagram results, since galaxies at high redshift might be expected to have lower metallicity. Thus the conclusion is that if Cepheids have a strong metallicity dependence then so have SNIa and therefore SNIa estimates of q0 and H0 may require significant corrections for metallicity.
5. Conclusions - Implications for H0 and SNIa Cosmology
Our conclusions are as follows:-
-
•
Key Project HST Cepheid distances imply Tully-Fisher distances at Virgo/Fornax are underestimated by %, reducing H0 from 85 to 65kms-1Mpc-1.
-
•
TF distances may be Malmquist biased, suggesting there may be a bigger TF scale error at larger distances.
-
•
If the UV excess of F stars in open cluster NGC7790 is caused by low metallicity then Cepheids have a strong metallicity dependence, .
-
•
Current HST Cepheid distances may be significantly underestimated at Virgo/Fornax redshifts due to metallicity and magnitude incompleteness bias, implying that values of H50kms-1Mpc-1 may still not be ruled out.
-
•
If Cepheids have a strong metallicity dependence then so have SNIa . Thus significant metallicity corrections may need to be applied to the Type Ia Hubble Diagram before reliable estimates of q0 or H0 can be made.
References
Allen, P.D. & Shanks, T. 2001, MNRAS, submitted, astro-ph/0102450
Dolgov, A.D., 1983, In ‘The Very Early Universe’, Eds. Gibbons, G.W., Hawking, S., & Siklos, S.T.C. CUP, pp. 449-458
Freedman, W. L. et al., 1994, ApJ, 427, 628.
Fry, A.M., 1997, PhD thesis, Univ. of North Carolina.
Fry, A.M. & Carney, B.W., 1997, AJ, 113, 1073.
Gibson, B. K. et al, 1999, ApJ, 512, 48.
Giovanelli, R., Haynes, M.P., da Costa, L.N., Freudling, W., Salzer, J.J., Wegner, G., 1997, ApJ, 477, L1.
Hoyle, F., Shanks, T. & Tanvir, N.R., 2001 MNRAS submitted, astro-ph/0002521.
Netterfield, B. et al., 2002, ApJ, 501, 604.
Peebles, P.J.E., 1984, ApJ, 284, 439.
Peebles, P.J.E. & Ratra, B. 1988, ApJ, 325, L17.
Pierce, M.J. and Tully, R.B., 1992 ApJ, 387, 47.
Sakai, S. et al, 1999, ApJ, 523, 540.
Sandage, A.R., Saha, A., Tammann, G. A., Labhardt, L., Panagia, N., Macchetto, F. D., ApJ, 1996, 460, L15.
Shanks, T., 1985, Vistas in Astronomy, 28, 595.
Shanks, T. et al., 1991, In ‘Observational Tests of Cosmological Inflation’, Eds. Shanks, T., Banday, A.J., Ellis, R.S., Frenk, C.S. & Wolfendale, A.W. pp. 205-210 Dordrecht:Kluwer.
Shanks, T., 1997, MNRAS, 290, L77.
Shanks, T., 1999, In Harmonising Cosmic Distance Scales, eds Egret D. & Heck, A., PASP, pp. 230-234.
Shanks, T., Allen, P.D., Hoyle, F. & Tanvir, N.R., 2001, In ‘IAU Symp. 201: New Cosmological Data and the Values of the Fundamental Parameters’, Eds. Lasenby, A.N. & Wilkinson, A., San Francisco:ASP in press.
Tanvir, N. R., Shanks, T., Ferguson, H.C. & Robinson, D.R.T. 1995, Nature, 377, 27.
Wetterich, C., 1988, Nucl. Phys. B302, 645.