A Chandra observation of the interacting pair of galaxies NGC 4485/NGC 4490
Abstract
We report the results of a 20 ks Chandra ACIS-S observation of the galaxy pair NGC 4485/4490. This is an interacting system containing a late-type spiral with an enhanced star formation rate (NGC 4490), and an irregular companion that possesses a disturbed morphology. A total of 29 discrete X-ray sources are found coincident with NGC 4490, but only one is found within NGC 4485. The sources range in observed X-ray luminosity from to erg s-1. The more luminous sources appear, on average, to be spectrally harder than the fainter sources, an effect which is attributable to increased absorption in their spectra. Extensive diffuse X-ray emission is detected coincident with the disk of NGC 4490, and in the tidal tail of NGC 4485, which appears to be thermal in nature and hence the signature of a hot ISM in both galaxies. However, the diffuse component accounts for only of the total X-ray luminosity of the system ( erg s-1, 0.5 - 8 keV), which arises predominantly in a handful of the brightest discrete sources. This diffuse emission fraction is unusually low for a galaxy pair that has many characteristics that would lead it to be classified as a starburst system, possibly as a consequence of the small gravitational potential well of the system. The discrete source population, on the other hand, is similar to that observed in other starburst systems, possessing a flat luminosity function slope of and a total of six ultraluminous X-ray sources (ULX). Five of the ULX are identified as probable black hole X-ray binary systems, and the sixth (which is coincident with a radio continuum source) is identified as an X-ray luminous supernova remnant. The ULX all lie in star-formation regions, providing further evidence of the link between the ULX phenomenon and active star formation. Importantly, this shows that even in star forming regions, the ULX population is dominated by accreting systems. We discuss the implications of this work for physical models of the nature of ULX, and in particular how it argues against the intermediate-mass black hole hypothesis.
keywords:
X-rays: galaxies - Galaxies: individual: NGC 4485/NGC 4490 - Galaxies: interactions1 Introduction
In the two years since its launch, the high spatial resolution () X-ray optics of the Chandra observatory have revolutionised the study of spatially complex X-ray sources. One particular area to benefit greatly from this advance is the study of the X-ray properties of nearby galaxies. This is highlighted by the recent studies of nearby starburst systems such as M82 (Matsumoto et al. 2001; Kaaret et al. 2001), NGC 253 (Strickland et al. 2000) and the Antennae (Fabbiano, Zezas & Murray 2001), where populations of luminous point-like sources and widespread, luminous diffuse emission components are clearly resolved. A further advantage of the high spatial resolution offered by Chandra is the sensitivity it provides to faint point-like sources, reaching limiting fluxes at least an order of magnitude fainter than in comparable exposures with previous missions. The result has been the detection of large numbers of X-ray sources in nearby galaxies; for example 110 X-ray sources were detected in the central regions of M101 to a limiting luminosity of (Pence et al. 2001), and 47 detected within the bulge of NGC 1291 down to L (Irwin et al. 2002). This has, in turn, allowed the first detailed studies of the luminosity functions of discrete X-ray source populations over a wide range of galaxy types and luminosities. For example, Tennant et al. (2001) derive separate luminosity functions for the bulge and disk regions of M81, showing that the disk luminosity function has a shallower slope, consistent with a younger, more luminous source population. On a similar theme, Kilgard et al. (2002) compare the luminosity functions of starburst, disk-dominated and bulge-dominated spiral galaxies, showing that galaxies hosting enhanced star formation have flatter luminosity function slopes due, primarily, to the presence of younger, more luminous X-ray sources in starburst systems.
In this paper we focus upon a new Chandra observation of the nearby ( Mpc, Tully 1988111We note that Tully gives separate distances of 7.8 and 9.3 Mpc for NGC 4485 and NGC 4490 respectively. This is obviously unphysical for a closely interacting system, so we assume a distance of 7.8 Mpc for both galaxies throughout this paper, as taken by Elmegreen et al. (1998). A consistent distance of 8 Mpc is assumed by Viallefond, Allen & de Boer (1980), based on the suspected membership of NGC 4485/90 to the CVn II cloud (de Vaucouleurs, de Vaucouleurs & Corwin 1976).) interacting galaxy pair NGC 4485/NGC 4490. NGC 4490 is a late-type spiral galaxy, classified as type SB(s)d with absolute magnitude (de Vaucouleurs et al. 1991). Its smaller companion NGC 4485 is an irregular galaxy (type IB(s)m) with . At the quoted distance, their projected separation is a mere kpc. The closest encounter between the systems occurred about years ago (based on a comparison with -body simulations, and the age of the stellar populations; Elmegreen et al. 1998), and was a prograde encounter that has produced tidal features in both galaxies, including a “bridge” of material linking a tidal tail at the south of NGC 4485 to the western arm of NGC 4490, and a faint tidal tail to the east of NGC 4490.
NGC 4490 shows considerable evidence for enhanced star formation in both radio continuum and far infra-red observations (Viallefond, Allen & de Boer 1980; Klein 1983; Thronson et al. 1989). Clemens, Alexander & Green (1999) suggest that it is a relatively young galaxy, formed years ago, with an approximately constant star formation rate of M⊙yr-1 throughout its lifetime. This activity predates the interaction with NGC 4485, which has only had time to significantly affect the western arm of NGC 4490. The star formation appears to have driven a galactic-scale bi-polar outflow of H I gas perpendicular to the plane of NGC 4490, resulting in a H I envelope kpc across ( on the sky) surrounding the galaxies (Clemens, Alexander & Green 1998). The passage of NGC 4485 through this H I cloud appears to be ram-pressure stripping it of its atomic, molecular and dusty ISM components (Clemens, Alexander & Green 2000). Detailed Himaging (Duval 1981; Thronson et al. 1989) shows the ongoing star formation in the system to be predominantly in the tidal arms between NGC 4485 and NGC 4490, with additional activity peaking slightly to the west of the nucleus of NGC 4490, and in a northern spiral arm.
This pair of galaxies is not particularly well studied in X-rays. The most detailed study to date was undertaken as part of a survey of nearby spiral galaxies with the ROSAT PSPC by Read, Ponman & Strickland (1997; hereafter RPS97). They detect four compact X-ray sources embedded in extensive diffuse emission. Three sources are associated with the disk of NGC 4490, including one coincident with the nucleus, and the fourth is located at the southern tip of NGC 4485. The spectrum of the diffuse emission appears unusually hard, leading to the speculation that it is largely composed of unresolved X-ray binary systems. Subsequently, two ROSAT HRI images of the galaxies were analysed by Roberts & Warwick (2000; hereafter RW2000) as part of a survey of point-like X-ray sources in nearby galaxies. They detected the same four sources in each observation, plus a fifth apparently transient source on the southern side of NGC 4490, which is only present in the first HRI observation.
Here, we present the results of a recent Chandra ACIS-S observation of the NGC 4485/90 system. We sub-divide the paper in the following manner. In Section 2 we give details of the observation and data reduction. We catalogue the luminous discrete X-ray source population of the galaxies in Section 3, and then investigate the X-ray properties of the population in Section 4, which includes an examination of the properties of six “ultraluminous X-ray sources” (ULX) found within the system. This is followed by the analysis of the remaining diffuse X-ray emission in Section 5. In Section 6 we discuss the total luminosity of the galaxies and the luminosity function of the constituent sources, and compare our results to other starburst systems observed by Chandra. We go on to discuss the implications of the discovery of so many ULX in this particular small galaxy pair for our understanding of the ULX phenomenon in Section 7 before, finally, presenting our conclusions.
2 The Chandra observation
The NGC 4485/90 system was observed by Chandra on 2000 November 3 in a single exposure with a total integration time of 19522 seconds. The nominal pointing position was at , west of the nucleus of NGC 4490. Both galaxies were positioned such that virtually all their optical extent (defined by the D25 elliptical isophote), excepting small regions at the extreme north-east of NGC 4485 and east of NGC 4490, was encompassed within the area covered by the back-illuminated S3 chip. The ACIS-S instrument was operated in the standard full-frame mode, with an integration time of 3.2 s; recorded events were telemetered in the faint mode.
Data reduction was performed using the CIAO software, version 2.1, starting with the level 2 event files. These were filtered such that all events with energies outside the 0.3 – 10 keV range were rejected. The in-orbit background was at a constant low-level during the observation, so that no filtering of periods of background flare contamination was required. Further steps in the analysis of the data are outlined in the appropriate sections below222Note that many of the analysis methods used in this paper follow the standard Chandra data analysis threads, published by the Chandra X-ray Center on http://asc.harvard.edu/ciao/..
3 The discrete source population
A 0.3 – 10 keV Chandra image of the NGC 4485/90 system was produced from the cleaned events file using the standard CIAO tools. The image was created at the full spatial resolution of 0.492 arcsecond/pixel over a pixel ( arcminute) grid centred at the raw pixel coordinate (). Further images were similarly produced in the 0.3 – 2 keV (hereafter “soft”) and the 2 – 10 keV (“hard”) energy bands.
The detection of discrete X-ray sources was performed using the WAVDETECT package. This was run over the 2, 4, 8 and 16 pixel wavelet scales to a significance threshold of , equivalent to an average of one false detection over our field of view. This range of wavelet scales allows the detection of both point-like and moderately-extended sources ( diameter on-axis). WAVDETECT was initally run on the full band image, producing 42 detections. After a visual examination of the detections, we limited our source list to a detection significance of 3.5 or better, leaving the 36 most significant detections. We also ran WAVDETECT on the soft and then the hard band images individually, detecting 33 and 22 of the full band sources respectively to the same detection criteria (20 of which were detected in both bands). There were no examples of a source detected exclusively in either the soft or hard band and not in the full band; this is a direct consequence of both the excellent spatial resolution of Chandra and the moderate exposure of the image, which results in a background per detection element of close to zero for all bands. One source (CXOU J123024.0+413840) was detected only in the full band image, being just below the detection threshold in both the soft and hard images.
| Source designation | Full band | Soft band | Hard band | Hardness ratio | Other IDs/comments | |
|---|---|---|---|---|---|---|
| CXOU J | Count rate | Detection | Count rate | (HR) | ||
| () | signif. () | () | ||||
| 123014.8+414145 | 0.7 0.2 | 6.1 | 0.4 0.2 | [0.3 0.1] | -0.21 0.27 | Background source |
| 123015.2+413535 | 0.6 0.2 | 5.1 | 0.6 0.2 | [0.1 0.1] | -0.62 0.23 | Background source |
| 123017.6+413849 | 0.5 0.2 | 4.5 | 0.2 0.1 | 0.3 0.1 | 0.24 0.31 | Background source |
| 123023.5+413652 | 3.0 0.4 | 22.0 | 2.1 0.3 | 0.9 0.2 | -0.42 0.12 | Background source |
| 123024.0+413840 | 0.4 0.2 | 3.5 | [0.2 0.1] | [0.2 0.1] | -0.08 0.38 | |
| 123025.3+413924 | 3.3 0.5 | 25.4 | 2.2 0.4 | 1.1 0.3 | -0.32 0.12 | |
| 123027.1+413929 | 0.5 0.2 | 3.9 | 0.3 0.1 | [0.2 0.1] | -0.30 0.35 | |
| 123027.3+413813 | 1.0 0.2 | 8.1 | 0.2 0.1 | 0.8 0.2 | 0.55 0.19 | |
| 123028.3+413958 | 1.1 0.3 | 7.6 | 1.1 0.3 | [0.1 0.1] | -0.86 0.12 | |
| 123028.7+413926 | 0.8 0.2 | 5.6 | 0.3 0.1 | 0.5 0.2 | 0.31 0.26 | |
| 123028.8+413756 | 0.6 0.2 | 5.0 | 0.5 0.2 | [0.1 0.1] | -0.56 0.25 | |
| 123029.2+414046 | 0.9 0.2 | 7.2 | 0.7 0.2 | [0.3 0.1] | -0.43 0.21 | Bridge source |
| 123029.5+413927 | 14.6 1.1 | 83.3 | 6.5 0.7 | 8.1 0.8 | 0.11 0.06 | FIRST J123029.4+413927 |
| 123030.4+413852 | 8.2 0.8 | 44.4 | 4.8 0.6 | 3.5 0.5 | -0.16 0.08 | |
| 123030.6+414142 | 76.1 4.3 | 336.5 | 50.9 3.0 | 25.1 1.7 | -0.34 0.02 | NGC 4485 X-1 |
| 123030.8+413911 | 36.5 2.3 | 167.0 | 19.1 1.4 | 17.4 1.3 | -0.05 0.04 | Transient b |
| 123031.1+413837 | 0.8 0.2 | 5.2 | [0.4 0.2] | 0.4 0.1 | -0.06 0.29 | |
| 123031.4+413901 | 0.6 0.2 | 3.6 | [0.3 0.2] | 0.4 0.1 | 0.13 0.34 | |
| 123032.3+413918 | 27.5 1.8 | 136.3 | 17.1 1.3 | 10.3 0.9 | -0.25 0.04 | NGC 4490 X-1 |
| 123034.3+413805 | 1.3 0.3 | 9.5 | 0.6 0.2 | 0.6 0.2 | 0.04 0.21 | |
| 123034.4+413849 | 6.9 0.7 | 41.2 | 5.1 0.6 | 1.8 0.3 | -0.47 0.08 | |
| 123035.2+413846 | 2.0 0.4 | 11.7 | 1.4 0.3 | 0.5 0.2 | -0.50 0.15 | |
| 123035.9+413832 | 0.9 0.2 | 4.8 | 0.6 0.2 | [0.2 0.1] | -0.60 0.25 | |
| 123036.3+413837 | 29.2 1.9 | 131.5 | 18.3 1.3 | 10.9 0.9 | -0.25 0.04 | NGC 4490 X-2 |
| 123038.3+413830 | 0.5 0.2 | 3.8 | 0.6 0.2 | [0.0 0.0] | -1.00 0.16 | |
| 123038.5+413742 | 2.8 0.4 | 19.9 | 2.1 0.4 | 0.6 0.2 | -0.55 0.12 | NGC 4490 X-3 c |
| 123039.0+413809 | 2.7 0.4 | 19.8 | 1.7 0.3 | 1.0 0.2 | -0.23 0.14 | |
| 123039.1+413822 | 0.7 0.2 | 4.6 | 0.5 0.2 | [0.1 0.1] | -0.78 0.29 | |
| 123039.1+413751 | 0.5 0.2 | 3.8 | 0.5 0.2 | [0.0 0.0] | -1.00 0.15 | SSS |
| 123040.4+413813 | 5.9 0.6 | 34.7 | 3.7 0.5 | 2.1 0.4 | -0.26 0.09 | |
| 123043.1+413756 | 0.8 0.2 | 6.0 | 0.8 0.2 | [0.0 0.1] | -0.96 0.14 | |
| 123043.2+413818 | 50.7 3.0 | 259.4 | 29.8 1.9 | 20.7 1.5 | -0.18 0.03 | NGC 4490 X-4 |
| 123045.6+413639 | 1.1 0.2 | 8.4 | 0.9 0.2 | [0.1 0.1] | -0.75 0.16 | |
| 123047.8+413807 | 0.5 0.2 | 4.2 | 0.3 0.1 | [0.2 0.2] | -0.18 0.42 | |
| 123047.9+413727 | 2.0 0.3 | 15.4 | 1.6 0.3 | 0.4 0.1 | -0.63 0.13 | |
| 123049.6+414056 | 12.1 1.0 | 89.2 | 9.5 0.8 | 2.6 0.4 | -0.57 0.05 | Background source (S2 chip) |
| Notes: a Probable supernova remnant. b ULX. c Previous X-ray source ID from RW2000. |
The sources are listed in Table 1. In this table we show their name according to the official IAU designation for Chandra sources (which incorporates their position in J2000 coordinates), the count rates in the full, soft and hard bands, the significance of their full band detection and a hardness ratio (discussed below). Where WAVDETECT did not detect a source in a particular band, we quote a count rate based on aperture photometry at the position of the source, using a 4-pixel radius to extract the source counts and an annulus between 4 and 8 pixels in radius to provide a measure of the local background for each source. These aperture-based count rates are shown in Table 1 in square brackets333The aperture-based count rates are not corrected for systematic errors such as the encircled energy fraction. This is because for these low count rates ( counts in 19522 s) and small off-axis angles the corrections are significantly smaller than the error on the count rates.. We also add comments on possible identifications based on previous observations, multi-wavelength data and the source position on the sky.
We assume a flat exposure time of 19522s across the field. This is because the exposure map calculated for the observation at 1.5 keV shows that, over the area on the S3 chip covered by the galaxies, the effective exposure varies by no more than 5%. To correct for exposure variations one would ideally create a single, multi-energy exposure map appropriate to all sources within the galaxies. However, this is not sensible, since the sources vary greatly in spectral shape, whilst a multi-energy exposure map would of necessity incorporate an “average” spectral form. Instead, we simply add the 5% error, in quadrature, to the existing counting errors. This systematic error only exceeds the intrinsic error in the five brightest detected sources, and is negligible for the faint sources.
The sources were all examined for spatial extension beyond the Chandra point spread function. However, under close scrutiny an analysis of the source extent was found to be suitable only in the case of the brightest sources, where the photon statistics were sufficient for a detailed study. We present these results in §4.2.1.
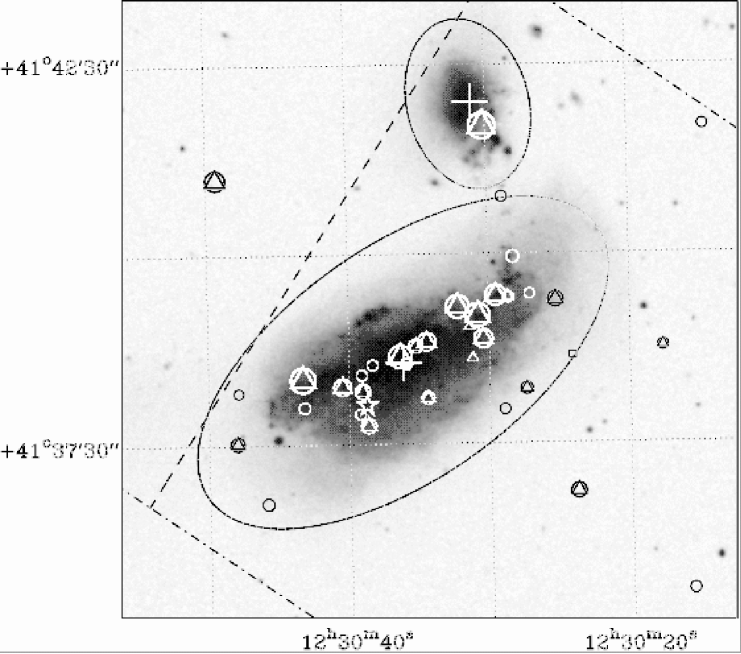
Figure 1 shows the positions of the X-ray sources overlayed on to a digitised Palomar sky survey image (taken from the DSS-2 blue data), with hard and soft band detections differentiated by the use of separate symbols. This figure also shows the optical extent of the galaxies (shown by the D25 ellipse, representing the 25 mag/arcsecond2 isophote for each galaxy) and the regions covered by the ACIS-S S2 and S3 chips. Note that the size of the markers does not in any way represent the positional uncertainty of the sources; the ACIS-S positions are accurate to an RMS of (Chandra Proposer’s Observatory Guide), which is a factor 10 smaller than the smallest symbol in the figure.
We see a total of 29 sources within the D25 ellipse of NGC 4490, with only one source (albeit the brightest), CXOU J123030.6+414142, coincident with NGC 4485. Intriguingly, a further source - CXOU J123029.2+414046 - is located between the galaxies (as demarkated by their D25 ellipses), and may be associated with a bridge of material pulled out of NGC 4485 by the tidal interaction, as described by Elmegreen et al. (1998). There are a total of five probable background sources, the brightest of which lies on the S2 chip. If we consider the photometric nuclear positions of both galaxies listed in NED (from Falco et al. 1999), no evidence is seen for an X-ray source coincident with the either nucleus; in the case of NGC 4490 two sources are detected in the proximity of the nucleus, but are separated from the nuclear position by 6pc; CXOU J123035.9+413832) and 9pc; CXOU J123036.3+413837) respectively (c.f. an error of 2.5′′ on the photometric nuclear positions). We also do not detect an X-ray counterpart to the recent supernova SN 1982F, though there are several X-ray sources in its close proximity.
Of the 30 sources coincident with the galaxies, we would expect some fraction to be background objects. We investigate the level of this contamination using the Chandra Deep Field South number counts of Giacconi et al. (2001), treating the soft and hard bands separately. In the hard (2 – 10 keV) band, Giacconi et al. (2001) measure an average spectral index for cosmic X-ray sources of . Using the same spectral form, we obtain a limiting flux of for our limiting count rate of . This converts to a total of 308 sources per square degree using Equation (2) of Giacconi et al. (2001), or a total contamination of cosmic background sources over the combined area of NGC 4485 and NGC 4490. This amounts to fewer than 10% of the 19 hard band detections.
The situation in the soft band is somewhat complicated by the intrinsic H I distribution of the galaxy pair (e.g. Clemens, Alexander & Green 1998). The minimum line-of-sight H I column through the galaxies at the D25 isophote is , which increases substantially towards the centre of NGC 4490. Hence, the flux detection limit for any cosmic sources lying behind the galaxy will be severely affected. We account for this by converting our minimum soft band (0.3 – 2 keV) count rate into an unabsorbed 0.5 – 2 keV flux (assuming from the full band powerlaw fit of Giacconi et al. (2001), and a line-of-sight column composed of their best-fit value plus a typical (minimum) H I column for the source detections of ). This gave an equivalent cosmic source flux detection limit of . Equation (1) of Giacconi et al. then implies that we have a cosmic source contamination of sources in the soft band, which is almost certainly an overestimate due to the fact that the H I and X-ray source distributions appear strongly correlated. In comparison, there are 28 soft band source detections coincident with the galaxies.
The above numbers can be confirmed using the off-galaxy regions covered by the S3 chip in our Chandra observation. In total, an area 1.6 times greater than that of the galaxies is covered off-galaxy on the S3 chip (see Figure 1), at a similar flux limit. A total of 5 soft and 2 hard cosmic sources are found within this region, consistent with the above contamination estimates. We therefore consider that the total contamination of the 30 NGC 4485/90 X-ray sources by a cosmic component to be at most , and probably less.
4 Characteristics of the discrete X-ray sources
4.1 Hardness ratios and spectral trends in NGC 4490
In order to investigate the characteristics of the detected sources further, we calculate a hardness ratio, HR, between the soft (0.3 – 2 keV) and hard (2 – 10 keV) count rates for each source (see Table 1), using the hardness ratio conventions of Ciliegi et al. (1997) where a more positive value of HR implies a harder source spectrum. Figure 2 shows the HR values of the sources coincident with NGC 4490 plotted against source count rate. We also plot three fiducial markers to demonstrate the dependence of HR on either the intrinsic spectral shape of the sources (represented here by a powerlaw continuum with slope ), or the intrinsic absorption column (note the minimum column of corresponds to the Galactic foreground column towards NGC 4485/90 interpolated from the H I maps of Stark et al. 1992).

Figure 2 demonstrates a wide scatter in HR value, which is particularly pronounced for the faintest sources in NGC 4490. The observed HR values imply that the hardest sources have either negative photon indices or very high absorption column (), whereas the softest sources must have both intrinsically low column and a steep spectral form (). We find a weighted mean of for the HR, a value which would be typical of, for example, a luminous X-ray binary in NGC 4490 with and an absorption column , given that the total line-of-sight column through the disk of the galaxy is (Clemens, Alexander & Green 1998).
| Sample | Number of sources | Count rate limits (0.3 – 10 keV) | Extreme HR values | Weighted mean HR | Median HR |
|---|---|---|---|---|---|
| Bright | 5 | -0.18 | |||
| Medium | 8 | -0.395 | |||
| Faint | 16 | -0.43 |
We investigate the variation of HR with flux level in NGC 4490 further in Table 2. In this, we split the sources up into three samples, with the limits between the samples set at 0.0013 and 0.013 (0.3 – 10 keV) respectively. Assuming the inferred average spectral shape for the full sample (, ) and a distance of 7.8 Mpc, the count rate limits convert to observed source luminosities of (faint sample), (medium) and (bright). Table 2 shows that as the sources get fainter, their average spectrum (indicated by both the weighted mean444The weighted mean is calculated for each sample using the formal statistical error on each individual hardness ratio as its weighting factor. and median values) gets softer. This suggests that either a new, spectrally softer population of sources is appearing at fainter fluxes, or that the fainter sources are less absorbed than their bright counterparts.
Viable candidates for a softer source population at luminosities include X-ray bright supernova remnants (e.g. Schlegel 1995) or intrinsically very soft X-ray binaries such as “super-soft sources” (SSS; see below). To examine whether a new, intrinsically soft population is appearing at faint fluxes we have examined the four softest sources in more detail. They have HR values of , which are equivalent to temperatures keV for a solar abundance MEKAL thermal plasma model, consistent with the temperatures found for supernova remnants in nearby galaxies (c.f. RPS97, who find a typical temperature of keV for supernova remnants in their ROSAT PSPC survey of a small sample of nearby galaxies). Unfortunately, all four sources are too faint for spectroscopy, and even when combined we do not have sufficient photons for detailed spectral analysis. However, we are able to further examine their X-ray colours by creating an 0.3 – 0.5 keV image of the galaxy. Three of the soft sources do not show significant emission ( count) in this very soft band, implying they are only moderately soft, or they are absorbed by a column of . However, all the counts detected from the source CXOU J123039.1+413751 are seen below 0.5 keV. This makes it a bona fide candidate for a super-soft source, a class of moderately luminous () soft X-ray emitting objects thought to contain a white dwarf star with steady nuclear burning present in its envelope (Van den Heuval et al. 1992). Typically such a source has an X-ray spectrum characterised by a black-body continuum with a peak at eV. Many of these objects are now known in local group galaxies (Greiner 2000), and they are becoming more commonly seen as a minority population (at the few percent level) in deep surveys of nearby galaxies, for example in the ROSAT PSPC survey of M31 (Supper et al. 2001) and in a Chandra observation of the central regions of M101 (Pence et al. 2001).
We examine the second option, namely that the fainter sources are less absorbed, by creating composite spectra of all the sources in both the faint and medium flux samples (we examine the individual spectra of the bright sources in the next section). Spectra were extracted from the cleaned event files using the PSEXTRACT script, which also creates the appropriate instrument response files. We used the source region files output by WAVDETECT to define the source areas, and then extracted all spectra simultaneously to form one output file for each flux-limited sample. A background file was extracted by moving all the source regions arcseconds to the west of their original positions, in each case into a source-free region, and following the same extraction procedure (which is automatically executed by PSEXTRACT). Finally, the spectra were grouped to 25 counts per spectral bin and analysed in XSPEC, where we only consider spectral bins in the 0.5 - 10 keV range in which the ACIS-S calibration is best defined555In practice the spectra presented in this paper do not extend above 8 keV, as the detector area falls off sharply at this energy. Hence all fluxes hereafter are generally quoted with 8 keV as the upper energy limit..

| Spectral model | Sample | () | (keV) | Reduced | Degrees of freedom |
|---|---|---|---|---|---|
| WA*POa | Faint | 1.43 | 6 | ||
| Medium | 1.33 | 20 | |||
| WA*BRa | Faint | 1.4 | 6 | ||
| Medium | 1.32 | 20 | |||
| WA*MEKALab | Faint | 1.4 | 6 | ||
| Medium | 1.43 | 20 |
| Notes: |
| aThe model components are: WA - cold absorption; PO - powerlaw continuum; BR - thermal bremsstrahlung; MEKAL - |
| Mewe, Kaastra & Liedahl (1995) thermal plasma model. |
| b The MEKAL is assumed to have solar abundance (see text). |
The composite spectra were fit with simple models (one component plus absorption) due to the photon-limited nature of the faint sample spectrum ( counts). We show the best fitting results in Table 3, and the data in Figure 3. In the table, the models are defined as per the XSPEC syntax, and the quoted errors are the 90% limits for one interesting parameter (or the upper/lower limit where only one constraint could be placed). All models give reasonably similar fits to the data. Note that the MEKAL models were assumed to have solar abundance, since the data quality is too poor (particularly in the case of the faint sample) to distinguish thermal line emission. It appears that a difference in the average absorption gives rise to the change in HR between the two samples, that is to say that the faint sample sources are on average less absorbed than the medium sample sources. Again, there may be two explanations, namely that the more luminous sources either have a higher intrinsic absorption, or are preferentially located deeper within the galaxy disk (or in regions of denser ISM) than the fainter sources. The average column of for the medium sample places the absorbed objects almost exactly half-way through the H I cloud associated with NGC 4490, supporting the latter of the two scenarios. The fainter sources, on the other hand, have a column more consistent with their presence either on the edge of, or on the near-side of, NGC 4490.
4.2 Ultraluminous X-ray sources
The “bright” sample is of particular interest given that all its sources have X-ray luminosities which lie above . If we include the source CXOU J123030.6+414142, which is coincident with NGC 4485, this gives us six sources in the regime of the so-called “ultraluminous X-ray sources” (ULX)666A note on taxonomy: in this paper we refer to the subset of non-nuclear X-ray sources in nearby galaxies with observed X-ray luminosities in excess of as ultraluminous X-ray sources (ULX). Previous papers have variously referred to such sources as “ultra-luminous compact X-ray sources” (ULX; Makishima et al. 2000), “super-luminous X-ray sources” (SLS; e.g. RW2000), “super-Eddington sources” (SES; e.g. Roberts et al. 2001) or “intermediate-luminosity X-ray objects” (IXOs; e.g. Strickland et al. 2001). within the NGC 4485/90 system. To place this in context, the ROSAT HRI survey of bright, nearby galaxies of RW2000 detected only 28 ULX in a total of 83 nearby galaxies (albeit in a narrower and softer energy band that is more sensitive to absorption than that of Chandra ). We can estimate the relative overabundance of ULX in the NGC 4485/90 system, compared to the local average, using the form of the discrete source luminosity distribution for spiral galaxies presented in RW2000, which integrates to ULX per LB (where LB is the luminosity in blue light in solar units). Taking L L⊙ for NGC 4485/90 (Tully 1988) leads to a prediction of ULX in the ROSAT band. RW2000 catalogued three ULX in NGC 4485/90 in their ROSAT HRI survey, implying an overabundance factor of . Clearly, this galaxy system has an exceptionally high incidence of ULX. In the rest of this section we investigate the X-ray properties of the individual ULX in the NGC 4485/90 system. The implications of the discovery of so many ULX in this interacting galaxy pair is discussed further in §7.
4.2.1 Evidence of extension of the sources?
Firstly, we investigate whether the ULX all appear truly point-like under close analysis. To define the observational appearance of a point-like source in an on-axis Chandra observation, we obtained the images of the QSOs PG 2302029 and PKS 2126-158 from the Chandra archive, which have a total of and raw Chandra source counts respectively. For each source we derived a radial profile from the full band image, in single (0.492′′) pixel steps, out to a radius of 20 pixels, and subtracted the background using a further annulus located between 20 and 30 pixels away from the source position. We fit the core of the resulting profile with a Gaussian function, and found best fits to the FWHM of the profiles of and pixels (90% errors) for PG 2302029 and PKS 2126-158 respectively, which are consistent with the values of pixels measured in the on-ground calibration phase (see the calibration pages on http://cxc.harvard.edu). We repeated the procedure for each of the six brightest sources in the NGC 4485/90 system. All of the sources were found to have radial profiles consistent (within the 90% errors) with those found for the QSOs. We therefore conclude that none of the bright sources appears to possess an extended core.
As a further test of extent, we examined the possibility of low-level enhancements in the wings of the PSF produced by a faint, extended component. To do this we compared the number of counts within the annuli between 6 and 20 pixels away from each source to the total counts within the 20 pixel radius (note that the 90% encircled energy radius for Chandra is pixels). In the case of the QSOs we found that of the total counts were found within this region. Once nearby sources were excluded, this figure was again replicated for each of the bright source sample, with one exception. Source CXOU J123036.3+413837 has of the counts within 20 pixels in the 6 – 20 pixel annulus. Inspection of the data shows that this is not necessarily due to an extension to the PSF for the source, but that it is more likely to be due to the location of the source in enhanced diffuse emission close to the galaxy nucleus. We discuss this diffuse emission further in §5. We therefore conclude that there is no evidence for extension in any of the bright sources, and so all are considered to be individual discrete sources at the resolution of Chandra (, which is equivalent to pc at the distance of NGC 4485/90).
4.2.2 X-ray spectra
The X-ray spectrum of each source was extracted using the PSEXTRACT script, in each case using a 6-pixel radius aperture about the source position and a local background region. The spectra were again fit with simple (absorption plus a single component) models in XSPEC, namely absorbed powerlaw continua, thermal bremsstrahlung and multi-colour disk black-body (hereafter MCD BB) models. The last of these models is found to be the best fit to many ULX by Makishima et al. (2000), and describes the expected spectrum of an optically-thick accretion disk in a black-hole binary system in a soft (high) state as calculated by Mitsuda et al. (1984). These models gave statistically good fits to the data in almost all cases. We also investigated absorbed black-body continua and optically-thin thermal components (MEKAL model), but none produced adequate fits to the data, with one exception (see below). We detail the fits in Table 4 in descending order of the observed ULX count rate, in each case highlighting a “best-fit” model used primarily to calculate the luminosity of each source. We detail the motivation for the choice of the “best-fit” model in the following paragraphs. The data and best-fitting models for all of the sources are shown in Figure 4, plotted on identical scales for direct comparison.
| Source | WA*POa | WA*BRa | WA*DISKBBa | LXb | ||||||
|---|---|---|---|---|---|---|---|---|---|---|
| (CXOU J) | c | /dof | c | /dof | c | /dof | ||||
| 123030.6414142 | 65/47 | 56/47 | 46/47 | 4.0 (4.6) | ||||||
| 123043.2413818 | 40/32 | 33/32 | 28/32 | 3.1 (4.4) | ||||||
| 123030.8413911 | 22/23 | 23/23 | 26/23 | 2.9 (4.6) | ||||||
| 123036.3413837 | 19/17 | 19/17 | 20/17 | 1.9 (2.6) | ||||||
| 123032.3413918 | 24/16 | 24/16 | 24/16 | 1.9 (2.6) | ||||||
| 123029.5413927 | 5/7 | 6/7 | 7/7 | 1.0 (4.9) | ||||||
| Notes: |
|---|
| a spectral model components as per Table 3, except DISKBB which is the XSPEC tabulation of the multi-colour disk black-body model. |
| b observed luminosity in the 0.5 - 8 keV band in units of . Figures in brackets give the intrinsic (unabsorbed) luminosity. |
| We calculate these values using the best-fit model highlighted by showing its /dof in bold face. |
| c absorption column in units of . |
| d temperature in keV. |
| e inner accretion disk temperature in keV |


All the sources display absorption well in excess of the foreground Galactic line-of-sight , and values are consistent with the sources being embedded within the H I cloud that envelopes the NGC 4485/90 system. The five brightest sources are all well-fit by the MCD BB with a temperature consistent with that found for other ULX by Makishima et al. (2000) (i.e. in the range 1.1 – 1.8 keV). Indeed, this model is clearly the best fit for the two brightest sources, implying that they are plausible ultraluminous black hole X-ray binary systems in the high (soft) state. The next three brightest are equally well-fit by powerlaw continua models, so whilst they are also very likely to be ultraluminous black hole X-ray binary systems, their actual state (high or low) is somewhat ambiguous on the basis of this data. This interpretation is only questionable in one source, CXOU J123032.3413918, which has an X-ray spectrum which is also well-fit by a solar-abundance MEKAL thermal plasma model ( keV).
The spectrum of the final source, CXOU J123029.5413927, is the least well-defined of the sample as it is by far the faintest of the six sources. Despite this, it does appear quite different to the other five sources, with an extremely high absorption column of and also a soft underlying continuum form ( keV in the thermal bremsstrahlung model). Its fit to the MCD BB model actually shows a temperature below the normal range for ULX. A key piece of evidence as to its nature is the exact coincidence of this source with a radio source, FIRST J123029.4+413927. These properties are consistent with an X-ray and radio luminous supernova remnant (providing the motivation for the choice of a thermal bremsstrahlung model as “best-fit”, as opposed to the non-thermal powerlaw continuum, in Table 4). Interestingly, if it is the result of a very recent supernova, the high obscuring column could be the reason that it was not seen in the optical regime. We also note that the high X-ray luminosity and absorption column are consistent with the scenario of a supernova exploding into a dense circumstellar environment and emitting copious X-rays due to the interaction of the supernova shock wave with the circumstellar matter (e.g. Fabian & Terlevich 1996; Chevalier & Fransson 1994).
4.2.3 Short-term X-ray variability
We investigated the variability of each of the six ULX over the 19.5 ks observation by creating lightcurves binned to an average of 25 counts per bin, i.e. a signal-to-noise ratio of 5. We then tested the variability of each source against the hypothesis that the source flux was constant using a test. We found that none of the sources showed any evidence for short-term variability, with each lightcurve well-fit by a constant flux. A visual inspection of the lightcurves verified this result.
4.2.4 Long-term X-ray variability
The NGC 4485/90 system was observed by ROSAT four times during the 1990s, once with the PSPC and three times with the HRI. We are therefore able to extract information on the long-term variability of the ULX, over a baseline of ten years, from the combined datasets. We use ROSAT PSPC count rates from the RPS97 analysis of a 30 ks observation of the system. They detect four of the six bright sources (CXOU J123030.8413911 and CXOU J123029.5413927 are not detected); however the moderate intrinsic spatial resolution of the ROSAT PSPC, which is in the range , means that the count rates of the sources are open to contamination by nearby sources and/or extended emission components. We attempt to quantify this effect by examining the soft band Chandra image. The additional emission above the nominal off-galaxy background within 45′′ of the source positions is negligible ( of the source counts) for both CXOU J123030.6+414142 and CXOU J123043.2+413818. However, we find that only 33% of the counts from within 45′′ of CXOU J123032.3+413918 and 45% of the counts within 45′′ of CXOU J123036.3+413837 come from each source respectively. Our best estimate of the count rate of each of these sources at the epoch of the ROSAT PSPC observation is therefore the observed count rate multiplied by this fraction. The same consideration is not necessary in the case of the ROSAT HRI datasets, where the bright sources are fully resolved from their neighbouring components by the beam. We take the count rates for the latter two HRI observations from RW2000, and perform a new analysis to derive the count rates from the first ROSAT HRI observation (observation ID rh600697n00).
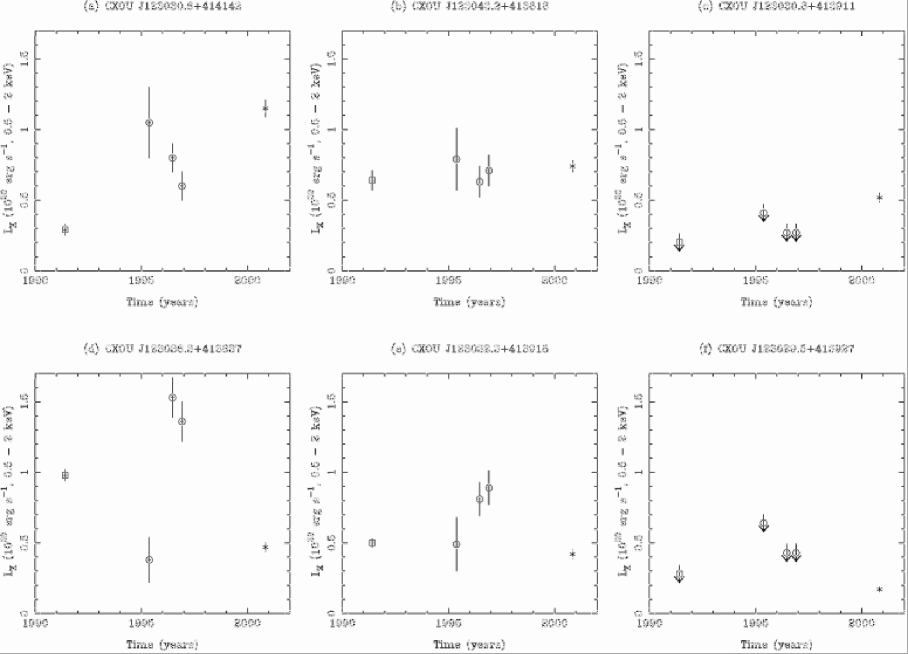
We derive count rate to flux conversions for both the PSPC and HRI detections in XSPEC, using the best fit models found in the spectral analysis of the Chandra data. These are folded through the relevant instrument response matrices, and then normalised to the flux at each epoch using the predicted and observed count rates for each instrument. Finally, we convert the fluxes into luminosities for the NGC 4485/90 system. The upper limits on the luminosities of the two sources not detected by ROSAT were calculated in a similar fashion, except that we set a conservative upper limit on the count rate at the flux of the faintest (normally significance) source detection count rate in each field. The results of these calculations are shown in Figure 5, where we present a long-term lightcurve for each of the six ULX.
As can be seen, four sources are detected in each observation, and two sources are only detected in the Chandra ACIS-S observation. The reasons for the non-detections differ; CXOU J123030.8413911 appears to be transient in nature, with an observed (0.5 – 2 keV) luminosity in the Chandra data epoch well in excess of the limits placed on it from the earlier measurements, whereas CXOU J123029.5413927 is faint in the 0.5 – 2 keV band due to its highly absorbed spectrum and so, assuming a constant flux, is undetectable in the previous observations (though, of course, this data cannot rule out variability in this source). Of the four detections, three sources appear strongly variable over the 10 year baseline (factors ), with their intrinsic flux increasing and declining throughout this period, characteristic of accreting sources. One source, however, (CXOU J123043.2+413818) does not behave in this way. Instead, it shows a reasonably constant luminosity of (0.5 - 2 keV) over the 10-year baseline, implying that if it is an X-ray binary then it might have a duty cycle with a long, remarkably stable epoch in the high state.
5 Diffuse emission
An inspection of the raw Chandra data suggests that there may be a diffuse emission component present in and around the centre of NGC 4490. We investigated this by adaptively smoothing the Chandra images using the CSMOOTH routine. This provides the user with a image that has been smoothed using a 2-D Gaussian kernel, with a variable size that is set to increase until it provides a certain statistical acceptability (in this case at least 3) for the count rate at each point in the image. These images confirm the presence of widespread diffuse emission within NGC 4490 and, to a lesser extent, NGC 4485. We show a contour map of the CSMOOTHed soft (0.3 – 2 keV) band data overlaid on the DSS2 blue image of the galaxy pair in Figure 6. The positions of the brightest point sources as well as the diffuse component are shown, but the variable kernel size and the tight Chandra PSF mean that the point source flux is not significantly smoothed into the surrounding emission. Hence away from the source positions we are seeing a truly separate component.
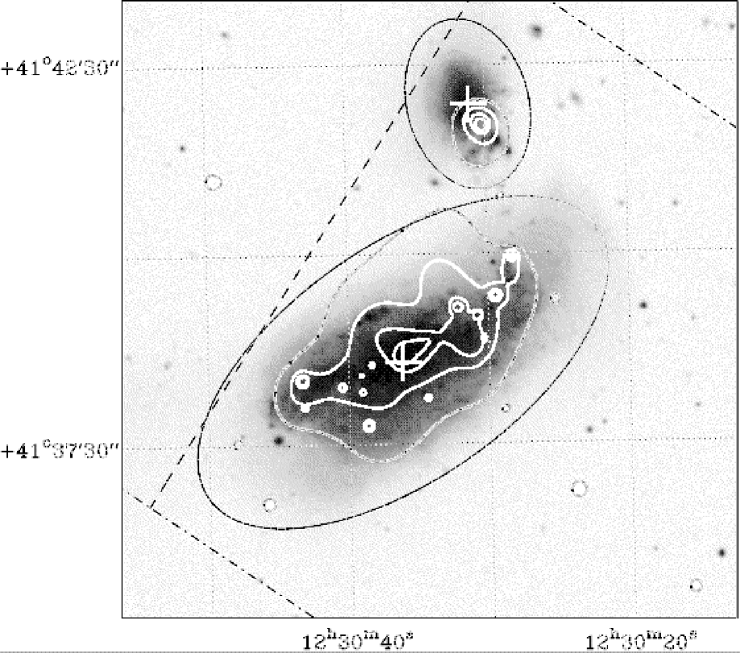
Figure 6 shows that the diffuse emission associated with NGC 4490 has two main peaks; the brightest is centred immediately to the north-west of the nuclear region, and a secondary peak lies arcminute to the west, just to the south of the ULX CXOU J123030.8413911 and CXOU J123032.3+413918. The position of the nuclear peak matches the peak in both 100m emission and H noted by Thronson et al. (1989), and the secondary peak matches an extension to the west of the nucleus in the same emission bands. The overall distribution of the diffuse emission roughly follows the optical light distribution on the southern side of NGC 4490. However, the diffuse emission contours (and in particular the lowest contour) are extended away from the high optical surface brightness regions to the north. This may imply that the diffuse component in this region of the galaxy is perturbed by high energy processes, e.g. outflows and/or superwinds originating in the star formation regions. There is an additional enhancement in the diffuse X-ray surface brightness in the southern half of NGC 4485, seemingly centred around the bright X-ray source CXOU J123030.6+414142 in the tidal tail of the galaxy. However, the asymmetric shape and size of the emission region implies that it is not simply the wings of the source PSF, but that it is a true detection of a region of diffuse emission. The presence of a possible hot ISM in just the southern tidal tail of NGC 4485 agrees with the observations of Clemens, Alexander & Green (2000), where the atomic, molecular and dusty gas associated with the galaxy are largely located in the same region, and a bow-shock is identified in the H I gas to the north of this region. This is consistent with a scenario in which the motion of NGC 4485 in a northerly direction through the extended H I cloud of NGC 4490, at an estimated velocity of 90 km s-1, causes NGC 4485 to be stripped of all components of its ISM through the process of ram-pressure stripping (Clemens, Alexander & Green 2000).
We performed the same analysis for the hard (2 – 10 keV) band, but this band was devoid of significant amounts of unresolved emission, with none appearing in the CSMOOTHed image above a level of twice the nominal off-galaxy surface brightness.
As a next step, we investigated the X-ray spectrum of the diffuse emission. Firstly, we excluded all photons within the discrete source data extraction regions (as used in previous sections) from the event list. We then extracted the spectrum of the remaining emission in an elliptical region of dimensions (semi-major axis) by (semi-minor axis), centred on the western tip of the highest emission contour in the centre of NGC 4490 in Figure 6, and at a position angle of 120∘ east of north. This covers most of the area within the 2.5 times background level contour, and all the area under the 5 times background level contour, in Figure 6. We note that a mere of the total area covered by the ellipse is excluded by the subtraction of the point sources, hence no correction is required for the area lost. Finally, a background spectrum was extracted from a source-excluded region to the south-west of the galaxy of equivalent size to the ellipse. The resulting spectrum of the diffuse emission, containing a total of counts, was again analysed in XSPEC.
Due to the soft nature of the emission, and the rising ACIS-S instrument background as a function of energy, noise dominated the spectral data at energies above 2 keV and hence the analysis was restricted to the 0.5 – 2 keV range. A variety of absorbed single component spectral models were fit to the data, as per §4.2.2. The data were clearly best fit by an absorbed MEKAL optically-thin thermal plasma model, with a of 43 for 53 degrees of freedom. This compares to of 74 - 98 (for the same degrees of freedom) using absorbed powerlaw continuum, thermal bremsstrahlung and MCD BB models. The best fitting parameters are shown in Table 5, and the spectral data with the best fitting model is displayed in Figure 7.
Line-like residuals are clearly still present in the spectrum, particularly at around 1.3 keV. To investigate whether these residuals were better fit by more complicated models we fit the data with combinations of two physical models plus absorption. Both an absorbed MEKAL plus highly absorbed powerlaw (WA*[MEKAL+WA*PO] in XSPEC syntax) and an absorbed two-temperature MEKAL (WA*[MEKAL+WA*MEKAL]) model achieved similar statistical acceptability to the single component MEKAL fit ( of for 50 degrees of freedom). However, the presence of additional parameters in the fit meant that we were unable to tightly constrain the values of the fit parameters, hence we only quote the values of the well-constrained single component fit in Table 5. Both models were highly flux-dominated by the softer MEKAL component (with keV, abundance solar, absorption ) with the harder component only contributing significantly above 1 keV (MEKAL with keV, same abundance, extra absorption; or a powerlaw continuum absorbed by a column of ). Hence even in the more complicated models the spectrum is dominated by a soft thermal plasma component. Indeed, in the MEKAL plus powerlaw model 95% of the flux is supplied by the MEKAL model, emphasizing that there appears little contribution to the diffuse emission originating in non-thermal sources (i.e. unresolved, point-like sources). The spectral models are consistent with the lack of a strong diffuse component in the hard band images, and together they suggest that the diffuse emission component seen in NGC 4490 is predominantly thermal in nature.
| Model component | Parameter | Value |
|---|---|---|
| WABSa | () | |
| MEKAL | (keV) | |
| Abundance (solar units) |
| Notes: |
| a Minimum column constrained to the foreground Galactic of |
All the inferred spectral fits have absorption columns in excess of , over twice the Galactic line-of-sight column, implying that the unresolved X-ray emission is coming from a component that is at least in part mixed in with the cooler, absorbing gas in NGC 4490. The derived temperature of the diffuse emission is fairly typical of the diffuse component seen in other moderate-activity galaxies (Ptak et al. 1999), as is the significantly sub-solar abundance. Low ( solar) abundances are generally attributable to the thermal plasma being in a complicated, multi-temperature state poorly described by a single temperature model (see e.g. Dahlem, Weaver & Heckman 1998). The presence of line-like residuals, even after fitting the MEKAL model, may also imply that the relative abundances of the heavy elements are not at the solar ratio. The best fit spectrum has an observed 0.5 – 2 keV flux of , which implies a diffuse emission luminosity of .

6 Luminosity issues
6.1 The total X-ray luminosity of the system
In Table 6 we present a decomposition of the X-ray luminosity of the galaxy into its resolved (discrete source and diffuse emission) parts. The discrete source luminosities are derived from the best fit models described in §4, in the 0.5 – 8 keV range. Intrinsic luminosities refer to the luminosity derived for each spectral model in that band if the line-of-sight absorption is removed. The unresolved emission from NGC 4490 was also taken from its best fit spectrum (c.f. §5), and is extrapolated here into the wider 0.5 – 8 keV band (though note that this increases the luminosity by due to its intrinsically soft nature). We estimated the luminosity of the unresolved component in the southern part of NGC 4485 in the following manner. We extracted an image in the 0.5 – 8 keV band in a circular aperture, 30′′ in radius, about a position south of CXOU J123030.6+414142, and excluding a radius of 6 pixels around the source. A similar-sized background region was extracted in a source-free region to the south-west. The difference between the number of counts in each image gave an estimate of the number of counts in the diffuse component, namely counts. A similar analysis shows that counts lie in the comparable unresolved emission component for NGC 4490. Assuming a similar spectral form for the diffuse emission, we derive the luminosities for the NGC 4485 diffuse component shown in Table 6.
| Component | Observed LX | Intrinsic LX |
|---|---|---|
| (, 0.5 - 8 keV) | ||
| Discrete X-ray sources | ||
| CXOU J123030.6+414142 | 4.0 | 4.6 |
| CXOU J123043.2+413818 | 3.1 | 4.4 |
| CXOU J123030.8+413911 | 2.9 | 4.6 |
| CXOU J123036.3+413837 | 1.9 | 2.6 |
| CXOU J123032.3+413918 | 1.9 | 2.6 |
| CXOU J123029.5+413927 | 1.0 | 4.9 |
| Medium sample | 2.3 | 3.2 |
| Faint sample | 0.7 | 0.8 |
| Diffuse emission | ||
| NGC 4485 | 0.2 | 0.4 |
| NGC 4490 | 1.6 | 3.6 |
| Total | 19.6 | 31.7 |
The total observed X-ray luminosity of the galaxies, of , is clearly dominated by the discrete X-ray sources. In fact, the diffuse emission contributes no more than to the observed X-ray luminosity in the 0.5 – 8 keV range. The discrete source population is dominated by the very brightest sources, with the brightest three sources contributing over half of the total observed flux.
The only previous X-ray study of NGC 4485/90 to separate out the discrete X-ray sources from a diffuse component was the ROSAT PSPC study of RPS97. They found a total 0.1 – 2 keV luminosity of for NGC 4490, with of the total flux originating in a diffuse component. This diffuse luminosity is well in excess of what we observe for the system, which is obviously in part due to the large number of additional sources we resolve in the system. However, a large part of the discrepancy may come from the more extensive diffuse emission component detected by RPS97 (see their Figure 13). It is possible that we do not detect this component due to a combination of its low surface brightness and a very soft intrinsic spectral form, the latter implying that it is mainly evident at energies below the nominal CHANDRA detector response. This “very soft” emission may represent a hot gas halo surrounding the galaxy pair.
6.2 The luminosity function of the discrete X-ray sources

With the advent of Chandra we are able to perform highly sensitive studies of the point source populations in a wide variety of nearby galaxies for the first time. Luminosity functions are an increasingly popular diagnostic of these X-ray source populations, as they provide an empirical, and readily comparable, view of the numbers and relative luminosities of sources within such systems. The luminosity function for the discrete X-ray source population of the NGC 4485/90 system is shown in Figure 8. We calculate this luminosity function by extrapolating our fluxes into the 0.3 – 8 keV band, allowing direct comparison with the various luminosity functions presented by Kilgard et al. (2002). The luminosities of the ULX were taken from their best fit spectral models; sources with count rates in the “medium” and “faint” flux regimes had their 0.3 – 10 keV count rates converted to 0.3 – 8 keV fluxes using the best fit model to the composite source spectrum in each flux regime (c.f. §4.1). The derived source luminosities cover a range of two orders of magnitude, from .
The slope of the luminosity function was determined to be using the maximum likelihood statistic of Crawford, Jauncey & Murdoch (1970). We note that this slope is not heavily dependent upon the spectral models used in calculating the count-rate to flux conversion: for instance, if we use a 5 keV thermal bremsstrahlung model with a Galactic line-of-sight column, we derive a fully-consistent slope of . There is a hint of a steepening in the luminosity function slope at the high luminosity end, at , though this cannot be interpreted as a significant break feature since only four data points lie beyond the putative break luminosity. We note that breaks in the luminosity functions of several other galaxies have been observed in Chandra observations (e.g. NGC 4697, Sarazin et al. 2000; NGC 1553, Blanton et al. 2001), where breaks at a few have been attributed to the transition between neutron star and black hole X-ray binaries. Another possibility is that the break energy is variable, and dependent upon the star formation history of the galaxy (Wu 2001; Kilgard et al. 2002). In the case of NGC 4485/90 the high luminosity of the possible break and the active star formation would favour the latter explanation, especially when it is considered that the assumed distance of the galaxies would have to be overestimated by a factor at least two to be consistent with a the putative break being at a few .
Kilgard et al. (2002) detail the difference in luminosity function slopes between different types of galaxies. In particular, there appears to be an evolution in the steepness of the luminosity function between starburst systems (which have relatively flat slopes, ), normal spiral galaxies (slope ) and early-type galaxies (slope ). Kilgard et al. show this slope is correlated with the 60m luminosity of each galaxy, which is a measure of the star formation activity in each galaxy. Hence, the luminosity function slope is related to the age of the stellar population in each system, with the young stellar populations in starburst galaxies showing a flatter slope as a direct consequence of hosting a relatively larger number of high luminosity X-ray binary systems (probably high-mass X-ray binaries) than older stellar populations. A similar conclusion is drawn by Tennant et al. (2001) in comparing the luminosity functions of the disk and bulge of M81. The luminosity function slope we derive for NGC 4485/90 places it firmly in the starburst regime; indeed, a value of is a close match to that of the Antennae. The relatively shallow luminosity function slope therefore implies that the NGC 4485/90 system hosts a young X-ray source population, similar to that observed in classical starburst systems.
An useful application of the derived luminosity function is to interpolate it below the minimum detected luminosity, in order to place limits on the contribution of an unresolved, faint source population to the the observed diffuse luminosity of the galaxies. Assuming the luminosity function slope remains unchanged below , we derive a total luminosity of for an unresolved X-ray source population. This compares to an observed diffuse X-ray luminosity of , implying the unresolved source population may contribute well over half the diffuse X-ray flux. However, we have shown in previous sections that this diffuse component appears predominantly thermal in nature. This apparent dichotomy may be explained if either the source population below is dominated by discrete thermal X-ray sources (i.e. supernova remnants), or if a further break is present in the luminosity function slope at or close to which results in a flattening of the slope at lower source luminosities.
6.3 NGC 4485/90 as an X-ray starburst system
There are many indications that NGC 4485/90 should be classified as a starburst system. For instance, RPS97 classify NGC 4490 as a starburst on the basis of its high LFIR/LB ratio () and its high FIR colour temperature (). Its current star formation rate is also similar to that of the prototypical galaxy merger starburst in the Antennae, which is M⊙ yr-1 (Stanford et al. 1990) (c.f. 5 M⊙ yr-1 in NGC 4490; Clemens, Alexander & Green 1999). It does not, however, show the classical X-ray characteristics of a compact starburst system such as M82 or NGC 253, with in particular no evidence of a Galactic-scale superwind emanating from the nucleus of NGC 4490 in X-ray observations (at best we see a diffuse X-ray halo that may be extended to the north of the galaxy; see §5).
| Galaxy | LFIR/LBa | LX,diffb | LX,srcc |
|---|---|---|---|
| NGC 4485/90 | 0.6 | 0.2 | 1.8 |
| Antennae | 0.8 | 3.8 | 4.6 |
| NGC 3256 | 10 |
| Notes: |
| a Based on FIR fluxes from Soifer et al. (1989), and blue |
| magnitudes from de Vaucouleurs et al. (1991). |
| b Diffuse X-ray luminosity in units of , |
| 0.5 - 8 keV. |
| c Combined source X-ray luminosity in units of , |
| 0.5 - 8 keV. |
We can attempt to place the X-ray characteristics of NGC 4485/90 derived from our Chandra observation in context by comparison with Chandra studies of other starbursting systems. This is unfortunately not yet possible for the prototypical starbursts in NGC 253 and M82, where initial Chandra studies have focussed only on specific facets of their nuclear regions (e.g. the ULX in M82, Kaaret et al. 2001; the nuclear outflow of NGC 253, Strickland et al. 2000). However, we can draw useful comparisons with the vigorous starbursts in the Antennae (NGC 4038/9) and NGC 3256 (Fabbiano, Zezas & Murray 2001; Lira et al. 2002), on the basis of the statistical study of the links between star formation activity and the X-ray properties of spiral galaxies derived by Read & Ponman (2001). They find that in starburst galaxies the luminosity of diffuse emission per unit mass scales closely with star forming activity (measured by FIR luminosity per unit mass), whereas in normal galaxies it scales with galaxy size. Although it is a less well-defined relationship, it also appears that the total source luminosity in starburst systems increases with activity, though at a slower rate than the diffuse luminosity. This implies that, in general, more active starbursts should have larger diffuse emission contributions to their overall luminosity. We show a comparison of the relative luminosity diagnostics for the three systems in Table 7. Both the Antennae and NGC 3256 are more active than NGC 4485/90 on the basis of the LFIR/LB criterion used by Read & Ponman (2001). They are also considerably more X-ray luminous, with overall luminosities of and (0.5 - 8 keV) respectively777We use a value of 75 km s-1 Mpc-1 here, as opposed to a value of 50 km s-1 Mpc-1 adopted by both Fabbiano et al. (2001) and Lira et al. (2002), and convert X-ray fluxes into the 0.5 - 8 keV band according to spectral models used by the respective authors.. Importantly, both systems display a far higher fraction of diffuse X-ray emission relative to the point-like source contribution, with and of the flux originating in a diffuse component in each case. This is, of course, consistent with the trends identified by Read & Ponman (2001), with the stark contrast in X-ray luminosities and diffuse fractions emphasizing that the Antennae, and in particular NGC 3256, are towards the high X-ray luminosity end of the starburst activity scale, in contrast to the relatively low activity of NGC 4485/90.
The comparison between the Antennae and NGC 4485/90 is particularly interesting given that they have many distinct similarities, such as the observed star formation rate, their LFIR/LB ratios and their identical X-ray source luminosity function slopes, but such disparate diffuse X-ray emission properties. Major differences exist between the systems in the type and the stage of interaction they are undergoing; in NGC 4485/90 we see the aftermath of a close prograde encounter between a (comparatively) large galaxy and its smaller companion, with the tidal disruption of both galaxies as a result, whereas in the Antennae we are witnessing the advanced stages of a direct merger between two similar-sized galaxies. This may suggest that it is not so much the star formation induced by the merger that powers the additional diffuse X-ray emission in the Antennae, but the merger itself, perhaps through processes such as the direct shock heating of the ISM in the merger. An alternative explanation for the difference in diffuse components may be the actual size of the galaxies; if we roughly scale the mass of each system to its blue luminosity (as per Read & Ponman 2001), then we expect the Antennae to be times more massive than NGC 4485/90. It will hence have a deeper gravitational potential well in which to retain the hot, diffuse gas. We note that this particular argument is espoused by Read & Ponman (2001) for “normal” galaxies in which more massive systems appear to have a higher diffuse gas content per unit mass. This effect may be accentuated in the case of NGC 4485/90 where the bulk of the current star formation appears to be occurring away from the centre of the system, where the hot gas will find it easier to escape the gravitational influence of the galaxies.
7 The relationship between ULX and star formation
In section 3.2 we detailed the characteristics of the six ULX we find in the Chandra observation of NGC 4485/90. All are found to be point-like at the Chandra spatial resolution of 0.5′′ ( pc in NGC 4485/90), meaning they are likely to be individual sources and not composite X-ray emitting regions. The best diagnostics of their nature come from their X-ray spectra and long-term lightcurves, which imply that five of the ULX have properties consistent with a black hole X-ray binary, whilst the sixth (CXOU J123029.5+413927) is probably an X-ray luminous supernova remnant. But why are so many ULX found in this relatively small galaxy pair?
Recent Chandra observations have revealed that very active star forming systems appear rich in ULX, for instance with the detection of 8 ULX in NGC 3256 and a further 12 in the Antennae (Lira et al. 2002; Fabbiano et al. 2001). ULX are detected in other starburst systems, notably the very luminous ULX close to the nucleus of M82 (Kaaret et al. 2001) and a similar near-nuclear source in NGC 3628 (Strickland et al. 2001). However, observations of galaxies with relatively low star formation rates tend to find few sources with luminosities in excess of , and none in the ULX regime, with perhaps the best example being our nearest major neighbour M31 (e.g. Supper et al. 2001). Furthermore, many ULX appear to be spatially coincident with the star formation regions in systems such as the Antennae (Fabbiano et al. 2001). In fact the first reported optical counterpart to a ULX is coincident with a young ( Myr old) stellar cluster in NGC 5204 (Roberts et al. 2001; Goad et al. 2002). This evidence points to a physical link between the presence of many ULX and active star formation.
The observation of NGC 4485/90 presented in this paper strongly supports this relationship. First and foremost we again detect a comparatively large number of ULX in a starbursting system. Furthermore, all the ULX are seen in or very close to regions of active star formation (c.f. Figure 1). Four are associated with the star formation ongoing in the tidally-disrupted spiral arms between the galaxies, a fifth is in the star forming regions close to the nucleus of NGC 4490, and the sixth is in the eastern spiral arm, at the base of the tidal tail. An additional important result is that we are able to show that the majority (5/6) of these ULX are probably black hole X-ray binary systems, meaning that, even in star forming environments, X-ray luminous supernova remnants provide only a small proportion of the ULX population.
It has been suggested that ULX may constitute a new population of M⊙ intermediate-mass black holes based upon their X-ray luminosities exceeding the Eddington luminosity for a 10 M⊙ black hole of (e.g. Colbert & Mushotzky 1999). However, the formation of such objects is problematic. One possible origin may be through the hierarchal merging of lower mass black holes within a dense stellar cluster (e.g. Taniguchi et al. 2000; Ebisuzaki et al. 2001), though this may only be applicable in the circumnuclear regions of galaxies where the potential well is deep enough to retain the newly-formed black holes within the clusters. It is also a long-timescale process, taking years. Elmegreen et al. (1998) estimate the ages of the stellar populations within distinct regions of the NGC 4485/90 system. The intermediate-mass black hole formation timescale is inconsistent with the age of the main stellar populations in both the spiral arms of NGC 4490 ( years) and the tidal tail of NGC 4485 ( years), where 4/5 of the putative black hole X-ray binary ULX are located, though it is closer to the age of the bulge of NGC 4490 ( years). A timescale of years is of course also inconsistent with the ULX being directly related to the ongoing star formation. We can therefore rule out this formation scenario for 4/5 of the black hole X-ray binary ULX, though we note that the near-nuclear ULX CXOU J123036.3+413837 may be a candidate intermediate-mass black hole formed in a dense cluster based on its position and the local stellar age; alternatively its presence may simply be related to the recent star formation in the nucleus.
A second method of forming intermediate-mass black holes is through the collapse of primordial Population III objects (Madau & Rees 2001). This would have left a numerous population of intermediate-mass black holes, many of which will have migrated to the centres of galaxies through the action of dynamical friction (and in many cases merged with the supermassive black hole). However, a number may still be present away from the galaxy nuclei. This origin for the ULX in NGC 4485/90 is also very unlikely, given that the ULX only appear coincident with the regions of recent star formation.
It therefore appears unlikely that at least four, if not all five, of the putative black hole X-ray binary ULX in NGC 4485/90 are intermediate-mass black hole systems. This leaves the most likely remaining alternative that they are ordinary stellar mass X-ray binary systems that are apparently radiating in excess of the Eddington luminosity. This is readily explained if the X-ray emission of the sources is anisotropic. King et al. (2001) suggest that this is indeed the case, with the X-ray emission of the ULX mildly beamed into our line-of-sight. Beaming, however, requires large numbers of potential sources because at any one time many more of the sources must exist than are seen along a single line-of-sight. King et al. (2001) resolve this problem by suggesting that ULX are “ordinary” black hole and/or neutron star high- and intermediate-mass X-ray binaries undergoing a thermal-timescale mass transfer epoch that is an inevitable stage of binary evolution. This in turn suggests a link to Galactic microquasars. The association of ULX with intense star formation activity is then readily explained by the relatively short lifetimes of the high-mass X-ray binary systems formed in large numbers in such an epoch.
The possible link between ULX and Galactic microquasars suggested by King et al. (2001) is also supported on the basis of ASCA spectroscopy (Makishima et al. 2000). Georganopoulos, Aharonian & Kirk (2002) expand upon this idea, advocating that ULX are consistent with microquasars with high stellar mass companions. In their model ULX are microquasars seen with the jet oriented close to our line-of-sight, and the low-hard state emission originates in Compton scattering of photons from the companion star or accretion disk by relativistic electrons in the jet. Further support for this model comes from Körding, Falcke & Markoff (2002), who find that a simple population synthesis model for beamed X-ray sources can adequately explain the observed populations of luminous X-ray sources in nearby galaxies.
Other solutions to the problem of producing apparently super-Eddington accretion onto a stellar-mass compact object are discussed by Grimm, Gilfanov & Sunyaev (2002). Most interestingly, they note that a combination of a face-on viewing aspect for the accretion disk and an unusual chemical composition of the secondary star (e.g. He-enriched) can combine to apparently exceed the Eddington luminosity by a factor . Given that the intrinsic luminosities of the NGC 4485/90 ULX lie only a factor above the Eddington luminosity for a 10 M⊙ black hole, then this is a very plausible explanation for their super-Eddington luminosities.
A final possible alternative to intermediate-mass black holes is that the accretion is literally a super-Eddington process. This has recently been proposed by Begelman (2002), who shows that a “thin” accretion disk in a radiation-pressure dominated (i.e. high accretion rate) regime can produce fluxes up to a factor 10 above the Eddington limit for a stellar-mass black hole X-ray binary. Similarly, the “slim disk” scenario (e.g. Abramowicz et al. 1988) is also predicted to produce super-Eddington fluxes that could account for ULX (Watarai, Mizuno & Mineshige 2001). The high inner-accretion disk temperatures observed by Makishima et al. (2000) and noted in this paper for the ULX in NGC 4485/90 are consistent with the stellar mass black holes inferred in both the above models.
8 Conclusions
In this paper we have analysed a 20 ks Chandra observation of the nearby, interacting galaxy pair NGC 4485/90. Our results may be summarised thus:
-
•
We detect a total of 31 discrete X-ray sources coincident with the galaxies (including a faint bridge linking the two), ranging in observed luminosity between and (0.5 - 8 keV). Only five had been detected in previous X-ray observations of the galaxies (RPS97; RW2000). No more than four of these detections are expected to be due to background contamination.
-
•
An analysis of the 0.3 – 2 keV vs 2 – 10 keV hardness ratios for the sources reveals a trend of spectral softening as the flux decreases. This is not a result of a new, soft source population appearing at lower fluxes (though we do identifying one candidate super-soft source), but rather the fact that the more luminous sources are more absorbed. This absorption may be intrinsic to the sources, or may be a result of their being located deeper within, or in denser regions of, the galaxies.
-
•
We identify six sources with luminosities in excess of , which are examples of the ultraluminous X-ray source phenomenon. All of these sources are point-like and none exhibit short-term X-ray variability. On the basis of their X-ray spectra and long-term lightcurves five of the ULX are likely to be black hole X-ray binary systems and the sixth, which is directly coincident with a radio source, is an X-ray luminous supernova remnant.
-
•
There is extensive diffuse X-ray emission associated with the disk of NGC 4490. A further patch is located in the southern regions of NGC 4485, probably as a result of the ram-pressure stripping of its ISM as it passes through the giant H I cloud surrounding NGC 4490. X-ray spectroscopy of the diffuse component shows it to be predominantly thermal in nature, consistent with an origin in the hot interstellar medium of the galaxies, and not in an unresolved source population.
-
•
The total observed X-ray luminosity of the NGC 4485/90 system is (0.5 - 8 keV). Over 90% of this is contributed by the luminous X-ray source population, with the three brightest sources contributing more than 50% between them. The luminosity function of the discrete X-ray source population shows a very flat slope () similar to that seen in classical starburst systems, implying that NGC 4485/90 hosts a young, luminous X-ray source population.
-
•
A comparison with the classic galaxy merger starbursts in the Antennae and NGC 3256 shows that the starburst in NGC 4485/90 is relatively X-ray weak, particularly in terms of its diffuse emission component. This is especially puzzling when compared to the Antennae, which has a similar activity level. This may be due to the type of interaction (direct merger versus tidal encounter), or the smaller gravitational potential well of NGC 4490 retaining less hot gas.
-
•
The high ULX content of NGC 4485/90, and the direct spatial coincidence of its ULX with star formation regions, is further convincing evidence of the relationship of many ULX with active star formation. We note that only one of the ULX is identifiable as a supernova remnant, implying that even in active star formation regions the ULX population is dominated by accreting sources.
-
•
It is unlikely that the putative black hole X-ray binary ULX in NGC 4485/90 contain intermediate-mass black holes, due to their extra-nuclear positions, the age of the stellar populations in their host regions, and their apparent relationship with the active star formation regions within the galaxies. There are a number of very plausible alternative explanations in terms of a simple high-mass X-ray binary nature for the ULX. It now seems credible that many ULX may be nothing more exotic than ordinary high-mass X-ray binary systems viewed in an epoch of unusually high accretion rate and/or with a preferred orientation.
The most remarkable feature of NGC 4485/90 in the X-ray regime is its highly luminous discrete X-ray source population, and in particular the six ULX it hosts. Indeed, NGC 4485/90 may present one of the best opportunities to study this phenomenon in the local universe, since other systems with similar numbers of ULX (e.g. the Antennae and NGC 3256) are over a factor 2.5 more distant, and dominated by potentially-confusing extensive hot gas components. A better understanding of the phenomenology of this interesting class of sources may therefore rely upon future studies of the ULX in NGC 4485/90.
ACKNOWLEDGMENTS
We thank the referee, Andy Read, for his many useful comments that have improved this paper. TPR gratefully acknowledges financial support from PPARC. This paper uses DSS-2 data extracted from the ESO online digitised sky survey. The archival ROSAT data were obtained from the Leicester database and archive service (LEDAS) at the University of Leicester.
References
- [] Abramowicz M.A., Czerby B., Lasota J.P., Szuszkiewicz E., 1988, ApJ, 332, 646
- [] Begelman M., 2002, ApJ, 568, L97
- [] Blanton E.L., Sarazin C.L., Irwin J.A., 2001, ApJ, 552, 106
- [] Chandra Proposer’s Observatory Guide, Version 3.0, December 2000, Chandra X-ray Center, Cambridge, Mass., USA
- [] Chevalier R.A., Fransson C., ApJ, 1994, 420, 268
- [] Ciliegi P., Elvis M., Wilkes B.J., Boyle B.J., McMahon R.G., 1997, MNRAS, 284, 401
- [] Clemens M.S., Alexander P., Green D.A., 1998, MNRAS, 297, 1015
- [] Clemens M.S., Alexander P., Green D.A., 1999, MNRAS, 307, 481
- [] Clemens M.S., Alexander P., Green D.A., 2000, MNRAS, 312, 236
- [] Colbert E.J.M., Mushotzky R.F., 1999, ApJ, 519, 89
- [] Crawford D.F., Jauncey D.L., Murdoch H.S., 1970, ApJ, 162, 405
- [] Dahlem M., Weaver K., Heckman T., 1998, ApJS, 118, 401
- [] de Vaucouleurs G., de Vaucouleurs A., Corwin H.G. Jr., 1976, Second reference catalogue of bright galaxies (Austin: University of Texas Press)
- [] de Vaucouleurs G., de Vaucouleurs A., Corwin H.G. Jr., Buta R.J., Paturel G., Fouqué P., 1991, Third reference catalogue of bright galaxies (New York: Springer)
- [] Duval M.F., 1981, A&A, 98, 1981
- [] Ebisuzaki T., et al., 2001, ApJ, 562, L19
- [] Elmegreen D.M., Chromey F.R., Knowles B.D., Wittenmyer R.A., 1998, AJ, 115, 1433
- [] Fabbiano G., Zezas A., Murray S.S., 2001, ApJ, 554, 1035
- [] Fabian A.C., Terlevich R., 1996, MNRAS, 280, L5
- [] Falco E., Kurtz M., Gellar M., Huchra J., Peters J., Berlind P., Mink D., Tokarz S., Elwell B., 1999, PASP, 111, 438
- [] Georganopoulos M., Aharonian F.A., Kirk J.G., 2002, A&A, 388, L25
- [] Giacconi R., Rosati P., Tozzi P., Nonino M., Hasinger G., Norman C., Bergeron J., Borgani S., Gilli R., Gilmozzi R., Zheng W., 2001, ApJ, 551, 624
- [] Goad M.R., Roberts T.P., Knigge C., Lira P., 2002, MNRAS, in press
- [] Greiner J., 2000, New A, 5, 137
- [] Grimm H.-J., Gilfanov M., Sunyaev R., 2002, A&A, in press
- [] Irwin J.A., Sarazin C.L., Bregman J.N., 2001, ApJ, 570, 152
- [] Kaaret P., Prestwich A., Zezas A., Murray S., Kim D.-W., Kilgard R., Schlegel E., Ward M., 2001, MNRAS, 321, L29
- [] Kilgard R.E., Kaaret P., Krauss M.I., Prestwich A.H., Raley M.T., Zezas A., 2002, ApJ, 573, 138
- [] King A., Davies M.B., Ward M.J., Fabbiano G., Elvis M., 2001, ApJ, 552, L109
- [] Klein U., 1983, A&A, 121, 150
- [] Körding E., Falcke H., Markoff S., 2002, A&A, 382, L13
- [] Lira P., Ward M.J., Zezas A., Alonso-Herrero A., Ueno S., 2002, MNRAS, 330, 259
- [] Madau P., Rees M.J., 2001, ApJ, 551, L27
- [] Makishima K. et al., 2000, ApJ, 535, 632
- [] Matsumoto H. et al., 2001, ApJ, 547, L25
- [] Mewe R., Kaastra J.S., Liedahl D.A., 1995, Legacy 6, 16
- [] Mitsuda K., et al., 1984, PASJ, 36, 741
- [] Pence W.D., Snowden S.L., Mukai K., Kuntz K.D., 2001, ApJ, 561, 189
- [] Ptak A., Serlemitsos P., Yaqoob T., Mushotzky R., 1999, ApJS, 120, 179
- [] Read A.M., Ponman T.J., Strickland D.K., 1997, MNRAS, 286, 626 (RPS97)
- [] Read A.M., Ponman T.J., 2001, MNRAS, 328, 127
- [] Roberts T.P., Goad M.R., Ward M.J., Warwick R.S., O’Brien P.T., Lira P., Hands A.D.P., 2001, MNRAS, 325, L7
- [] Roberts T.P., Warwick R.S., 2000, MNRAS, 315, 98 (RW2000)
- [] Sarazin C.L., Irwin J.A., Bregman J.N., 2000, ApJ, 544, L101
- [] Schlegel E.M., 1995, Rep. Prog. Phys., 11, 1375
- [] Soifer B.T., Boehmer L., Neugebauer G., Sanders D.B., 1989, AJ, 98, 766
- [] Stanford S.A., Sargent A.I., Sanders D.B., Scoville N.Z., 1990, ApJ, 349, 492
- [] Stark A., Gammie C.F., Wilson R.W., Bally J., Linke R.A., Heiles C., Hurwitz M., 1992, ApJS, 79, 77
- [] Strickland D.K., Colbert E.J.M, Heckman T.M., Weaver K.A., Dahlem M., Stevens I.R., 2001, ApJ, 560, 707
- [] Strickland D.K., Heckman T.M., Weaver K.A., Dahlem M., 2000, AJ, 120, 2965
- [] Supper R., Hasinger G., Lewin W.H.G., Magnier E.A., van Paradijs J., Pietsch W., Read A.M., Tr mper J., 2001, A&A, 373, 63
- [] Taniguchi Y., Shioya Y., Tsuru T.G., Ikeuchi S., 2000, PASJ, 52, 533
- [] Tennant A.F., Wu K., Ghosh K.K., Kolodziejczak J.J., Swartz D.A., 2001, ApJ, 549, L43
- [] Thronson H.A. Jr., Hunter D.A., Casey S., Latter W.B., Harper D.A., 1989, ApJ, 339, 803
- [] Tully R.B., 1988, Catalog of Nearby Galaxies, Cambridge University Press
- [] Van den Heuval E.P.J., Bhattacharya D., Nomoto K., Rappaport S.A., 1992, A&A, 262, 97
- [] Viallefond F., Allen R.J., de Boer J.A., 1980, A&A, 82, 207
- [] Watarai K., Mizuno T., Mineshige S., 2001, ApJ, 549, L77
- [] Wu, K., 2001, PASA, 18, 443