Abstract
The Chandra AO1 HETGS observation of the micro-quasar GRS 1915+105 in
the low hard state reveals (1) neutral K absorption edges from Fe, Si,
Mg, and S in cold gas, and (2) highly
ionized (Fe xxv and Fe xxvi) absorption attributed to a hot disk, disk
wind, or corona. The neutral edges reveal anomalous Si and Fe
abundances which we attribute to surrounding cold material in/near the
environment of GRS 1915+105. We also
point out the exciting possibility for the first astrophysical detection
of XAFS attributed to material in interstellar grains.
We place constraints on the ionization parameter, temperature,
and hydrogen equivalent number density of the absorber
near the accretion disk based on the detection of the H- and
He-like Fe absorption. Observed spectral changes in the ionized lines
which track the light curve point to changes in
both the ionizing flux and density of the absorber, supporting the
presence of a flow.
Details can be found in Lee et al., 2002, ApJ., 567, 1102 [Lee et al.(2002)].
1 Introduction and Observations
The Chandra High Energy Transmission Grating (HETGS) and RXTE Proportional Counter Array (PCA) observed GRS 1915+105 in the low hard state on 2000 April 24 (MJD: 51658.06654, orbital phase zero [Greiner, Cuby, & McCaughrean(2001)]) for 31.4 ks. The absolute absorption corrected luminosity erg s-1 . The Greenbank Interferometer radio observations on 2000 April 24.54 indicate a flux of mJy at 2.25 GHz, which is consistent with the presence of a steady jet.
![[Uncaptioned image]](/html/astro-ph/0208187/assets/x3.png)
Figure 2. A possible picture of GRS 1915+105 near the black hole, as inferred from the Chandra spectra. For our calculations (§3), we assume that the volume filling factor must be small (e.g. ) in order that not change over the region.
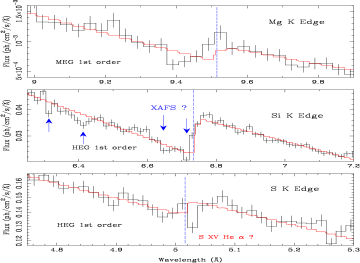
2 Surrounding cold material, XAFS and dust
We detect prominent K-shell absorption edges of Fe, S, Si, and Mg (Fig. 1). The equivalent Hydrogen column densities from Mg and S (assuming solar abundances) are consistent with the value expected from neutral line-of-sight absorption. This is contrasted with the value derived from Fe and Si, indicating anomalous abundances, that is likely associated with the environment of GRS 1915+105. However, the possibility for unusual line-of-sight abundances cannot currently be ruled out.
We additionally report the exciting possibility for the first astrophysical detection of XAFS (X-ray Absorption Fine Structure), which is most notable in the Si edge. If confirmed, such a positive detection of the details of absorption by material in solids (e.g. interstellar grains) will have important consequences for (the beginning of) solid state astrophysics, by which grain properties can be extracted via the solid’s inner compound structure.
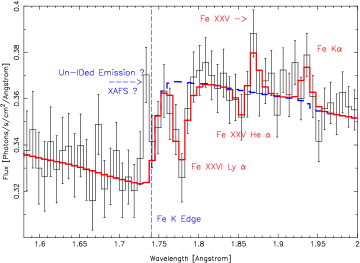
3 The ionized features from the accretion disk atmosphere
In addition to the neutral edges, the presence of highly ionized material can be surmised from the detection of H– and He–like Fe xxvi and Fe xxv resonant absorption and possibly emission. Assuming photoionization and a power law ionizing spectrum, we calculate lower limits for the plasma conditions (i.e. ionization parameter , temperature, and equivalent hydrogen column in that region) using the ratio of the ionic column densities of Fe xxvi () to Fe xxv () :
Using these results and the relationship between the luminosity L and , we can estimate an upper limit for the distance to the absorber and a lower limit to the hydrogen equivalent number density (see Fig. 2 for illustration).
4 Outflowing material and variability
It is plausible that the ionized absorber (at ) responsible for the H- and He-like Fe lines is associated with material flowing out from the X-ray source (e.g. wind), which we can compare with the accretion rate. We posit a velocity for the calculation of the (spherical) mass outflow rate :
| (1) |
where is the characteristic radius, solid angle subtended by the outflow, and the density of the absorbing material is the product of the proton mass and the number density of the electrons in the absorber. This can be contrasted with
| (2) |
where the efficiency and the lower limit on the bolometric luminosity is used. Such a comparison for shows that as the covering fraction (i.e. ) approaches unity, the dynamics can be such that the material being accreted is re-released in some kind of flow.

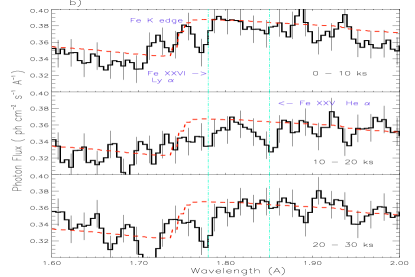
This possibility for a (slow) outflow is supported by variability results. (1) The RXTE data show that the most significant variations occur in the disk blackbody component which supports an accretion disk origin for the ionized lines (Fig. 3a). (2) These variations appear to be correlated with the spectral behavior seen in the temporal subsets of the Chandra data, which show that the ionized lines evolve on ks timescales (Fig. 3b). In particular, the Fe xxv absorption (Fig. 3b, second panel) is more pronounced during the dip in the light curve (Fig. 3a, panels 1 & 2), which is also correlated with the notable diminution of the disk flux (Fig. 3b, panel 3). In contrast, Fe xxvi dominates during the brightest periods of our observation. Additionally, we note that an 20% change in the flux at these ionizations implies an 30% change in the ionization fraction of Fe xxv (assuming that scales with the ionizing flux, while and remain constant). This is not sufficient to explain the lack of Fe xxv absorption, and dominance of Fe xxvi absorption during the periods when the count rate is high, indicating that the ionizing flux is only part of the solution, and changing density the other factor. For the values of cm and flow velocity discussed earlier, it is plausible that the observed spectral variability can be attributed to a flow which can change on timescales of 10 ks. This is not inconceivable since 10 ks is a very long time, corresponding to many dynamical timescales of the relevant parts of the disk, in the life of a source like GRS 1915+105. Furthermore, since this source accretes near its Eddington limit, one would expect the mass flow rate and wind density to be strong functions of the luminosity, such that the actual structure of the wind (i.e. density and size) can change as a function of the luminosity.
5 Summary
The Chandra HETGS and simultaneous RXTE PCA observations of GRS 1915+105 during the
low hard state reveal :
Cold material with anomalous Fe and Si abundances :
There is a possibility that these abundance excesses may be related to
material that is associated with the immediate environment of GRS 1915+105.
See also similar suggestions from IR studies ([Mirabel et al.(1996)],[Martí, Mirabel, Chaty, & Rodríguez(2000)]).
Abundance anomalies (of the lighter -process elements such as
sulfur and oxygen) have also been reported from optical
spectra of the companion stars of the other microquasars
GRO J1655–40 and V4641 Sgr ([Israelian et al.(1999)],[Brown et al.(2000)],[Orosz et al.(2001)]).
Hot material from the accretion disk
atmosphere/wind/corona is detected in the form of highly ionized
H- and He-like Fe lines.
Flow : The possibility for the presence of
a slow flow is suggested by variability studies.
Dust : If confirmed, the detection of XAFS
will have important implications for directly probing the structure and
chemical composition of interstellar grains.
Acknowledgements
This work was funded by the Chandra grant GO 0-1103X. JCL also acknowledge support from the NASA contract NAS 8-01129.
References
- Lee et al.(2002). Lee, J. C. et al. , 2002 ApJ, 567, 1102
- Greiner, Cuby, & McCaughrean(2001). Greiner, J. et al. , 2001, Nature, 414, 522
- Mirabel et al.(1996). Mirabel, I. F. et al. , 1996, ApJ, 472, L111
- Martí, Mirabel, Chaty, & Rodríguez(2000). Martí, J. et al. , 2000, A&A, 356, 943
- Israelian et al.(1999). Israelian, G. et al. , Nature, 401, 142
- Brown et al.(2000). Brown, G. E. et al. , 2000, New Astronomy, 5, 191
- Orosz et al.(2001). Orosz, J. A. et al. , 2001, ApJ., 555, 489