Dusty Rings: Signposts of Recent Planet Formation
Abstract
Many nearby stars are surrounded by a bright ring or disk of cold dust. Our calculations show that these disks and rings of dust are signposts of recent planet formation. Bright rings appear because dust associated with the formation of a planet absorbs and scatters light from the central star. The calculations explain the rings observed so far and predict that all nascent solar systems have dusty rings.
1 INTRODUCTION
Every planetary system forms from a thin disk of gas and dust in orbit around a young star. In the planetesimal theory, planets grow from collisions and mergers of smaller bodies, planetesimals, embedded in the disk. Protoplanets with radii of 100 km or more stir up the remaining planetesimals along their orbits. A cascade of collisions among rapidly moving planetesimals produces a ring of dust grains, which slowly disappears as protoplanets grow into planets. This entire process can lead to a solar system similar to our own (Lissauer, 1993; Mannings, Boss, & Russell, 2000).
Recent observations support this general picture. The dusty disks around many nearby stars are as large or larger than our solar system (Koerner, 2001; Weinberger et al., 2002). The dusty ring around the nearby 10 Myr old star, HR 4796A, has a thickness of 15 AU and lies 70 AU from its central star (Jayawardhana et al., 1998; Koerner et al., 1998; Schneider et al., 1999; Greaves, Mannings, & Holland, 2000; Telesco et al., 2000). The rings or partial rings around Eridani, Vega, and other older stars have similar dimensions (Dent et al., 2000; Koerner, Sargent, & Ostroff, 2002; Wilner et al., 2002).
There have been few detailed numerical calculations of planet formation for comparison with these modern observations. Some calculations explore the early stages of planetesimal growth in a small range of disk radii (Greenberg et al., 1984; Wetherill & Stewart, 1993). These models follow the development of a single large planet, typically the Earth or Jupiter. Others use -body simulations to investigate the last stages of planet formation, when large bodies coalesce to form a few planets (Lissauer et al., 1996; Levison, Lissauer, & Duncan, 1998; Chambers, 2001).
To simulate the formation of an entire planetary system, the calculation must span a large range of disk radii. Extending the calculations over a large fraction of the disk allows simulation of the diversity of observable phenomena in extrasolar planetary systems. Supercomputers now allow such multiannulus planetesimal calculations covering a decade or more in disk radius (Spaute et al., 1991; Weidenschilling et al., 1997; Kortenkamp, Wetherill, & Inaba, 2001). The multiannulus calculations we discuss predict the behavior of a planet-forming disk during the early and intermediate stages of planet formation. The models yield images for comparison with observations of disks around nearby stars.
2 THE MODEL
To calculate planet growth, we adopt the Safronov (1969) formalism, which treats planetesimals as a statistical ensemble of bodies with a distribution of masses and velocities orbiting a central star. Because direct orbit integrations of 1020 or more planetesimals are not possible, this statistical approach is essential. As long as planetesimals are numerous and gravitational interactions are small, statistical calculations reproduce the results of direct orbit calculations (Kokubo & Ida, 2000).
To evolve the mass and velocity distributions in time, we solve the coagulation and Fokker-Planck equations for bodies undergoing inelastic collisions, drag forces, and long-range gravitational forces (Kenyon & Bromley, 2002; Weidenschilling et al., 1997). We approximate collision rates as , where is the number density, is the geometric cross-section, is the relative velocity, and is the gravitational focusing factor. For small planetesimals with radii 1–10 km, = 1. For larger planetesimals, the gravitational cross-section exceeds the geometric cross-section and 1. We use the ratio of the center-of-mass collision energy to the sum of the tensile strength and the gravitational binding energy of the merged pair to assign collision outcomes. Collisions with 1 produce mergers with little dust; 1 yields mergers with dust; 1 yields only dust. This algorithm matches data for simulated laboratory collisions and observations of the asteroid belt in our solar system (Davis et al., 1985; Davis, Ryan, & Farinella, 1994). We then compute velocity changes from gas drag, dynamical friction and viscous stirring (Kenyon & Bromley, 2002; Ohtsuki, Stewart, & Ida, 2002). Dynamical friction transfers kinetic energy from large bodies to small bodies and drives a system to energy equipartition. Viscous stirring transfers angular momentum between bodies and increases the velocities of all planetesimals.
Our numerical calculations begin with 1–1000 m planetesimals in 64 concentric annuli at distances of 30–150 AU from a 3 star. The total mass in planetesimals is . We divide the initial continuous mass distribution of planetesimals into a differential mass distribution of 30 mass batches with spacing = 2 between successive mass batches. We add mass batches as planetesimals grow in mass. Each planetesimal batch begins with a nearly circular orbit with eccentricity and inclination .
3 RESULTS
Figures 1–3 summarize results for a model with = 100 (1 = g is the mass of the Earth) and = . This initial mass is appropriate for the ‘minimum mass solar nebula,’ the minimum amount of solid material needed for the planets in our solar system (Hayashi, 1981; Weidenschilling, 1977). The adopted is a reasonable equilibrium value for 1–1000 m objects. This model assumes icy bodies with a mass density, = 1.5 g cm-3, and a tensile strength comparable to terrestrial snow, erg g-1. These parameters are similar to those adopted for calculations of planet formation in the Kuiper Belt of our solar system (Kenyon, 2002).
We separate the growth of planetesimals into three stages. When planetesimals are small, they have small geometric cross-sections and slow growth rates. This slow growth erases the initial conditions, including and the initial mass distribution. Slow growth ends when the gravitational cross-sections of the largest objects exceed their geometric cross-sections. This ‘gravitational focusing’ enhances collision rates by a factor of 100–1000. A few of the largest objects begin ‘runaway growth’; their radii grow rapidly from 10 km to 300 km. During the runaway, dynamical friction and viscous stirring increase the eccentricities of the 1 m to 1 km radius bodies from to . Collisions between these objects then begin to produce substantial amounts of dust. Gravitational focusing factors diminish and runaway growth ends. As the largest bodies grow slowly to 1000–3000 km sizes, they continue to stir up the smaller bodies and produce more and more dust. Eventually, nearly all of the small bodies are gone and dust production slows down. Radiation pressure from the central star removes 1 m dust grains; Poynting-Robertson drag pulls 1–100 m dust grains into the central star. These processes remove dust on short timescales, 10 Myr or less (Artymowicz, Burrows, & Paresce, 1989; Backman, Dasgupta, & Stencel, 1995).
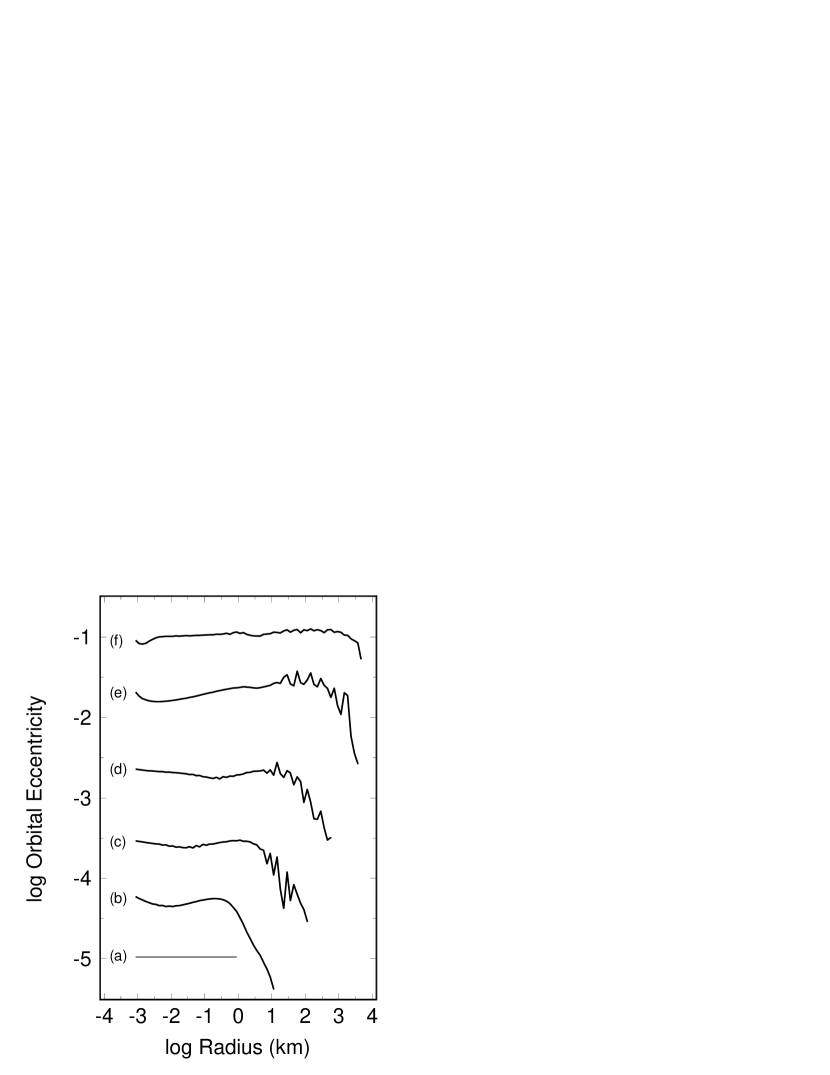
Figure 1 shows the evolution of the eccentricities of planetesimals at the inner edge of the disk (30–36 AU). All bodies begin with the same eccentricity. As objects grow from 1 km to 1000 km, dynamical friction maintains a roughly power law eccentricity distribution for the largest bodies. Viscous stirring steadily increases the eccentricities of the smallest bodies. When 0.01, collisions between small bodies begin to produce dust. Continued stirring yields larger and more dust, until the small bodies are gone. The amount of dust then steadily decreases with time.
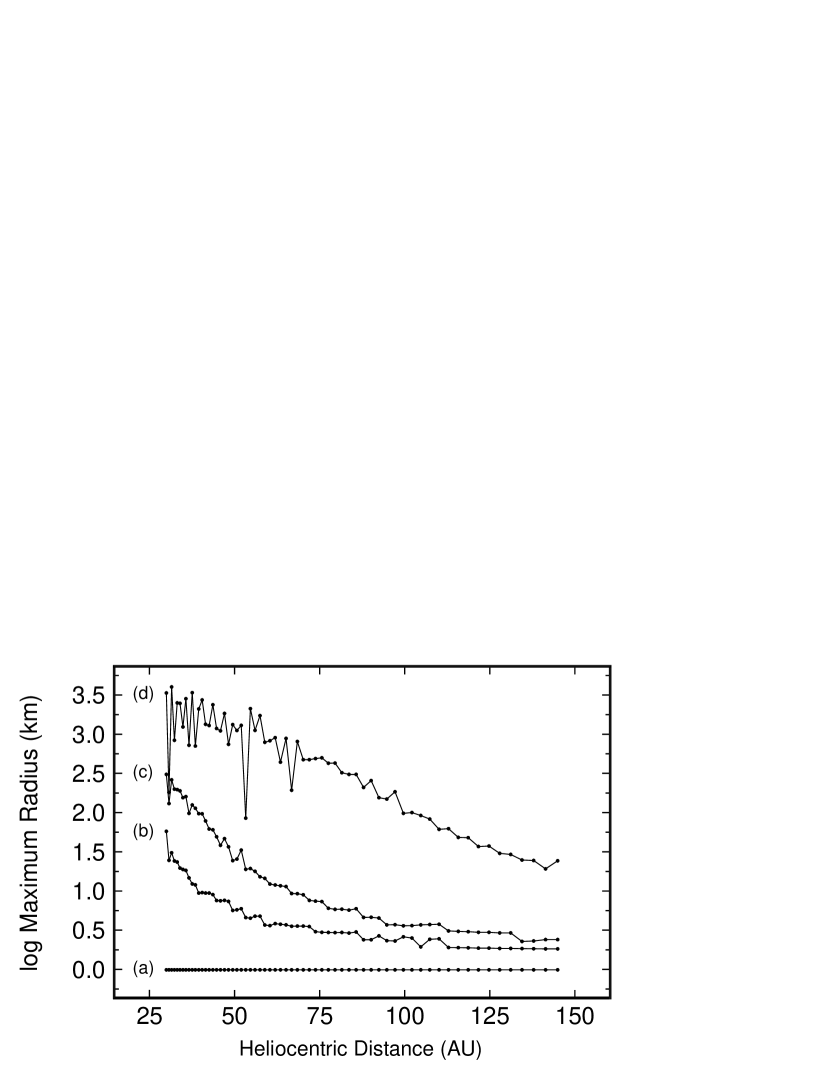
Figure 2 shows snapshots of the time evolution of the largest object in each annulus. For most of the evolution, the growth timescale for planetesimals is roughly where is the orbital period for heliocentric distance and is the surface density of planetesimals (Lissauer, 1987). Planetesimals thus grow first at the inner edge of the disk. It takes less than 1 Myr to produce 10 km bodies in the inner disk (30 AU) and 100 Myr to produce 10 km bodies in the outer disk (150 AU). Runaway growth leads to rapid production of 100–300 km bodies on timescales of 5 Myr in the inner disk and 100–200 Myr in the outer disk. A second slow growth phase produces objects ranging in size from Pluto (1000 km radius) to Jupiter’s moon Ganymede ( 2500–3000 km radius). It takes 20–30 Myr to produce these objects in the inner disk and close to 2 Gyr to make large objects in the outer disk.
To visualize dust formation in a planet-forming disk, we use the geometric optics limit to derive the optical depth of particles in the grid (Kenyon et al., 1999). For each object with radius and space density in a single annulus of width , the optical depth is . We derive for each annulus as the sum of over all objects. The relative brightness of each annulus is then proportional to the solid angle of each annulus on the sky as seen from the central star, = , where is the scale height of the dust in annulus . This result assumes 0.1 at all wavelengths, which we verify for each timestep. The brightness per unit surface area of the disk follows from and the surface area of each annulus, . The total luminosity is the sum of for all annuli, , where is the brightness of the disk relative to the brightness of the central star.
Figure 3 shows nine snapshots of the disk viewed along the rotational axis. In each image, the bright point in the center is the star. The sequence begins with a faint disk in the upper left corner at = 0. From = 0 to = 1 Myr, the inner disk fades slightly as planetesimals grow from 1 km to 30–50 km. By = 3 Myr, the largest objects have radii of 200–300 km. Collisions between the smallest objects produce modest amounts of dust; the inner disk brightens. In the middle panels, the inner disk brightens dramatically as collisions between the smallest objects produce more and more dust. Outer regions of the disk fade and then begin to brighten as large objects begin to form and stir up smaller objects. The contrast in brightness between the bright ring (shown in blue) and the rest of the disk is a factor of 30–100, making it readily observable. In the lower panels, the bright ring moves outwards. Throughout the expansion, this ring often contains narrow dark gaps that are local minima in the dust production rate. Dust disappears in the inner disk; collisions produce more dust in the outer disk. By = 2.5 Gyr, the bright ring reaches the outer boundary of the disk and the entire disk starts to fade and becomes unobservable (Habing et al., 2001; Spangler et al., 2001).
In the animation of Figure 3 included in the electronic version of the paper, planet formation appears as a set of three waves propagating outward through the disk. 111This animation and an animation for Figure 4 are also available at http://cfa-www.harvard.edu/ kenyon/pf/sp/movies.html. Slow growth from 1 km to 100 km produces a dark wave that lowers the brightness of the disk. Dust formed during runaway growth produces a bright wave that appears as a series of bright, narrow, concentric rings in the disk. The disk is brightest at 100 Myr, when . Finally, the disappearance of the dust grains yields a second dark wave that signals the last phases of planet formation in the disk. During this last phase, large bodies remaining in the disk will coalesce and form planets.
To test the robustness of these results, we calculated a series of models with a variety of initial conditions. We changed the initial eccentricity , mass density and tensile strength of the bodies, and the total mass in the planetesimals. Most of these parameters change the timescale but do not change the character of the evolution (Wetherill & Stewart, 1989; Kenyon & Luu, 1999b). Because gravitational focusing is less effective at larger planetesimal velocities, larger initial eccentricities, , delay runaway growth and slow the progress of the bright wave through the disk. The delay is roughly . Planetesimals with smaller mass densities have larger cross-sections and thus grow faster. A larger initial mass in planetesimals increases the collision rate and shortens the evolution time. The evolution time is inversely proportional to the initial mass, , and to the planetesimal mass density, . Finally, changes in the tensile strength affect the growth time and the final mass of planetesimals. Weaker bodies with erg g-1 produce more dust in each collision and disrupt at smaller collision velocities. More dust during linear growth enhances dynamical friction and shortens the timescale to runaway growth. More dust after runaway growth speeds the exhaustion of smaller bodies and limits the growth of the largest bodies. For = to erg g-1, the net change in evolution time is 10% to 30%. The variation in the size of the largest object is .
The evolution is more sensitive to stochastic processes. During runaway growth, random fluctuations in the collision rate can produce a single large body which grows much more rapidly than anything around it. By robbing other bodies of material, this runaway body slows the growth of large objects nearby. Stirring by the runaway object leads to more dust on shorter timescales. These runaways always produce bright dust rings.
To illustrate this process, Figure 4 shows disk snapshots for a model with = 100 , = , and = erg g-1. The electronic version of the paper contains an animation of the surface brightness evolution. For 1 Myr, this model follows the evolution of the model in Figure 3. At 1 Myr, single runaway bodies in two adjacent annuli begin to grow much more rapidly than anything else. They grow to 1000 km in 3 Myr. Stirring by these runaway bodies produces copious amounts of dust, which we see as two bright rings at 36 AU and at 40 AU. For = 10–100 Myr, collisions in the inner disk exhaust the supply of small bodies. At 100 Myr, a fluctuation produces another runaway body at 100 AU. Its rapid growth produces another bright dust ring outside the growing inner ring. As collisions deplete small bodies in the inner disk and begin to fragment small bodies in the outer disk, both of these rings and several fainter and narrower rings propagate outward through the disk.
4 SUMMARY
In our calculations, multiple rings tend to form when planets grow rapidly. Rapid growth occurs when the mass density of colliding bodies is small and when the total mass in planetesimals is large. Bodies with low tensile strength also promote rapid growth and multiple ring production. Calculations with erg g-1 produce multiple rings more often than do calculations with erg g-1. Multiple ring production is insensitive to , the initial mass distribution, and other initial conditions.
Our calculations demonstrate that planet formation produces copious amounts of dust. The dust production rate ranges from g yr-1 to g yr-1. This dust absorbs and reradiates stellar energy with a relative luminosity of to , comparable to observed luminosities for dusty disks surrounding nearby stars (Habing et al., 2001; Spangler et al., 2001). Our dust formation timescales of 10–100 Myr are comparable to the ages of nearby stars with dusty disks (Habing et al., 2001; Song et al., 2000; Spangler et al., 2001). Dust first forms in large quantities when the largest bodies reach sizes of 1000 km. Dust disappears when disruptive collisions exhaust the supply of 1 km bodies and radiative processes remove dust from the ring. Thus, dust is concentrated in concentric rings which propagate outward through the disk as a function of time. The outer edge of each ring marks the location where 1000 km objects are just starting to form; the inner edge marks the location where collisions have exhausted the supply of 1 km bodies and dust has disappeared. Thus, dusty rings are signposts for recent formation of 1000 km or larger planets surrounding a star.
We acknowledge a generous allotment, 500 cpu days, of computer time on the Silicon Graphics Origin-2000 ‘Alhena’ at the Jet Propulsion Laboratory through funding from the NASA Offices of Mission to Planet Earth, Aeronautics, and Space Science. Advice and comments from J. Brauman and M. Geller greatly improved our presentation. R. Mackey of the JPL supercomputing group assisted with the animations of Figure 3 and Figure 4.
References
- Artymowicz, Burrows, & Paresce (1989) Artymowicz, P., Burrows, C., & Paresce, F. 1989, ApJ, 337, 494
- Backman, Dasgupta, & Stencel (1995) Backman, D. E., Dasgupta, A., & Stencel, R. E. 1995, ApJ, 450, L35
- Chambers (2001) Chambers, J. E. 2001, Icarus, 152, 205
- Davis et al. (1985) Davis, D. R., Chapman, C. R., Weidenschilling, S. J., & Greenberg, R. 1985, Icarus, 62, 30
- Davis, Ryan, & Farinella (1994) Davis, D. R., Ryan, E. V., & Farinella, P. 1994, Planet. Space Sci., 42, 599
- Dent et al. (2000) Dent, W. R. F., Walker, H. J., Holland, W. S., & Greaves, J. S. 2000, MNRAS, 314, 702
- Greaves, Mannings, & Holland (2000) Greaves J. S., Mannings V. & Holland, W. S. 2000b, Icarus, 143, 155
- Greenberg et al. (1984) Greenberg, R., Weidenschilling, S. J., Chapman, C. R., & Davis, D. R. 1984, Icarus, 59, 87
- Habing et al. (2001) Habing, H. J., et al. 2001, A&A, 365, 545
- Hayashi (1981) Hayashi, C. 1981, Prog Theor Phys Suppl, 70, 35
- Jayawardhana et al. (1998) Jayawardhana, R. et al. 1998, ApJ, 503, L79
- Kenyon (2002) Kenyon, S. J. 2002, PASP, 114, 265
- Kenyon & Bromley (2002) Kenyon, S. J., & Bromley, B. C., 2002, AJ, 123, 1757
- Kenyon & Luu (1999a) Kenyon, S. J., & Luu, J. X. 1999a, AJ, 118, 1101
- Kenyon & Luu (1999b) Kenyon, S. J., & Luu, J. X. 1999b, ApJ, 526, 465
- Kenyon et al. (1999) Kenyon, S. J., Wood, K., Whitney, B. A., & Wolff, M. 1999, ApJ, 524, L119
- Koerner (2001) Koerner, D. W. 2001, in The 4th Teton Summer School Conference: Galactic Structure, Stars, and the Interstellar Medium, edited by C. W. Woodward, M. Bicay, J. M. Shull, San Francisco, ASP Press, p. 563
- Koerner et al. (1998) Koerner, D. W., Ressler, M. E., Werner, M. W., & Backman, D. E. 1998, ApJ, 503, L83
- Koerner, Sargent, & Ostroff (2002) Koerner, D. W., Sargent, A. I., & Ostroff, N. A. ApJ, in press
- Kokubo & Ida (2000) Kokubo, E., & Ida, S. 2000, Icarus, 143, 15
- Kortenkamp, Wetherill, & Inaba (2001) Kortenkamp,, S. J., Wetherill, G. W., & Inaba, S. 2001, Sci, 293, 1127
- Levison, Lissauer, & Duncan (1998) Levison, H. F., Lissauer, J. J., & Duncan, M. J. 1998, AJ, 116, 1998
- Lissauer (1987) Lissauer, J. J. 1987, Icarus, 69, 249
- Lissauer (1993) Lissauer, J. J. 1993, ARA&A, 31, 129
- Lissauer et al. (1996) Lissauer, J. J., Pollack, J. B., Wetherill, G. W., & Stevenson, D. J. 1996, in Neptune and Triton, ed. D. P. Cruikshank, M. S. Matthews, & A. M. Schumann, Tucson, Univ. of Arizona Press, p. 37
- Mannings, Boss, & Russell (2000) Mannings, V., Boss, A. P., & Russell, S. S. 2000, Protostars & Planets IV, Tucson, Univ. of Arizona Press
- Ohtsuki, Stewart, & Ida (2002) Ohtsuki, K., Stewart, G. R., & Ida, S. 2002, Icarus, 155, 436
- Safronov (1969) Safronov, V. S. 1969, Evolution of the Protoplanetary Cloud and Formation of the Earth and Planets, Nauka, Moscow [Translation 1972, NASA TT F-677]
- Schneider et al. (1999) Schneider, G., et al. 1999, ApJ, 513, L127
- Song et al. (2000) Song, I., Caillault, J.-P., Barrado y Navascués, D., Stauffer, J. R., & Randich, S. 2000, ApJ, 533, L41
- Spangler et al. (2001) Spangler, C., Sargent, A. I., Silverstone, M. D., Becklin, E. E., & Zuckerman, B. 2001, ApJ, 555, 932
- Spaute et al. (1991) Spaute, D., Weidenschilling, S. J., Davis, D. R., & Marzari, F. 1991, Icarus, 92, 147
- Telesco et al. (2000) Telesco, C. M., et al. 2000, ApJ, 530, 329
- Weidenschilling (1977) Weidenschilling, S. J. 1977, Ap Sp Sci, 51, 153
- Weidenschilling et al. (1997) Weidenschilling, S. J., Spaute, D., Davis, D. R., Marzari, F., & Ohtsuki, K. 1997, Icarus, 128, 429
- Weinberger et al. (2002) Weinberger, A., et al. 2002, ApJ, 566, 409
- Wetherill & Stewart (1989) Wetherill, G. W., & Stewart, G. R. 1989, Icarus 77, 300
- Wetherill & Stewart (1993) Wetherill, G. W., & Stewart, G. R. 1993, Icarus, 106, 190
- Wilner et al. (2002) Wilner, D. J., Holman, M. J., Kuchner, M. J., & Ho, P. T. P. 2002, ApJ, 569, L115